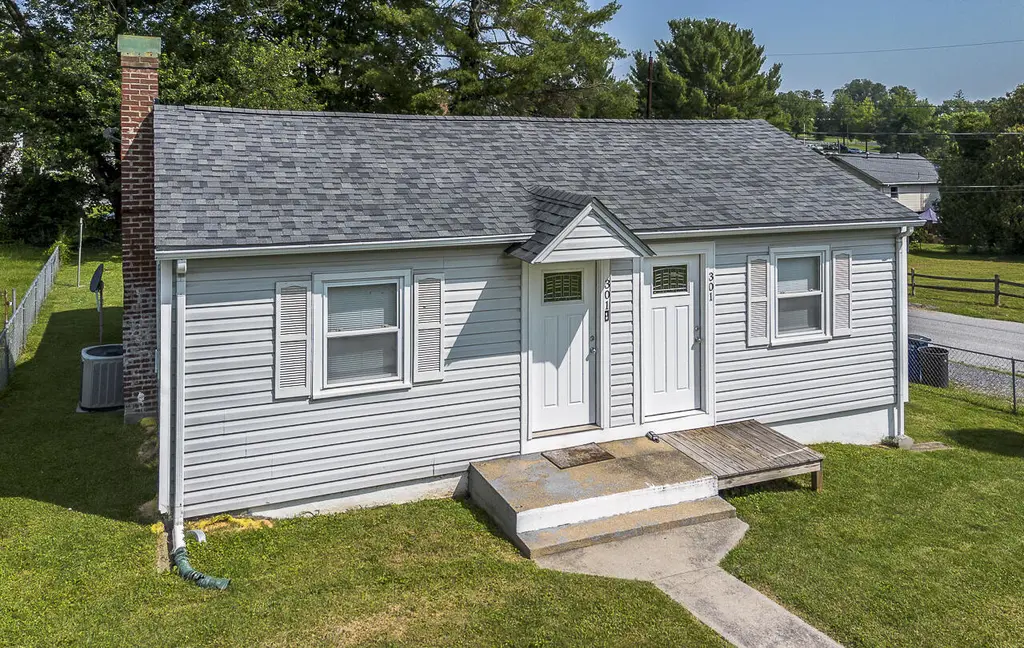
301 Walker St · Lexington, VA
Flood risk 1/10 · Minimal
- FEMA flood zone
- X (unshaded)
- Chance of flooding over 30 yrs
- 0.0%
- Est. flood insurance / yr
- $473 – $860
Fire risk 3/10 · Minor
- Est. fire insurance / yr
- $666 – $1,236
Heat risk 5/10 · Moderate
- Hot days now (above 102°F)
- 7 days/yr
- Hot days in 30 yrs
- 18 days/yr
Wind risk 2/10 · Minimal
- Chance of severe wind over 30 yrs
- 1.0%
Air-quality risk 1/10 · Minimal
- Unhealthy air days now
- 0 days/yr
- Unhealthy air days in 30 yrs
- 0 days/yr
Risk factors via First Street. Map © Google.
Why this score? — see what drove the C- grade
The composite is a weighted blend of 9 inputs, each scored 0–100. Each bar is that input's sub-score; the figure is the points it added to the 100-point composite (weight × sub-score).
- Cash flow +15.0/30.0
- ARV discount +11.0/15.0
- Schools +7.1/10.0
- DSCR +4.6/10.0
- Livability +4.0/5.0
- 1% rule +3.3/10.0
- Rent growth +2.5/5.0
- Condition / age +2.5/5.0
- Appreciation +0.0/10.0
$219,900
🖨 Deal sheet 📄 Offer letter ✓ Due diligence
Listing remarks MLS
Great corner lot located in Lexington, close to everything. Three bedroom one bath house waiting for some finishing touches in bathroom and kitchen. The three bedrooms have all had new electrical, insulation, flooring, drywall and fixtures installed. Bathroom new floor/crossbeam supports and flooring, updated electrical, new shower/tub, drywall hung but needs to be taped and mudded. No showings until May 9th.
Key facts
- 6,534 sq ft lot
- Built 1945
- Listed 3 days
Property features AI
Exterior
- Utilities: Public water; Public sewer; Cable available
- Home design: Single family residence; Residential property
- Construction: Vinyl siding; Shingle roof
- Exterior features: Corner lot
Interior
- Kitchen: Gas range
- Flooring: Laminate flooring; Tile flooring
- Bathrooms: 2 full bathrooms
- Heating & cooling: Forced air heating (electric); Heat pump; Central air conditioning; Electric cooling
- Interior features: Ceiling fans; Unfinished basement
- Laundry & utility: Washer; Dryer
Neighborhood map
What this means for you Summary
Snapshot
- This is a 3-bed/2.0-bath single-family listed at $220k.
Deal economics
- At list price, monthly cash flow is $70 ($835/yr) — positive.
- The deal already cash-flows at list — no discount required.
- To meet the 1% rule (rent ≥ 1% of price), the offer needs to be $182k (17.1% below list).
- Recommended offer: $182k (17.1% below list) — sets the bar for 1% rule.
- Cap rate 6.7% vs local median 3.3% in Lexington — top-decile yield for the area; either an underpriced asset or a hidden risk that comps aren't pricing in. Stress-test before assuming the spread holds.
Location & tenants
- Location reads 80/100 on livability (#62 in VA, #1,813 nationally) — a professional / high-income tenant draw. Strengths: crime A+, amenities A+, health & safety A+; Watch: commute F.
- Lexington City Public School District (town): math 82% / reading 88% proficiency, ranked #4 of 131 in VA (top 3%) — strong family-tenant draw, lease renewals of 3-5y typical; only 18% free/reduced lunch — higher-income household profile.
- Zoned schools: Harrington Waddell Elementary (math 82% / reading 87%, grade A+, #71 of 1,108 statewide, top 8%, 324 students, 32% FRL); Lylburn Downing Middle (math 82% / reading 87%, grade A+, #14 of 342 statewide, top 4%, 161 students, 26% FRL).
- Market conditions: 146 active listings in the ZIP; 4 comparable units currently listed for rent nearby; rentals at typical pace (median 15d on market — plan ~3-4 weeks tenant-placement turnaround); solid renter incomes; 1 units permitted in Lexington city in 2024 (0 in 5+ unit buildings).
Forward outlook
- Local home prices are declining (-3.0%/yr); year-one equity from $2k of loan paydown is wiped out by about $7k of value loss. Plan a longer hold.
- Lexington County population projected at +17% by 2050 — long-run rental-demand tailwind backs the buy-and-hold thesis.
Negotiation context
- Only 3 days on market — expect competitive offers; lowballing is unlikely to land.
- 2 sale attempts since 4y ago with the ask held roughly flat each time — persistent listings suggest the price (not the market) is what's stuck; bring a comps-based counter.
- Current owner paid $122k; list at $220k implies a 80% gain — meaningful room to come down on a strong offer.
Risks & watch-outs
- Watch-outs: built in 1945 — expect roof / HVAC / electrical / plumbing capex.
- Climate carrying-cost: extreme-heat days projected 7→18/yr by 2055 (HVAC capex compounding) — expect insurance premiums to compound above CPI over the hold.
Questions for the listing agent
- Built in 1945 — when were the roof, HVAC, electrical panel, plumbing, and water heater last replaced?
- Is there a deadline driving the sale (1031 exchange, divorce, estate, relocation)? That informs how much negotiation room exists.
- Schools are A-rated — typically a magnet for longer-tenancy family renters. What's the average tenant stay here, and is there a school-zone premium baked into asking?
- What's the average days-on-market for RENTAL listings here right now (not sales)? A rising rental-DOM trend means longer vacancies and softer asking-rent achievability than the comps imply.
- What's the recent tenant-quality profile in this submarket — average credit score on applications, eviction rate, late-payment / NSF rate, and stable-employment percentage? A property-management company in the area should have these aggregated.
- How much new for-sale + rental construction is in the pipeline within 1–3 miles? Heavy new supply typically softens prices + rents 12–24 months out; constrained supply supports both.
Investment metrics
- 1% rule
- 0.83% ✗
- Cap rate
- 6.67%
- Cash-on-cash
- 1.36%
- DSCR
- 1.06
- GRM
- 10.1
CMA / ARV
- ARV (on-the-fly)
- $238,576
- Comps found
- 8
Show comp detail 8 sales within ~0.75 mi
| Address | Dist | Beds/Ba | Sqft | Sold | Price | $/sf | Match |
|---|---|---|---|---|---|---|---|
| 301 Walker St | 0.00mi | 2/2.0 (-1) | 1,147 (0%) | 1mo | $217,000 | $189 | 94 |
| 519 Arpia St | 0.27mi | 2/2.0 (-1) | 1,200 (+5%) | 6mo | $250,000 | $208 | 69 |
| 108 Moore St | 0.34mi | 4/1.0 (+1) | 1,080 (-6%) | 5mo | $192,000 | $178 | 61 |
| 407 Morningside Dr | 0.50mi | 3/2.0 | 1,240 (+8%) | 14mo | $350,000 | $282 | 52 |
| 18 N Lewis St | 0.50mi | 3/1.5 | 1,064 (-7%) | 14mo | $350,000 | $329 | 51 |
| 209 Taylor St | 0.29mi | 2/2.0 (-1) | 1,011 (-12%) | 20mo | $145,000 | $143 | 45 |
| 713 Thornhill Rd NW | 0.65mi | 2/1.5 (-1) | 1,031 (-10%) | 2mo | $208,800 | $203 | 44 |
| 207 S Jefferson St | 0.56mi | 2/1.0 (-1) | 1,230 (+7%) | 14mo | $344,150 | $280 | 41 |
Match score weights: distance 35% · size 25% · config 20% · recency 20%. Top-matched comps best support the ARV.
Projected returns pro-forma
-3.0% appreciation · 3.0% rent growth · sell at horizon
- IRR
- -14.2%
- Equity multiple
- 0.49×
- Total profit
- $-31,266
- Equity at exit
- $32,788
- IRR
- -5.4%
- Equity multiple
- 0.65×
- Total profit
- $-21,779
- Equity at exit
- $19,013
Cash invested: $61,572 (down + closing). Projections, not guarantees.
Landlord ↔ Tenant lean methodology
- Overall (STATE)
- 55 Moderately Landlord-Leaning
- State Virginia
- 55 Moderately Landlord-Leaning · D+2
- County
- — inherits STATE
- City
- — inherits STATE
ZIP-level market 24450
- Home prices YoY
- -22.8%
- Active inventory
- 146
- Price-to-rent
- 10.1×
Monthly cashflow live
- Estimated rent
- $1,823 medium interval (Pro) →
- Mortgage (P&I)
- −$1,153
- Tax from tax record
- −$126 /mo · $1,509/yr
- Insurance
- −$92
- HOA
- −$0
- Vacancy / Maint / Mgmt
- −$383
- Net cashflow
- $70
Break-even live
UW: 25.0% down · 7.5% · 30yr · 1.5% tax · 5.0% vac · 8.0% maint · 8.0% mgmt
Financing live
Cash to close
- Down payment
- $54,975
- Closing costs
- $6,597
- Reserves months
- —
- Total cash needed
- —
Loan-product check · same deal, 3 products live
Conventional
25% down · 7.5% · 30yr
- Down + closing
- —
- Monthly P&I
- —
- Monthly cashflow
- —
- DSCR
- —
- Eligible?
- —
Personal DTI + credit; lowest rate.
DSCR
20% down · 8.5% · 30yr
- Down + closing
- —
- Monthly P&I
- —
- Monthly cashflow
- —
- DSCR
- —
- Eligible?
- —
No personal income docs; deal must DSCR.
Hard money
10% down · 12.0% · 12mo
- Down + closing
- —
- Monthly P&I
- —
- Monthly cashflow
- —
- DSCR
- —
- Eligible?
- —
Short-term bridge; refi at stabilization.
Rent comps 4 comps
| Address | Beds | Baths | Sqft | Rent | $/sqft | DOM | Units | Dist |
|---|---|---|---|---|---|---|---|---|
| 3 Jean Francis DR Lexington, VA | 3.0 | 2.0 | 1200 | $2,200 | $1.83 | 14d | 1 | 0.57mi |
| 204 S Jefferson St Lexington, VA | 2.0 | 1.0 | 792 | $1,400 | $1.77 | 14d | 1 | 0.58mi |
| 203 Myers St Apt B Lexington, VA | 2.0 | 1.0 | 1000 | $1,400 | $1.40 | 14d | 1 | 0.76mi |
| 45 Holly Park Ln #222 Lexington, VA | 2.0 | 2.0 | 1254 | $1,450 | $1.16 | 14d | 1 | 1.41mi |
Listing history 11 events
-
2026-05-03status Pending
-
2026-04-29$219,900 Active
-
2025-12-06price $242,000
-
2025-10-19price $249,500
-
2025-08-10price $252,500
-
2025-06-23price $255,000
-
2025-05-15price $259,000
-
2022-06-17soldstatus $122,000 412-char remark
Show marketing remark (412 chars)
Great corner lot located in Lexington, close to everything. Three bedroom one bath house waiting for some finishing touches in bathroom and kitchen. The three bedrooms have all had new electrical, insulation, flooring, drywall and fixtures installed. Bathroom new floor/crossbeam supports and flooring, updated electrical, new shower/tub, drywall hung but needs to be taped and mudded. No showings until May 9th.
-
2022-06-16soldstatus $122,000
-
2022-05-07$129,000 412-char remark
Show marketing remark (412 chars)
Great corner lot located in Lexington, close to everything. Three bedroom one bath house waiting for some finishing touches in bathroom and kitchen. The three bedrooms have all had new electrical, insulation, flooring, drywall and fixtures installed. Bathroom new floor/crossbeam supports and flooring, updated electrical, new shower/tub, drywall hung but needs to be taped and mudded. No showings until May 9th.
-
2015-03-10soldstatus $101,300
ⓘ Source: listings_history table (triggers on properties + properties_extension) + one-shot
backfill from property_details.listing_events for pre-trigger history.
Tax reassessment forecast VA · Resets to sale price
- Current annual tax
- $1,509 · $126/mo
- Projected year-2 tax
- $1,803 · $150/mo
- Expected delta
- +$294/yr (+$25/mo · 19.5%)
ⓘ Screening estimate from a state-policy table — verify with the county assessor before closing.
Climate risk First Street
- Flood 1/10 Low FEMA zone X (unshaded) · 0% chance over 30 yrs
- Wildfire 3/10 Moderate
- Heat 5/10 Major 7 d/yr ≥102°F today · 18 d/yr by 30 yrs out
- Wind 2/10 Low 100% chance of damaging wind over 30 yrs
- Air quality 1/10 Low 0 unhealthy d/yr today · 0 by 30 yrs out
Nearby sold comps map
Loading sold comps map…
Walkable amenities ~0.75 mi
Loading nearby amenities…
Taxation est. · year 1
- Rental income
- $21,875
- − Mortgage interest
- −$12,318
- − Property taxes
- −$1,509
- − Insurance
- −$1,100
- − Repairs & maintenance
- −$1,750
- − Management
- −$1,750
- − Depreciation
- −$6,397
- Taxable loss
- −$2,948
- Est. tax savings @ 24.0%
- +$708
- After-tax cash flow
- $1,543/yr
For passive investors: Depreciation is non-cash, so a rental often shows a tax loss while cash-flowing — sheltering income. Rental losses are passive: they offset passive income freely, and up to $25,000/yr can offset ordinary (W-2) income if you actively participate and your MAGI is under $100k (phasing out to $0 by $150k); unused losses carry forward. On sale, claimed depreciation is recaptured at up to 25%, and gains may owe capital-gains tax (a 1031 exchange can defer both). Figures are a year-1 estimate at your 24.0% rate — not tax advice; consult a CPA.
Schools (NCES district)
- District
- Lexington City Public School District
- NCES district ID
- 5102220
- Math proficiency
- 82% ▼ -9.00%
- Reading proficiency
- 88% ▬ 0.00%
- Median HH income
- $37,249
- Composite
- 70.57/100
- National rank
- #258
- State rank
- #4 of 131 in VA
Livability — Lexington
- Score
- 80/100
- State rank
- #62
- US rank
- #1813
Category grades
Schools grade is shown separately in the Schools card above.
Census & demographics
- Census place
- Lexington, VA
- County
- Rockbridge County · 17,714 people
- City population
- 17,714
- Metro
- nan
- Population (ZIP)
- 17,714
- Household income
- $76,587
- Rent vs Own
- Severe rent burden
- 429.0
Population outlook (Lexington County) Hauer SSP2
- Today (2025)
- 8,814 people
- By 2030
- 9,156 · +3.9%
- By 2040
- 9,636 · +9.3%
- By 2050
- 10,345 · +17.4%
- By 2075
- 12,696 · +44.0%
- By 2100
- 14,268 · +61.9%
Race, ethnicity, and origin ACS 2023
- Neighborhood character
- Predominantly White (86%)
- Race & ethnicity
- White 86% Two or more races 5% Black 4% Hispanic / Latino 3% Asian 2%
- Common ancestry
- Serbian 4% Italian 2% Slovak 2%
- Foreign-born
- 4% · China, Canada, South Korea
- Languages at home
- 95% English-only · Spanish 2% Chinese 1% Korean 1%
Political lean MEDSL · Lexington
- 2024 margin
- Strong D (+26.7) · D 62.7% · R 36.0% · Other 1.3%
- 2008→2024 swing
- +1.3pp toward D · 2008: 25.4pp · 2024: 26.7pp
- All cycles
- 2024: D+26.7 2020: D+32.0 2016: D+30.6 2012: D+12.6 2008: D+25.4
Not yet ingested
- Civics
- —
Market trends
- HPI YoY
- ▼ -83.84%
- Current HPI
- 283.7394
- Rent YoY
- —
- Metro
- nan
- State GDP YoY
- ▲ 2.40%
- F500 in state
- 50
Industry mix (Fortune 500 HQ in VA)
| Industry | F500 HQs | Revenue |
|---|---|---|
| Aerospace / Defense | 4 | $236B |
|
||
| Technology / Defense | 3 | $32B |
|
||
| Financial Services | 2 | $176B |
|
||
| Utilities | 2 | $27B |
|
||
| Insurance | 2 | $25B |
|
||
| Technology | 2 | $15B |
|
||
Price history
+117.1% since first listed11 events — show timeline
- 2026-05-03 Pending — RHR
- 2026-04-29 Listed $219,900 RHR
- 2025-12-06 Price Changed $242,000 RHR
- 2025-10-19 Price Changed $249,500 RHR
- 2025-08-10 Price Changed $252,500 RHR
- 2025-06-23 Price Changed $255,000 RHR
- 2025-05-15 Price Changed $259,000 RHR
- 2022-06-17 Sold (MLS) $122,000 RHR
- 2022-06-16 Sold (Public Records) $122,000 Public Records
- 2022-05-07 Listed $129,000 RHR
- 2015-03-10 Sold (Public Records) $101,300 Public Records
Property tax history
+4.0%/yrLatest (2025): $1,509 · +0.0% YoY. Source: county tax records.
Cash-flow waterfall
monthlySold comps — $/sqft
last 12 mo · ≤1 miLoading sold comps…