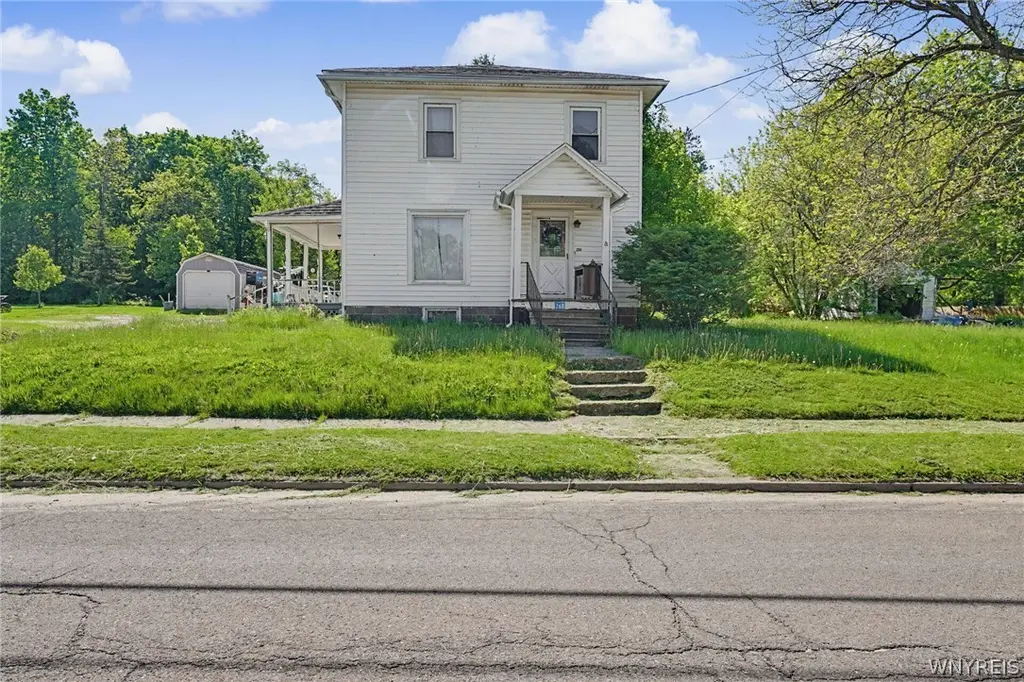
260 Main St · Richburg, NY
Flood risk 4/10 · Minor
- FEMA flood zone
- X
- Chance of flooding over 30 yrs
- 0.2%
- Est. flood insurance / yr
- $473 – $860
Fire risk 3/10 · Minor
- Est. fire insurance / yr
- $691 – $1,283
Heat risk 1/10 · Minimal
- Hot days now (above 89°F)
- 8 days/yr
- Hot days in 30 yrs
- 18 days/yr
Wind risk 1/10 · Minimal
- Chance of severe wind over 30 yrs
- —
Air-quality risk 1/10 · Minimal
- Unhealthy air days now
- 0 days/yr
- Unhealthy air days in 30 yrs
- 0 days/yr
Risk factors via First Street. Map © Google.
Why this score? — see what drove the A- grade
The composite is a weighted blend of 9 inputs, each scored 0–100. Each bar is that input's sub-score; the figure is the points it added to the 100-point composite (weight × sub-score).
- Cash flow +30.0/30.0
- ARV discount +15.0/15.0
- 1% rule +10.0/10.0
- DSCR +10.0/10.0
- Appreciation +7.2/10.0
- Schools +4.2/10.0
- Livability +3.0/5.0
- Rent growth +2.5/5.0
- Condition / age +2.5/5.0
$39,900
🖨 Deal sheet 📄 Offer letter ✓ Due diligence
Listing remarks MLS
BANK OWNED FORECLOSURE. THIS 4 BEDROOM 1.5 BATH HOME IS LOCATED IN A RURAL AREA WITH A LARGE PRIVATE LOT. SOLD AS IS WITH NEWER FURNACE AND NEWER HOT WATER TANK.
Key facts
- 0.38 acre lot
- Garage
- Built 1920
Property features AI
Exterior
- Parking: Detached garage (1 car)
- Utilities: Sewer connected; Water available (public); Water source: public
- Home design: Two-story home; Existing structure
- Construction: Vinyl siding; Composition roof; Poured and slab foundation; Built (existing)
- Exterior features: Gravel driveway; Greenbelt; Irregular lot
Interior
- Kitchen: Electric water heater (appliance listed)
- Bedrooms: One main-level bedroom
- Flooring: Hardwood; Varies
- Bathrooms: One full bathroom; One half bathroom; One main-level bathroom
- Heating & cooling: Heat pump; Central air; Electric heating
- Interior features: Pantry; Hardwood and varied flooring; Two fireplaces
- Laundry & utility: Heat pump provides heating and cooling
Neighborhood map
What this means for you Summary
Snapshot
- This is a 4-bed/1.5-bath single-family listed at $40k.
Deal economics
- At list price, monthly cash flow is $742 ($9k/yr) — positive.
- The deal already cash-flows at list — no discount required.
- Meets the 1% rule at list price ($1k rent vs $40k).
Location & tenants
- Location reads 60/100 on livability (#994 in NY) — a middle-class / working-renter tenant base. Strengths: cost of living A+, housing A+; Watch: employment D+, health & safety D, schools D-.
- Bolivar-Richburg Central School District (rural): math 50% / reading 51% proficiency, ranked #395 of 590 in NY (top 67%) — acceptable for families but not a draw, mixed tenant base, ~2y average lease.
- Market conditions: 20 active listings in the ZIP; 87 units permitted in Allegany County in 2024 (0 in 5+ unit buildings).
Forward outlook
- In year one you build about $2k of equity ($276 loan paydown + $2k appreciation (4.4% local appreciation)).
- Allegany County population projected at -26% by 2050 — secular population decline; favor cash flow + early exit over multi-decade hold.
- At projected returns (4.4% appreciation + 3.0% rent growth), your $11k cash investment doubles in ~2 years — after that, you're playing with house money.
Negotiation context
- Only 14 days on market — expect competitive offers; lowballing is unlikely to land.
- 3 sale attempts since 7y ago with the ask held roughly flat each time — persistent listings suggest the price (not the market) is what's stuck; bring a comps-based counter.
- Current owner paid $20k; list at $40k implies a 105% gain — meaningful room to come down on a strong offer.
Risks & watch-outs
- Watch-outs: built in 1920 — expect roof / HVAC / electrical / plumbing capex.
Questions for the listing agent
- Built in 1920 — when were the roof, HVAC, electrical panel, plumbing, and water heater last replaced?
- Is there a deadline driving the sale (1031 exchange, divorce, estate, relocation)? That informs how much negotiation room exists.
- Schools are D-rated, which usually means shorter tenancies and higher turnover. Who's the typical renter profile here, and what's been the actual vacancy rate?
- Crime grade is F in this area — have there been break-ins, vandalism, or insurance claims at this property in the last 3 years? What carrier currently insures it and at what premium?
- What's the average days-on-market for RENTAL listings here right now (not sales)? A rising rental-DOM trend means longer vacancies and softer asking-rent achievability than the comps imply.
- What's the recent tenant-quality profile in this submarket — average credit score on applications, eviction rate, late-payment / NSF rate, and stable-employment percentage? A property-management company in the area should have these aggregated.
- How much new for-sale + rental construction is in the pipeline within 1–3 miles? Heavy new supply typically softens prices + rents 12–24 months out; constrained supply supports both.
Investment metrics
- 1% rule
- 3.23% ✓
- Cap rate
- 28.60%
- Cash-on-cash
- 79.66%
- DSCR
- 4.54
- GRM
- 2.6
CMA / ARV
- ARV (on-the-fly)
- $76,032
- Comps found
- 1
Show comp detail 1 sale within ~0.75 mi
| Address | Dist | Beds/Ba | Sqft | Sold | Price | $/sf | Match |
|---|---|---|---|---|---|---|---|
| 267 Main St | 0.03mi | 3/1.5 (-1) | 1,768 (+2%) | 6mo | $77,503 | $44 | 84 |
Match score weights: distance 35% · size 25% · config 20% · recency 20%. Top-matched comps best support the ARV.
Projected returns pro-forma
4.4% appreciation · 3.0% rent growth · sell at horizon
- IRR
- 85.2%
- Equity multiple
- 5.93×
- Total profit
- $55,085
- Equity at exit
- $21,160
- IRR
- 83.8%
- Equity multiple
- 12.32×
- Total profit
- $126,423
- Equity at exit
- $35,373
Cash invested: $11,172 (down + closing). Projections, not guarantees.
Landlord ↔ Tenant lean methodology
- Overall (STATE)
- 15 Strongly Tenant-Friendly
- State New York
- 15 Strongly Tenant-Friendly · D+10
- County
- — inherits STATE
- City
- — inherits STATE
ZIP-level market 14715
- Home prices YoY
- 1.4%
- Active inventory
- 20
- Price-to-rent
- 2.6×
Monthly cashflow live
- Estimated rent
- $1,288 medium interval (Pro) →
- Mortgage (P&I)
- −$209
- Tax est. 1.5%
- −$50 /mo · $598/yr
- Insurance
- −$17
- HOA
- −$0
- Vacancy / Maint / Mgmt
- −$270
- Net cashflow
- $742
Break-even live
UW: 25.0% down · 7.5% · 30yr · 1.5% tax · 5.0% vac · 8.0% maint · 8.0% mgmt
Financing live
Cash to close
- Down payment
- $9,975
- Closing costs
- $1,197
- Reserves months
- —
- Total cash needed
- —
Loan-product check · same deal, 3 products live
Conventional
25% down · 7.5% · 30yr
- Down + closing
- —
- Monthly P&I
- —
- Monthly cashflow
- —
- DSCR
- —
- Eligible?
- —
Personal DTI + credit; lowest rate.
DSCR
20% down · 8.5% · 30yr
- Down + closing
- —
- Monthly P&I
- —
- Monthly cashflow
- —
- DSCR
- —
- Eligible?
- —
No personal income docs; deal must DSCR.
Hard money
10% down · 12.0% · 12mo
- Down + closing
- —
- Monthly P&I
- —
- Monthly cashflow
- —
- DSCR
- —
- Eligible?
- —
Short-term bridge; refi at stabilization.
Listing history 11 events
-
2026-06-18days on market $39,900 Active 14 DOM
-
2026-06-17days on market $39,900 Active 13 DOM
-
2026-06-16days on market $39,900 Active 12 DOM
-
2026-06-15days on market $39,900 Active 11 DOM
-
2026-06-13days on market $39,900 Active 9 DOM
-
2026-06-12days on market $39,900 Active 8 DOM
-
2026-06-09days on market $39,900 Active 5 DOM
-
2026-06-08days on market $39,900 Active 4 DOM
-
2026-06-07days on market $39,900 Active 3 DOM
-
2026-06-07remarks 699-char remark
-
2026-06-07$39,900 Active 2 DOM
ⓘ Source: listings_history table (triggers on properties + properties_extension) + one-shot
backfill from property_details.listing_events for pre-trigger history.
Climate risk First Street
- Flood 4/10 Moderate FEMA zone X · 20% chance over 30 yrs
- Wildfire 3/10 Moderate
- Heat 1/10 Low 8 d/yr ≥89°F today · 18 d/yr by 30 yrs out
- Wind 1/10 Low
- Air quality 1/10 Low 0 unhealthy d/yr today · 0 by 30 yrs out
Nearby sold comps map
Loading sold comps map…
Walkable amenities ~0.75 mi
Loading nearby amenities…
Taxation est. · year 1
- Rental income
- $15,453
- − Mortgage interest
- −$2,235
- − Property taxes
- −$598
- − Insurance
- −$200
- − Repairs & maintenance
- −$1,236
- − Management
- −$1,236
- − Depreciation
- −$1,161
- Taxable income
- $8,787
- Est. tax owed @ 24.0%
- −$2,109
- After-tax cash flow
- $6,790/yr
For passive investors: Depreciation is non-cash, so a rental often shows a tax loss while cash-flowing — sheltering income. Rental losses are passive: they offset passive income freely, and up to $25,000/yr can offset ordinary (W-2) income if you actively participate and your MAGI is under $100k (phasing out to $0 by $150k); unused losses carry forward. On sale, claimed depreciation is recaptured at up to 25%, and gains may owe capital-gains tax (a 1031 exchange can defer both). Figures are a year-1 estimate at your 24.0% rate — not tax advice; consult a CPA.
Schools (NCES district)
- District
- Bolivar-Richburg Central School District
- NCES district ID
- 3600012
- Math proficiency
- 50% ▲ 9.00%
- Reading proficiency
- 51% ▲ 8.00%
- Median HH income
- $40,153
- Composite
- 42.26/100
- National rank
- #3277
- State rank
- #395 of 590 in NY
Livability — Richburg
- Score
- 60/100
- State rank
- #994
- US rank
- #19418
Category grades
Schools grade is shown separately in the Schools card above.
Census & demographics
- Census place
- Richburg, NY
- City population
- 322
- Population (ZIP)
- 2,374
Population outlook (Allegany County) Hauer SSP2
- Today (2025)
- 45,362 people
- By 2030
- 43,078 · -5.0%
- By 2040
- 38,031 · -16.2%
- By 2050
- 33,634 · -25.9%
- By 2075
- 25,285 · -44.3%
- By 2100
- 18,902 · -58.3%
Race, ethnicity, and origin ACS 2023
- Neighborhood character
- Predominantly White (97%)
- Race & ethnicity
- White 97% Two or more races 2%
- Common ancestry
- Slovak 3% Romanian 2% Italian 2%
- Foreign-born
- 0%
Political lean MEDSL · Allegany
- 2024 margin
- Solid R (+43.2) · D 28.4% · R 71.6%
- 2008→2024 swing
- -21.5pp toward R · 2008: -21.7pp · 2024: -43.2pp
- All cycles
- 2024: R+43.2 2020: R+38.9 2016: R+42.3 2012: R+25.3 2008: R+21.7
Not yet ingested
- Civics
- —
Market trends
- HPI YoY
- ▲ 4.40%
- Current HPI
- 312.0332
- Rent YoY
- —
- Metro
- —
- State GDP YoY
- ▲ 2.60%
- F500 in state
- 92
Industry mix (Fortune 500 HQ in NY)
| Industry | F500 HQs | Revenue |
|---|---|---|
| Financial Services | 10 | $950B |
|
||
| Consumer Goods | 9 | $162B |
|
||
| Insurance | 4 | $225B |
|
||
| Telecommunications | 2 | $144B |
|
||
| Pharmaceuticals | 2 | $112B |
|
||
| Media / Entertainment | 2 | $69B |
|
||
Price history
-20.2% since first listed6 events — show timeline
- 2026-06-04 Listed $39,900 WNYREIS
- 2020-03-18 Sold (MLS) $19,500 WNYREIS
- 2020-02-04 Listed $19,500 WNYREIS
- 2020-02-04 Listing Removed — WNYREIS
- 2019-12-31 Listed $20,800 WNYREIS
- 2010-11-05 Sold (Public Records) $50,000 Public Records
Property tax history
+2.9%/yrLatest (2025): $2,745 · +2.8% YoY. Source: county tax records.
Cash-flow waterfall
monthlySold comps — $/sqft
last 12 mo · ≤1 miLoading sold comps…