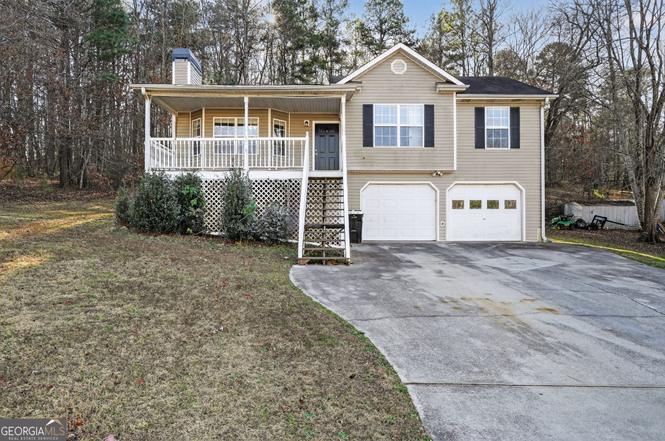
194 Fairview Oak Pl · Braswell, GA
Flood risk 1/10 · Minimal
- FEMA flood zone
- X (unshaded)
- Chance of flooding over 30 yrs
- 0.0%
- Est. flood insurance / yr
- $473 – $860
Fire risk 5/10 · Moderate
- Est. fire insurance / yr
- $963 – $1,789
Heat risk 4/10 · Minor
- Hot days now (above 102°F)
- 7 days/yr
- Hot days in 30 yrs
- 18 days/yr
Wind risk 4/10 · Minor
- Chance of severe wind over 30 yrs
- 19.0%
Air-quality risk 4/10 · Minor
- Unhealthy air days now
- 4 days/yr
- Unhealthy air days in 30 yrs
- 5 days/yr
Risk factors via First Street. Map © Google.
Why this score? — see what drove the D+ grade
The composite is a weighted blend of 9 inputs, each scored 0–100. Each bar is that input's sub-score; the figure is the points it added to the 100-point composite (weight × sub-score).
- Cash flow +15.0/30.0
- ARV discount +15.0/15.0
- DSCR +4.6/10.0
- 1% rule +3.7/10.0
- Schools +3.6/10.0
- Livability +3.0/5.0
- Condition / age +2.5/5.0
- Rent growth +1.8/5.0
- Appreciation +0.0/10.0
$229,900
🖨 Deal sheet (PDF) 📄 Offer letter ✓ Due diligence
Listing remarks
Welcome to 194 Fairview Oak Pl in Dallas, GA! This charming 3-bedroom, 2-bath home offers 1,277 sq ft of comfortable, single-level living in a peaceful and well-kept community. Step inside to an inviting, open floor plan featuring a bright living area, a cozy dining space, and a functional kitchen perfect for everyday meals or entertaining. The spacious primary suite includes a private full bath, while two additional bedrooms provide flexibility for guests, a home office, or a growing family. Enjoy low-maintenance living with a manageable yard and convenient access to nearby shops, schools, parks, and major highways.
Key facts
- Open floor plan
- Manageable yard
- Convenient access
Tags
Neighborhood map
What this means for you Summary
Snapshot
- This is a 3-bed/2.0-bath single-family listed at $230k.
Deal economics
- At list price, monthly cash flow is $73 ($879/yr) — positive.
- The deal already cash-flows at list — no discount required.
- To meet the 1% rule (rent ≥ 1% of price), the offer needs to be $201k (12.5% below list).
- Recommended offer: $201k (12.5% below list) — sets the bar for 1% rule.
- Cap rate 6.7% vs local median 3.4% in Braswell — top-decile yield for the area; either an underpriced asset or a hidden risk that comps aren't pricing in. Stress-test before assuming the spread holds.
Location & tenants
- Location reads 60/100 on livability (#380 in GA) — a middle-class / working-renter tenant base. Strengths: crime A+, cost of living A+, housing A; Watch: amenities F, commute F, employment D-.
- Paulding County (suburban): math 39% / reading 42% proficiency, ranked #33 of 174 in GA (top 19%) — families likely to look elsewhere, expect single-tenant / working-renter base with shorter leases.
- Zoned schools: Sara M. Ragsdale Elementary (math 37% / reading 36%, grade F, #509 of 1,228 statewide, top 42%, 604 students, 56% FRL); Carl Scoggins Sr. Middle School (math 29% / reading 40%, grade F, #196 of 470 statewide, top 42%, 760 students, 47% FRL); Paulding County High School (math 19% / reading 37%, grade F, #155 of 424 statewide, top 37%, 2,005 students, 48% FRL) — zoned schools average 50% FRL vs 33% district-wide (17 pts higher); higher-poverty schools than district average — tighter screening recommended.
- Market conditions: Rents soft (-2.8%/yr); 614 active listings in the ZIP; 1 comparable units currently listed for rent nearby; solid renter incomes; 1,458 units permitted in Paulding County in 2024 (0 in 5+ unit buildings).
Forward outlook
- Local home prices are declining (-3.0%/yr); year-one equity from $2k of loan paydown is wiped out by about $7k of value loss. Plan a longer hold.
- Paulding County population projected at +24% by 2050 — long-run rental-demand tailwind backs the buy-and-hold thesis.
Negotiation context
- It's been on market 132 days — a 12% lower offer ($202k) is reasonable based on typical stale-listing flexibility.
- 7 sale attempts since 13y ago; this cycle's ask has dropped $30k (12%) from the opening price — seller is motivated, your offer sets the floor, not the list.
- Current owner paid $80k; list at $230k implies a 187% gain — meaningful room to come down on a strong offer.
Risks & watch-outs
- Climate carrying-cost: moderate wildfire risk — expect insurance premiums to compound above CPI over the hold.
Questions for the listing agent
- It's been on market 132 days. Have you received any prior offers? Is the seller open to a 13% concession, seller financing, or rate buy-down credit?
- Why hasn't it sold? Are there any deal-killer items the seller is aware of (foundation, flood, title, zoning, code violations)?
- Is there a deadline driving the sale (1031 exchange, divorce, estate, relocation)? That informs how much negotiation room exists.
- Schools are F-rated, which usually means shorter tenancies and higher turnover. Who's the typical renter profile here, and what's been the actual vacancy rate?
- The area grade is low — what's the realistic commute time and amenity access for the typical tenant pool here? Any planned neighborhood developments (good or bad) we should know about?
- What's the average days-on-market for RENTAL listings here right now (not sales)? A rising rental-DOM trend means longer vacancies and softer asking-rent achievability than the comps imply.
- What's the recent tenant-quality profile in this submarket — average credit score on applications, eviction rate, late-payment / NSF rate, and stable-employment percentage? A property-management company in the area should have these aggregated.
- How much new for-sale + rental construction is in the pipeline within 1–3 miles? Heavy new supply typically softens prices + rents 12–24 months out; constrained supply supports both.
Investment metrics
- 1% rule
- 0.87% ✗
- Cap rate
- 6.68%
- Cash-on-cash
- 1.37%
- DSCR
- 1.06
- GRM
- 9.5
CMA / ARV
- ARV (on-the-fly)
- $280,101
- Comps found
- 8
Show comp detail 8 sales within ~0.75 mi
| Address | Dist | Beds/Ba | Sqft | Sold | Price | $/sf | Match |
|---|---|---|---|---|---|---|---|
| 40 Fairview Knl | 0.35mi | 3/2.0 | 1,279 (0%) | 1mo | $279,900 | $219 | 83 |
| 698 Fairview Dr | 0.23mi | 3/3.0 | 1,306 (+2%) | 2mo | $257,000 | $197 | 80 |
| 84 Fairview Knl | 0.35mi | 3/2.0 | 1,285 (+0%) | 6mo | $279,900 | $218 | 77 |
| 600 Fairview Dr | 0.14mi | 3/2.0 | 1,306 (+2%) | 16mo | $290,000 | $222 | 76 |
| 167 Fairview Oak Trl | 0.33mi | 3/2.0 | 1,280 (+0%) | 10mo | $282,000 | $220 | 76 |
| 236 Fairview Dr | 0.30mi | 3/2.0 | 1,230 (-4%) | 12mo | $281,000 | $228 | 70 |
| 119 Fred Poole Trce | 0.10mi | 3/2.0 | 1,337 (+4%) | 24mo | $280,000 | $209 | 68 |
| 1863 Gold Mine Rd | 0.44mi | 3/1.5 | 1,118 (-13%) | 2mo | $240,000 | $215 | 55 |
Match score weights: distance 35% · size 25% · config 20% · recency 20%. Top-matched comps best support the ARV.
Projected returns pro-forma
-3.0% appreciation · 0.0% rent growth · sell at horizon
- IRR
- -17.4%
- Equity multiple
- 0.40×
- Total profit
- $-38,496
- Equity at exit
- $34,279
- IRR
- -16.0%
- Equity multiple
- 0.22×
- Total profit
- $-50,346
- Equity at exit
- $19,878
Cash invested: $64,372 (down + closing). Projections, not guarantees.
Landlord ↔ Tenant lean methodology
- Overall (STATE)
- 90 Strongly Landlord-Friendly
- State Georgia
- 90 Strongly Landlord-Friendly · R+3
- County
- — inherits STATE
- City
- — inherits STATE
ZIP-level market 30157
- Home prices YoY
- -9.4%
- Rents YoY
- -2.8%
- Active inventory
- 614
- Price-to-rent
- 9.5×
Monthly cashflow live
- Estimated rent
- $2,011 medium interval (Pro) →
- Mortgage (P&I)
- −$1,206
- Tax from tax record
- −$214 /mo · $2,565/yr
- Insurance
- −$96
- HOA
- −$0
- Vacancy / Maint / Mgmt
- −$422
- Net cashflow
- $73
Break-even live
Sensitivity live
| Price | -10% $203 | -5% $138 | +0% $73 | +5% $8 | +10% $-57 |
|---|---|---|---|---|---|
| Rent | -10% $-86 | -5% $-6 | +0% $73 | +5% $153 | +10% $232 |
| Rate | -1.0pp $189 | -0.5pp $132 | base $73 | +0.5pp $14 | +1.0pp $-47 |
UW: 25.0% down · 7.5% · 30yr · 1.5% tax · 5.0% vac · 8.0% maint · 8.0% mgmt
Financing live
Cash to close
- Down payment
- $57,475
- Closing costs
- $6,897
- Reserves months
- —
- Total cash needed
- —
Loan-product check · same deal, 3 products live
Conventional
25% down · 7.5% · 30yr
- Down + closing
- —
- Monthly P&I
- —
- Monthly cashflow
- —
- DSCR
- —
- Eligible?
- —
Personal DTI + credit; lowest rate.
DSCR
20% down · 8.5% · 30yr
- Down + closing
- —
- Monthly P&I
- —
- Monthly cashflow
- —
- DSCR
- —
- Eligible?
- —
No personal income docs; deal must DSCR.
Hard money
10% down · 12.0% · 12mo
- Down + closing
- —
- Monthly P&I
- —
- Monthly cashflow
- —
- DSCR
- —
- Eligible?
- —
Short-term bridge; refi at stabilization.
Rent comps 1 comps
| Address | Beds | Baths | Sqft | Rent | $/sqft | DOM | Units | Dist |
|---|---|---|---|---|---|---|---|---|
| 58 Fairview Oak Trce Dallas, GA | 4.0 | 2.5 | 1679 | $1,701 | $1.01 | 3d | 1 | 0.17mi |
Listing history 34 events
-
2026-06-21statusdays on market $229,900 Active 132 DOM
-
2026-06-18status $229,900 Back On Market 129 DOM
-
2026-04-27status Under Contract
-
2026-04-17price $229,900
-
2026-03-06price $244,900
-
2026-02-22status Back On Market
-
2026-02-16status Under Contract
-
2026-01-30price $249,900
-
2026-01-09price $254,900
-
2025-12-13$259,900 New
-
2025-11-28historical
-
2025-11-28historical
-
2025-10-02price $263,900
-
2025-10-02price $263,900
-
2025-09-12price $275,900
-
2025-09-12price $275,900
-
2025-09-04historical
-
2025-09-03price $282,900
-
2025-09-03price $282,900
-
2025-08-22price $284,900
-
2025-08-22price $284,900
-
2025-07-28$289,900 Active
-
2025-07-28$284,900 New
-
2025-07-28$289,900 New
-
2014-03-28soldstatus $80,000
-
2014-03-21historical
-
2014-03-13historical
-
2014-03-12soldstatus $80,000 Sold
-
2014-03-12soldstatus $80,000 Sold
-
2013-08-21status Under Contract
-
2013-08-14status Pending Offer Approval
-
2013-08-14historical Pending Approval
-
2013-08-07$80,000 New
-
2013-08-07$80,000 Active
ⓘ Source: listings_history table (triggers on properties + properties_extension) + one-shot
backfill from property_details.listing_events for pre-trigger history.
Tax reassessment forecast GA · Resets to sale price
- Current annual tax
- $2,565 · $214/mo
- Projected year-2 tax
- $2,565 · $214/mo
- Expected delta
- $0/yr ($0/mo · 0.0%)
ⓘ Screening estimate from a state-policy table — verify with the county assessor before closing.
Climate risk First Street
- Flood 1/10 Low FEMA zone X (unshaded) · 0% chance over 30 yrs
- Wildfire 5/10 Major
- Heat 4/10 Moderate 7 d/yr ≥102°F today · 18 d/yr by 30 yrs out
- Wind 4/10 Moderate 19% chance of damaging wind over 30 yrs
- Air quality 4/10 Moderate 4 unhealthy d/yr today · 5 by 30 yrs out
Nearby sold comps map
Loading sold comps map…
Walkable amenities ~0.75 mi
Loading nearby amenities…
Taxation est. · year 1
- Rental income
- $24,128
- − Mortgage interest
- −$12,878
- − Property taxes
- −$2,565
- − Insurance
- −$1,150
- − Repairs & maintenance
- −$1,930
- − Management
- −$1,930
- − Depreciation
- −$6,688
- Taxable loss
- −$3,013
- Est. tax savings @ 24.0%
- +$723
- After-tax cash flow
- $1,602/yr
For passive investors: Depreciation is non-cash, so a rental often shows a tax loss while cash-flowing — sheltering income. Rental losses are passive: they offset passive income freely, and up to $25,000/yr can offset ordinary (W-2) income if you actively participate and your MAGI is under $100k (phasing out to $0 by $150k); unused losses carry forward. On sale, claimed depreciation is recaptured at up to 25%, and gains may owe capital-gains tax (a 1031 exchange can defer both). Figures are a year-1 estimate at your 24.0% rate — not tax advice; consult a CPA.
Schools (NCES district)
- District
- Paulding County
- NCES district ID
- 1304020
- Math proficiency
- 39% ▼ -6.00%
- Reading proficiency
- 42% ▼ -7.00%
- Median HH income
- $61,447
- Composite
- 36.0/100
- National rank
- #4784
- State rank
- #33 of 174 in GA
Livability — Braswell
- Score
- 60/100
- State rank
- #380
- US rank
- #19219
Category grades
Schools grade is shown separately in the Schools card above.
Census & demographics
- County
- Paulding County · 134,013 people
- Metro
- Atlanta-Sandy Springs-Alpharetta, GA
- Population (ZIP)
- 53,445
- Household income
- $93,625
- Rent vs Own
- Severe rent burden
- 375.0
Population outlook (Paulding County) Hauer SSP2
- Today (2025)
- 175,714 people
- By 2030
- 186,082 · +5.9%
- By 2040
- 204,414 · +16.3%
- By 2050
- 217,040 · +23.5%
- By 2075
- 236,980 · +34.9%
- By 2100
- 238,314 · +35.6%
Race, ethnicity, and origin ACS 2023
- Neighborhood character
- Predominantly White (72%)
- Race & ethnicity
- White 72% Black 13% Two or more races 9% Hispanic / Latino 8% Asian 1%
- Hispanic origin (detail)
- Mexican 3% Puerto Rican 2%
- Common ancestry
- Lithuanian 2% Italian 2% Slovak 1%
- Foreign-born
- 5% · Canada
- Languages at home
- 93% English-only · Spanish 5% French/Haitian/Cajun 1% Other Asian/Pacific 1%
Political lean MEDSL · Paulding
- 2024 margin
- Strong R (+24.1) · D 37.6% · R 61.7%
- 2008→2024 swing
- +14.4pp toward D · 2008: -38.5pp · 2024: -24.1pp
- All cycles
- 2024: R+24.1 2020: R+29.1 2016: R+41.2 2012: R+43.6 2008: R+38.5
Not yet ingested
- Civics
- —
Market trends
- HPI YoY
- ▼ -34.28%
- Current HPI
- 330.3487
- Rent YoY
- ▼ -2.83%
- Metro
- Atlanta-Sandy Springs-Alpharetta, GA
- State GDP YoY
- ▲ 2.66%
- F500 in state
- 28
Industry mix (Fortune 500 HQ in GA)
| Industry | F500 HQs | Revenue |
|---|---|---|
| Paper / Packaging | 2 | $29B |
|
||
| Retail | 1 | $160B |
|
||
| Transportation / Logistics | 1 | $91B |
|
||
| Airlines | 1 | $62B |
|
||
| Consumer Goods | 1 | $47B |
|
||
| Utilities | 1 | $25B |
|
||
Price history
+187.4% since first listed32 events — show timeline
- 2026-04-27 Pending — GAMLS
- 2026-04-17 Price Changed $229,900 GAMLS
- 2026-03-06 Price Changed $244,900 GAMLS
- 2026-02-22 Relisted — GAMLS
- 2026-02-16 Pending — GAMLS
- 2026-01-30 Price Changed $249,900 GAMLS
- 2026-01-09 Price Changed $254,900 GAMLS
- 2025-12-13 Listed $259,900 GAMLS
- 2025-11-28 Listing Removed — GAMLS
- 2025-11-28 Listing Removed — FMLS
- 2025-10-02 Price Changed $263,900 GAMLS
- 2025-10-02 Price Changed $263,900 FMLS
- 2025-09-12 Price Changed $275,900 GAMLS
- 2025-09-12 Price Changed $275,900 FMLS
- 2025-09-04 Listing Removed — GAMLS
- 2025-09-03 Price Changed $282,900 GAMLS
- 2025-09-03 Price Changed $282,900 FMLS
- 2025-08-22 Price Changed $284,900 GAMLS
- 2025-08-22 Price Changed $284,900 FMLS
- 2025-07-28 Listed $289,900 GAMLS
- 2025-07-28 Listed $284,900 GAMLS
- 2025-07-28 Listed $289,900 FMLS
- 2014-03-28 Sold (Public Records) $80,000 Public Records
- 2014-03-21 Listing Removed — FMLS
- 2014-03-13 Listing Removed — GAMLS
- 2014-03-12 Sold (MLS) $80,000 GAMLS
- 2014-03-12 Sold (MLS) $80,000 FMLS
- 2013-08-21 Pending — GAMLS
- 2013-08-14 Pending — FMLS
- 2013-08-14 Contingent — GAMLS
- 2013-08-07 Listed $80,000 GAMLS
- 2013-08-07 Listed $80,000 FMLS
Property tax history
+3.0%/yrLatest (2025): $2,565 · -0.0% YoY. Source: county tax records.
Cash-flow waterfall
monthlySold comps — $/sqft
last 12 mo · ≤1 miLoading sold comps…