 🏗️ New Construction
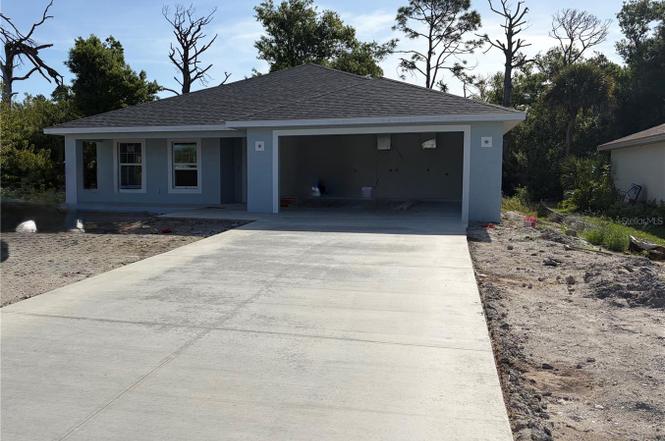
119 Siesta Rd · Rotonda, FL
Flood risk 7/10 · Major
- FEMA flood zone
- X (shaded)
- Chance of flooding over 30 yrs
- 0.74%
- Est. flood insurance / yr
- $507 – $1,088
Fire risk 1/10 · Minimal
- Est. fire insurance / yr
- $947 – $1,759
Heat risk 10/10 · Severe
- Hot days now (above 107°F)
- 7 days/yr
- Hot days in 30 yrs
- 29 days/yr
Wind risk 10/10 · Severe
- Chance of severe wind over 30 yrs
- 99.0%
Air-quality risk 2/10 · Minimal
- Unhealthy air days now
- 1 days/yr
- Unhealthy air days in 30 yrs
- 1 days/yr
Risk factors via First Street. Map © Google.
Why this score? — see what drove the D+ grade
The composite is a weighted blend of 9 inputs, each scored 0–100. Each bar is that input's sub-score; the figure is the points it added to the 100-point composite (weight × sub-score).
- Cash flow +13.6/30.0
- ARV discount +7.5/15.0
- Appreciation +5.6/10.0
- Schools +4.6/10.0
- DSCR +4.1/10.0
- 1% rule +3.9/10.0
- Livability +3.4/5.0
- Condition / age +2.5/5.0
- Rent growth +2.4/5.0
$304,900
🖨 Deal sheet 📄 Offer letter ✓ Due diligence
Listing remarks
Under Construction. FLOOD ZONE X!!!! Under Construction!!! Beautiful Brand New Home!!!Under construction!! This TRB Model is a wonderful home design encompassing 3 bedrooms, 2 baths, and a 2 car garage across 1752 sq. ft. of living space. The open kitchen includes a walk-in pantry, spacious island, breakfast/dining area, and French Doors leading to the large lanai. The master bedroom includes a walk-in closet, walk-in shower, and dual sink vanity. The remaining 2 bedrooms are located by a secondary bath which includes a shower. The home features cathedral ceilings, wood look tile throughout, granite countertops in the kitchen and bathrooms, recessed lighting, ceiling fans in every room, and
Key facts
- Spacious island
- French doors
- Large lanai
Tags
Property features AI
Finance
- Other: Lot approximately 0.18 acres; Total living area reported as 1,752 (builder); Building total area reported as 2,724; Permit number issued
- HOA & community: HOA required (annual fee $135; approximately $11.25/month); Association name listed; Pets allowed
Exterior
- Parking: Attached 2-car garage
- Utilities: Public water; Public sewer; Electricity connected; Water connected
- Home design: Single-family residence; One level; Under construction (projected completion mid-May 2026); Faces west
- Construction: Block and stucco construction; Shingle roof; Block and slab foundation; New construction by Snyder Construction (model TRB)
- Exterior features: Hurricane shutters; Asphalt road access
Interior
- Kitchen: Dishwasher; Disposal; Range; Refrigerator
- Bedrooms: 3 bedrooms
- Flooring: Tile flooring
- Bathrooms: 2 full bathrooms
- Heating & cooling: Central heating; Central air conditioning
- Interior features: Ceiling fans; Open floor plan; Stone countertops; Walk-in closets
- Laundry & utility: Dedicated laundry room
Neighborhood map
What this means for you Summary
Snapshot
- This is a 3-bed/2.0-bath land listed at $305k.
Deal economics
- At list price, monthly cash flow is $-49 ($-586/yr) — negative.
- To cash-flow at today's rent, offer at most $298k (2.3% below list).
- To meet the 1% rule (rent ≥ 1% of price), the offer needs to be $270k (11.3% below list).
- Recommended offer: $270k (11.3% below list) — sets the bar for 1% rule.
- Cap rate 6.4% vs local median 3.1% in Rotonda — top-decile yield for the area; either an underpriced asset or a hidden risk that comps aren't pricing in. Stress-test before assuming the spread holds.
Location & tenants
- Location reads 67/100 on livability (#548 in FL) — a middle-class / working-renter tenant base. Strengths: crime A+, housing A-, cost of living B+; Watch: schools D, amenities F, commute F.
- Charlotte (suburban): math 54% / reading 54% proficiency, ranked #22 of 73 in FL (top 30%) — acceptable for families but not a draw, mixed tenant base, ~2y average lease.
- Market conditions: Rents soft (-0.2%/yr); 863 active listings in the ZIP; 23 comparable units currently listed for rent nearby; rentals at typical pace (median 21d on market — plan ~3-4 weeks tenant-placement turnaround); solid renter incomes; 4,585 units permitted in Charlotte County in 2024 (703 in 5+ unit buildings).
- This rent runs 41% of the median local income ($80k/yr) — at the standard rent-burdened threshold; future hikes will face affordability resistance.
Forward outlook
- In year one you build about $6k of equity ($2k loan paydown + $4k appreciation (1.2% local appreciation)).
- Charlotte County population projected at +24% by 2050 — long-run rental-demand tailwind backs the buy-and-hold thesis.
- By year 6, paydown + projected appreciation supports a ~$33k cash-out refi (75% LTV) — recoverable capital for the next deal without selling this one.
Negotiation context
- It's been on market 75 days — a 6% lower offer ($287k) is reasonable based on typical stale-listing flexibility.
- Current owner paid $265k; 15% above their basis — modest negotiation headroom, anchor on the comps not their cost.
Risks & watch-outs
- Watch-outs: flood insurance adds $66/mo.
- Climate carrying-cost: major flood risk; severe wind risk, 99% chance of damaging wind over 30y; extreme-heat days projected 7→29/yr by 2055 (HVAC capex compounding) — expect insurance premiums to compound above CPI over the hold.
Questions for the listing agent
- What do current leases actually rent for vs. the listed asking? Can we see a recent rent roll and the last 12 months of T-12 income?
- It's been on market 75 days. Have you received any prior offers? Is the seller open to a 11% concession, seller financing, or rate buy-down credit?
- What's the actual annual flood-insurance premium (NFIP or private), and is the property in a SFHA with mandatory coverage?
- What does the HOA fee cover, when was the last increase, and are there any pending special assessments or reserve-fund shortfalls?
- Why hasn't it sold? Are there any deal-killer items the seller is aware of (foundation, flood, title, zoning, code violations)?
- Is there a deadline driving the sale (1031 exchange, divorce, estate, relocation)? That informs how much negotiation room exists.
- Schools are D-rated, which usually means shorter tenancies and higher turnover. Who's the typical renter profile here, and what's been the actual vacancy rate?
- The area grade is low — what's the realistic commute time and amenity access for the typical tenant pool here? Any planned neighborhood developments (good or bad) we should know about?
- What's the average days-on-market for RENTAL listings here right now (not sales)? A rising rental-DOM trend means longer vacancies and softer asking-rent achievability than the comps imply.
- What's the recent tenant-quality profile in this submarket — average credit score on applications, eviction rate, late-payment / NSF rate, and stable-employment percentage? A property-management company in the area should have these aggregated.
- How much new for-sale + rental construction is in the pipeline within 1–3 miles? Heavy new supply typically softens prices + rents 12–24 months out; constrained supply supports both.
Investment metrics
- 1% rule
- 0.89% ✗
- Cap rate
- 6.36%
- Cash-on-cash
- 0.25%
- DSCR
- 1.01
- GRM
- 9.4
CMA / ARV
No comps found within radius.
Projected returns pro-forma
1.25% appreciation · 0.0% rent growth · sell at horizon
- IRR
- -0.3%
- Equity multiple
- 0.98×
- Total profit
- $-1,494
- Equity at exit
- $108,074
- IRR
- 2.6%
- Equity multiple
- 1.31×
- Total profit
- $26,355
- Equity at exit
- $146,754
Cash invested: $85,372 (down + closing). Projections, not guarantees.
Landlord ↔ Tenant lean methodology
- Overall (STATE)
- 87 Strongly Landlord-Friendly
- State Florida
- 87 Strongly Landlord-Friendly · R+3
- County
- — inherits STATE
- City
- — inherits STATE
ZIP-level market 33947
- Home prices YoY
- 0.4%
- Rents YoY
- -0.2%
- Active inventory
- 863
- Price-to-rent
- 9.4×
Monthly cashflow live
- Estimated rent
- $2,703 high interval (Pro) →
- Mortgage (P&I)
- −$1,599
- Tax est. 1.5%
- −$381 /mo · $4,574/yr
- Insurance
- −$127
- Flood insurance flood zone
- −$66 /mo · $798/yr
- HOA
- −$11
- Vacancy / Maint / Mgmt
- −$568
- Net cashflow
- $-49
Break-even live
UW: 25.0% down · 7.5% · 30yr · 1.5% tax · 5.0% vac · 8.0% maint · 8.0% mgmt
Financing live
Cash to close
- Down payment
- $76,225
- Closing costs
- $9,147
- Reserves months
- —
- Total cash needed
- —
Loan-product check · same deal, 3 products live
Conventional
25% down · 7.5% · 30yr
- Down + closing
- —
- Monthly P&I
- —
- Monthly cashflow
- —
- DSCR
- —
- Eligible?
- —
Personal DTI + credit; lowest rate.
DSCR
20% down · 8.5% · 30yr
- Down + closing
- —
- Monthly P&I
- —
- Monthly cashflow
- —
- DSCR
- —
- Eligible?
- —
No personal income docs; deal must DSCR.
Hard money
10% down · 12.0% · 12mo
- Down + closing
- —
- Monthly P&I
- —
- Monthly cashflow
- —
- DSCR
- —
- Eligible?
- —
Short-term bridge; refi at stabilization.
Rent comps 23 comps
| Address | Beds | Baths | Sqft | Rent | $/sqft | DOM | Units | Dist |
|---|---|---|---|---|---|---|---|---|
| 502 Sunset Rd N Rotonda West, FL | 3.0 | 2.0 | 1636 | $2,100 | $1.28 | 21d | 1 | 0.18mi |
| 511 Sweetwater Dr Rotonda West, FL | 4.0 | 2.5 | 2160 | $2,200 | $1.02 | 21d | 1 | 0.31mi |
| 7344 Brookhaven Ter Englewood, FL | 3.0 | 2.0 | 1594 | $2,095 | $1.31 | 21d | 1 | 0.66mi |
| 285 Mark Twain Ln Rotonda West, FL | 3.0 | 2.0 | 1759 | $1,750 | $0.99 | 21d | 1 | 0.66mi |
| 22 Mariner Ln Rotonda West, FL | 3.0 | 2.0 | 2015 | $4,200 | $2.08 | 21d | 1 | 0.75mi |
| 8256 Shore Lake Dr Englewood, FL | 3.0 | 3.0 | 2201 | $2,500 | $1.14 | 21d | 1 | 0.77mi |
| 25 Fairway Rd Rotonda West, FL | 3.0 | 2.0 | 2068 | $2,375 | $1.15 | 21d | 1 | 0.78mi |
| 7160 Carlsbad Ter Englewood, FL | 3.0 | 2.0 | 2061 | $4,500 | $2.18 | 21d | 1 | 0.86mi |
| 9400 New Martinsville Ave Englewood, FL | 3.0 | 2.0 | 1879 | $3,300 | $1.76 | 21d | 1 | 0.95mi |
| 8363 Sago Ct Englewood, FL | 2.0 | 2.0 | 1360 | $1,950 | $1.43 | 21d | 1 | 0.97mi |
| 10123 Bay Ave Englewood, FL | 3.0 | 2.0 | 2010 | $2,150 | $1.07 | 21d | 1 | 1.04mi |
| 65 Fairway Rd Rotonda West, FL | 3.0 | 2.0 | 1865 | $2,700 | $1.45 | 21d | 1 | 1.08mi |
| 36 Bunker Cir Rotonda West, FL | 2.0 | 2.0 | 1533 | $3,999 | $2.61 | 21d | 1 | 1.11mi |
| 30 Pinehurst Pl Rotonda West, FL | 3.0 | 3.0 | 2461 | $3,900 | $1.58 | 21d | 1 | 1.18mi |
| 80 Mariner Ln Rotonda West, FL | 3.0 | 2.0 | 2052 | $4,800 | $2.34 | 21d | 1 | 1.19mi |
| 8535 Saint Kitts Cir Englewood, FL | 4.0 | 3.0 | 2267 | $2,675 | $1.18 | 21d | 1 | 1.24mi |
| 181 Bunker Rd Rotonda West, FL | 2.0 | 2.0 | 1355 | $4,600 | $3.39 | 21d | 1 | 1.27mi |
| 527 Rotonda Cir Rotonda West, FL | 3.0 | 2.0 | 1586 | $2,375 | $1.50 | 21d | 1 | 1.38mi |
| 42 Mark Twain Ln Rotonda West, FL | 3.0 | 2.5 | 1677 | $2,800 | $1.67 | 21d | 1 | 1.39mi |
| 8318 Waterscape Rd Unit NA Englewood, FL | 4.0 | 3.0 | 2032 | $2,425 | $1.19 | 21d | 1 | 1.41mi |
| 8318 Waterscape Rd Englewood, FL | 4.0 | 3.0 | 2027 | $2,475 | $1.22 | 21d | 1 | 1.41mi |
| 8644 Saint Kitts Cir Englewood, FL | 3.0 | 3.0 | 1849 | $2,095 | $1.13 | 21d | 1 | 1.46mi |
| 8756 Coco Bay Blvd Englewood, FL | 4.0 | 3.0 | 2027 | $2,600 | $1.28 | 21d | 1 | 1.50mi |
HOA detail
- Monthly dues
- $11 · $132/yr
Listing history 8 events
-
2026-05-05status Pending
-
2026-02-18$304,900 Active
-
2022-04-08soldstatus $265,000
-
2021-09-07soldstatus $530,000
-
2018-09-19soldstatus $12,500
-
2018-09-14soldstatus $70,000
-
2010-10-18soldstatus $43,600
-
2003-09-10soldstatus $65,000
ⓘ Source: listings_history table (triggers on properties + properties_extension) + one-shot
backfill from property_details.listing_events for pre-trigger history.
Climate risk First Street
- Flood 7/10 Severe FEMA zone X (shaded) · 74% chance over 30 yrs
- Wildfire 1/10 Low
- Heat 10/10 Extreme 7 d/yr ≥107°F today · 29 d/yr by 30 yrs out
- Wind 10/10 Extreme 99% chance of damaging wind over 30 yrs
- Air quality 2/10 Low 1 unhealthy d/yr today · 1 by 30 yrs out
Nearby sold comps map
Loading sold comps map…
Walkable amenities ~0.75 mi
Loading nearby amenities…
Taxation est. · year 1
- Rental income
- $32,442
- − Mortgage interest
- −$17,079
- − Property taxes
- −$4,574
- − Insurance
- −$2,322
- − Repairs & maintenance
- −$2,595
- − Management
- −$2,595
- − HOA
- −$132
- − Depreciation
- −$8,870
- Taxable loss
- −$5,725
- Est. tax savings @ 24.0%
- +$1,374
- After-tax cash flow
- $788/yr
For passive investors: Depreciation is non-cash, so a rental often shows a tax loss while cash-flowing — sheltering income. Rental losses are passive: they offset passive income freely, and up to $25,000/yr can offset ordinary (W-2) income if you actively participate and your MAGI is under $100k (phasing out to $0 by $150k); unused losses carry forward. On sale, claimed depreciation is recaptured at up to 25%, and gains may owe capital-gains tax (a 1031 exchange can defer both). Figures are a year-1 estimate at your 24.0% rate — not tax advice; consult a CPA.
Schools (NCES district)
- District
- Charlotte
- NCES district ID
- 1200240
- Math proficiency
- 54% ▼ -6.00%
- Reading proficiency
- 54% ▼ -1.00%
- Median HH income
- $44,864
- Composite
- 45.62/100
- National rank
- #2586
- State rank
- #22 of 73 in FL
Livability — Rotonda
- Score
- 67/100
- State rank
- #548
- US rank
- #10359
Category grades
Schools grade is shown separately in the Schools card above.
Census & demographics
- County
- Charlotte County · 196,994 people
- City population
- 10,490
- Metro
- Punta Gorda, FL
- Population (ZIP)
- 10,447
- Household income
- $80,091
- Rent vs Own
- Severe rent burden
- 91.0
Population outlook (Charlotte County) Hauer SSP2
- Today (2025)
- 198,646 people
- By 2030
- 210,507 · +6.0%
- By 2040
- 230,857 · +16.2%
- By 2050
- 247,148 · +24.4%
- By 2075
- 281,777 · +41.8%
- By 2100
- 293,609 · +47.8%
Race, ethnicity, and origin ACS 2023
- Neighborhood character
- Predominantly White (96%)
- Race & ethnicity
- White 96% Hispanic / Latino 2% Two or more races 2%
- Common ancestry
- Romanian 5% Lithuanian 4% Slovak 4%
- Foreign-born
- 8% · Canada, Vietnam
- Languages at home
- 93% English-only · Russian/Polish/Slavic 3% Spanish 2% German/W. Germanic 1%
Political lean MEDSL · Charlotte
- 2024 margin
- Solid R (+34.0) · D 32.7% · R 66.7%
- 2008→2024 swing
- -26.7pp toward R · 2008: -7.2pp · 2024: -34.0pp
- All cycles
- 2024: R+34.0 2020: R+26.6 2016: R+27.8 2012: R+14.3 2008: R+7.2
Not yet ingested
- Civics
- —
Market trends
- HPI YoY
- ▲ 1.25%
- Current HPI
- 311.3231
- Rent YoY
- ▼ -0.22%
- Metro
- Punta Gorda, FL
- State GDP YoY
- ▲ 3.28%
- F500 in state
- 36
Industry mix (Fortune 500 HQ in FL)
| Industry | F500 HQs | Revenue |
|---|---|---|
| Industrial Technology | 2 | $29B |
|
||
| Insurance | 2 | $17B |
|
||
| Retail | 1 | $60B |
|
||
| Technology Distribution | 1 | $58B |
|
||
| Homebuilding | 1 | $35B |
|
||
| Technology Manufacturing | 1 | $35B |
|
||
Price history
+369.1% since first listed8 events — show timeline
- 2026-05-05 Pending — Stellar MLS as Distributed by MLS Grid
- 2026-02-18 Listed $304,900 Stellar MLS as Distributed by MLS Grid
- 2022-04-08 Sold (Public Records) $265,000 Public Records
- 2021-09-07 Sold (Public Records) $530,000 Public Records
- 2018-09-19 Sold (Public Records) $12,500 Public Records
- 2018-09-14 Sold (Public Records) $70,000 Public Records
- 2010-10-18 Sold (Public Records) $43,600 Public Records
- 2003-09-10 Sold (Public Records) $65,000 Public Records
Property tax history
+9.0%/yrLatest (2025): $545 · +1.6% YoY. Source: county tax records.
Cash-flow waterfall
monthlySold comps — $/sqft
last 12 mo · ≤1 miLoading sold comps…