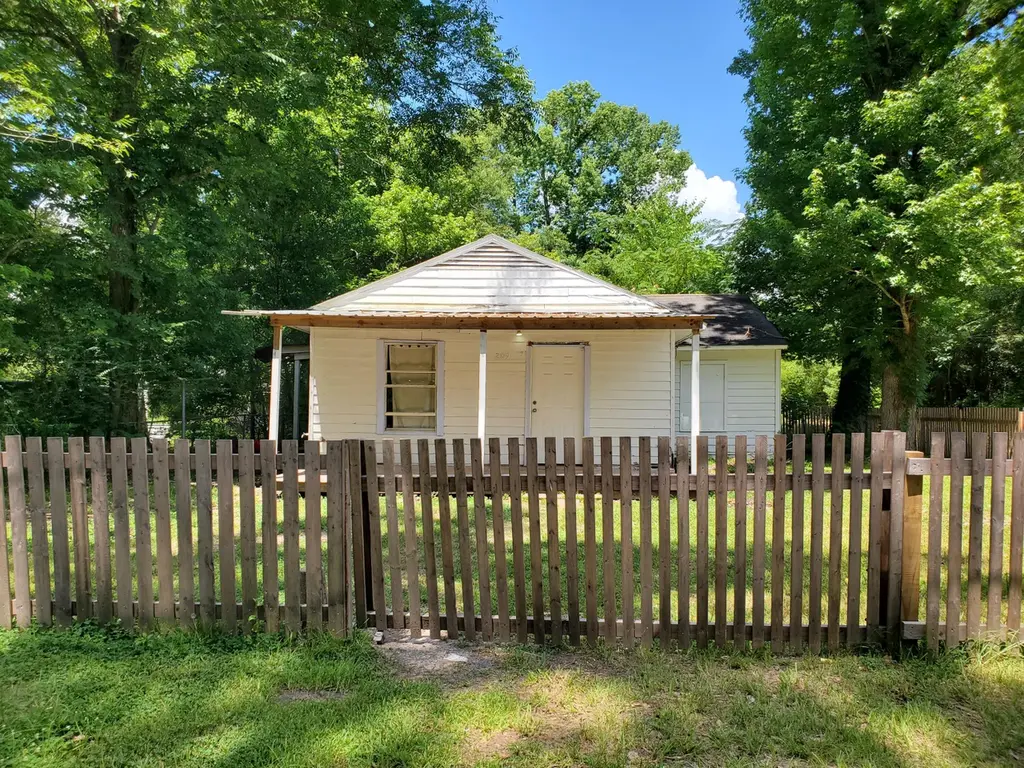
209 N Prairie St · Leesville, LA
Flood risk No data
- FEMA flood zone
- —
- Chance of flooding over 30 yrs
- —
- Est. flood insurance / yr
- —
Fire risk No data
- Est. fire insurance / yr
- —
Heat risk No data
- Hot days now (above threshold)
- —
- Hot days in 30 yrs
- —
Wind risk No data
- Chance of severe wind over 30 yrs
- —
Air-quality risk No data
- Unhealthy air days now
- —
- Unhealthy air days in 30 yrs
- —
Risk factors via First Street. Map © Google.
Why this score? — see what drove the B grade
The composite is a weighted blend of 9 inputs, each scored 0–100. Each bar is that input's sub-score; the figure is the points it added to the 100-point composite (weight × sub-score).
- Cash flow +30.0/30.0
- 1% rule +10.0/10.0
- DSCR +10.0/10.0
- ARV discount +7.5/15.0
- Rent growth +4.9/5.0
- Livability +3.7/5.0
- Schools +3.6/10.0
- Condition / age +2.5/5.0
- Appreciation +0.0/10.0
$30,000
🖨 Deal sheet (PDF) 📄 Offer letter ✓ Due diligence
Listing remarks MLS
3 bedroom, 1 bathroom house centrally located in Leesville. Call for more details!
Key facts
- 4,356 sq ft lot
- Listed 4 days
Property features AI
Finance
- Other: Located in a residentially zoned area; Directions: From Signature Real Estate in DeRidder, go north on Hwy 171, turn left onto Texas St/LA 8, then right onto Prairie St; home is on the corner.
Exterior
- Utilities: Public water; Public sewer
- Home design: Single-family residence; One story
- Exterior features: Corner lot; Wooden fence
Interior
- Bathrooms: 1 full bathroom
- Interior features: Total of 4 rooms
Neighborhood map
What this means for you Summary
Snapshot
- This is a 2-bed/1.0-bath single-family listed at $30k.
Deal economics
- At list price, monthly cash flow is $605 ($7k/yr) — positive.
- The deal already cash-flows at list — no discount required.
- Meets the 1% rule at list price ($1k rent vs $30k).
- Cap rate 30.5% vs local median 7.3% in Leesville — top-decile yield for the area; either an underpriced asset or a hidden risk that comps aren't pricing in. Stress-test before assuming the spread holds.
Location & tenants
- Location reads 73/100 on livability (#30 in LA) — a middle-class / working-renter tenant base. Strengths: cost of living A+, health & safety A+, housing A; Watch: crime F, amenities F, commute F.
- Vernon Parish (rural): math 35% / reading 51% proficiency, ranked #18 of 98 in LA (top 18%) — families likely to look elsewhere, expect single-tenant / working-renter base with shorter leases.
- Market conditions: Rents rising fast (+9.6%/yr); 210 active listings in the ZIP; 7 comparable units currently listed for rent nearby; rentals lingering (median 45d on market — plan ~5-8 weeks vacancy on turnover, expect pricing pressure); 100% of comp listings sitting > 30 days — soft ceiling on asking rent; 26 units permitted in Vernon Parish in 2024 (0 in 5+ unit buildings).
Forward outlook
- Local home prices are declining (-3.0%/yr); year-one equity from $207 of loan paydown is wiped out by about $900 of value loss. Plan a longer hold.
- Vernon County population projected at -25% by 2050 — secular population decline; favor cash flow + early exit over multi-decade hold.
- At projected returns (-3.0% appreciation + 8.0% rent growth), your $8k cash investment doubles in ~2 years — after that, you're playing with house money.
Negotiation context
- Only 5 days on market — expect competitive offers; lowballing is unlikely to land.
- 3 sale attempts since 3y ago with the ask held roughly flat each time — persistent listings suggest the price (not the market) is what's stuck; bring a comps-based counter.
- Current owner paid $4k; list at $30k implies a 757% gain — meaningful room to come down on a strong offer.
Questions for the listing agent
- Is there a deadline driving the sale (1031 exchange, divorce, estate, relocation)? That informs how much negotiation room exists.
- Schools are B-rated — typically a magnet for longer-tenancy family renters. What's the average tenant stay here, and is there a school-zone premium baked into asking?
- Crime grade is F in this area — have there been break-ins, vandalism, or insurance claims at this property in the last 3 years? What carrier currently insures it and at what premium?
- What's the average days-on-market for RENTAL listings here right now (not sales)? A rising rental-DOM trend means longer vacancies and softer asking-rent achievability than the comps imply.
- What's the recent tenant-quality profile in this submarket — average credit score on applications, eviction rate, late-payment / NSF rate, and stable-employment percentage? A property-management company in the area should have these aggregated.
- How much new for-sale + rental construction is in the pipeline within 1–3 miles? Heavy new supply typically softens prices + rents 12–24 months out; constrained supply supports both.
Investment metrics
- 1% rule
- 3.36% ✓
- Cap rate
- 30.47%
- Cash-on-cash
- 86.36%
- DSCR
- 4.84
- GRM
- 2.5
CMA / ARV
- ARV (on-the-fly)
- $119,808
- Comps found
- 4
Show comp detail 4 sales within ~0.75 mi
| Address | Dist | Beds/Ba | Sqft | Sold | Price | $/sf | Match |
|---|---|---|---|---|---|---|---|
| 800 Marvin Ave | 0.54mi | 3/2.0 (+1) | 1,100 (+7%) | 6mo | $125,000 | $114 | 48 |
| 105 Nelda St | 0.50mi | 3/1.5 (+1) | 1,135 (+11%) | 10mo | $135,500 | $119 | 44 |
| 2105 Miriam St | 0.71mi | 3/1.0 (+1) | 1,000 (-2%) | 23mo | $117,000 | $117 | 38 |
| 1101 Pinckney Ave | 0.61mi | 2/1.0 | 895 (-13%) | 21mo | $85,000 | $95 | 33 |
Match score weights: distance 35% · size 25% · config 20% · recency 20%. Top-matched comps best support the ARV.
Projected returns pro-forma
-3.0% appreciation · 8.0% rent growth · sell at horizon
- IRR
- 92.3%
- Equity multiple
- 5.64×
- Total profit
- $38,966
- Equity at exit
- $4,473
- IRR
- 96.3%
- Equity multiple
- 13.83×
- Total profit
- $107,741
- Equity at exit
- $2,594
Cash invested: $8,400 (down + closing). Projections, not guarantees.
Landlord ↔ Tenant lean methodology
- Overall (STATE)
- 90 Strongly Landlord-Friendly
- State Louisiana
- 90 Strongly Landlord-Friendly · R+12
- County
- — inherits STATE
- City
- — inherits STATE
ZIP-level market 71446
- Home prices YoY
- -32.1%
- Rents YoY
- 9.6%
- Active inventory
- 210
- Price-to-rent
- 2.5×
Monthly cashflow live
- Estimated rent
- $1,007 high interval (Pro) →
- Mortgage (P&I)
- −$157
- Tax from tax record
- −$21 /mo · $250/yr
- Insurance
- −$12
- HOA
- −$0
- Vacancy / Maint / Mgmt
- −$211
- Net cashflow
- $605
Break-even live
Sensitivity live
| Price | -10% $622 | -5% $613 | +0% $605 | +5% $596 | +10% $588 |
|---|---|---|---|---|---|
| Rent | -10% $525 | -5% $565 | +0% $605 | +5% $644 | +10% $684 |
| Rate | -1.0pp $620 | -0.5pp $612 | base $605 | +0.5pp $597 | +1.0pp $589 |
UW: 25.0% down · 7.5% · 30yr · 1.5% tax · 5.0% vac · 8.0% maint · 8.0% mgmt
Financing live
Cash to close
- Down payment
- $7,500
- Closing costs
- $900
- Reserves months
- —
- Total cash needed
- —
Loan-product check · same deal, 3 products live
Conventional
25% down · 7.5% · 30yr
- Down + closing
- —
- Monthly P&I
- —
- Monthly cashflow
- —
- DSCR
- —
- Eligible?
- —
Personal DTI + credit; lowest rate.
DSCR
20% down · 8.5% · 30yr
- Down + closing
- —
- Monthly P&I
- —
- Monthly cashflow
- —
- DSCR
- —
- Eligible?
- —
No personal income docs; deal must DSCR.
Hard money
10% down · 12.0% · 12mo
- Down + closing
- —
- Monthly P&I
- —
- Monthly cashflow
- —
- DSCR
- —
- Eligible?
- —
Short-term bridge; refi at stabilization.
Rent comps 7 comps
| Address | Beds | Baths | Sqft | Rent | $/sqft | DOM | Units | Dist |
|---|---|---|---|---|---|---|---|---|
| 305 W Maggie St Apt 3 Leesville, LA | 2.0 | 1.5 | 840 | $600 | $0.71 | 44d | 1 | 0.57mi |
| 306 W Harriet St Apt 6 Leesville, LA | 2.0 | 1.5 | 840 | $650 | $0.77 | 44d | 1 | 0.58mi |
| 1403 Aaron St Leesville, LA | 3.0 | 1.0 | 926 | $1,050 | $1.13 | 44d | 1 | 0.89mi |
| 10 Katherine Loop Leesville, LA | 3.0 | 2.0 | 1106 | $1,100 | $0.99 | 44d | 1 | 0.90mi |
| 207 Belview Rd Leesville, LA | 3.0 | 1.5 | 1300 | $1,200 | $0.92 | 44d | 1 | 1.08mi |
| 347 Watson Rd Unit 20 Leesville, LA | 3.0 | 1.0 | 1160 | $595 | $0.51 | 44d | 1 | 1.47mi |
| 347 Watson Rd Unit 12 Leesville, LA | 2.0 | 1.0 | 1160 | $575 | $0.50 | 44d | 1 | 1.47mi |
Listing history 6 events
-
2026-06-19days on market $30,000 Active 5 DOM
-
2026-06-18days on market $30,000 Active 4 DOM
-
2026-06-17days on market $30,000 Active 3 DOM
-
2026-06-16days on market $30,000 Active 2 DOM
-
2026-06-15remarks 200-char remark
-
2026-06-15$30,000 Active 1 DOM
ⓘ Source: listings_history table (triggers on properties + properties_extension) + one-shot
backfill from property_details.listing_events for pre-trigger history.
Tax reassessment forecast LA · Resets to sale price
- Current annual tax
- $250 · $21/mo
- Projected year-2 tax
- $250 · $21/mo
- Expected delta
- $0/yr ($0/mo · -0.0%)
ⓘ Screening estimate from a state-policy table — verify with the county assessor before closing.
Nearby sold comps map
Loading sold comps map…
Walkable amenities ~0.75 mi
Loading nearby amenities…
Taxation est. · year 1
- Rental income
- $12,079
- − Mortgage interest
- −$1,680
- − Property taxes
- −$250
- − Insurance
- −$150
- − Repairs & maintenance
- −$966
- − Management
- −$966
- − Depreciation
- −$873
- Taxable income
- $7,193
- Est. tax owed @ 24.0%
- −$1,726
- After-tax cash flow
- $5,528/yr
For passive investors: Depreciation is non-cash, so a rental often shows a tax loss while cash-flowing — sheltering income. Rental losses are passive: they offset passive income freely, and up to $25,000/yr can offset ordinary (W-2) income if you actively participate and your MAGI is under $100k (phasing out to $0 by $150k); unused losses carry forward. On sale, claimed depreciation is recaptured at up to 25%, and gains may owe capital-gains tax (a 1031 exchange can defer both). Figures are a year-1 estimate at your 24.0% rate — not tax advice; consult a CPA.
Schools (NCES district)
- District
- Vernon Parish
- NCES district ID
- 2201830
- Math proficiency
- 35% ▼ -42.00%
- Reading proficiency
- 51% ▼ -32.00%
- Median HH income
- $44,822
- Composite
- 36.42/100
- National rank
- #4674
- State rank
- #18 of 98 in LA
Livability — Leesville
- Score
- 73/100
- State rank
- #30
- US rank
- #5046
Category grades
Schools grade is shown separately in the Schools card above.
Census & demographics
- Census place
- Leesville, LA
- County
- Vernon Parish · 21,275 people
- City population
- 21,275
- Metro
- Fort Polk South, LA
- Population (ZIP)
- 21,275
- Household income
- $55,925
- Rent vs Own
- Severe rent burden
- 659.0
Population outlook (Vernon County) Hauer SSP2
- Today (2025)
- 45,401 people
- By 2030
- 43,015 · -5.3%
- By 2040
- 38,171 · -15.9%
- By 2050
- 34,087 · -24.9%
- By 2075
- 28,267 · -37.7%
- By 2100
- 25,486 · -43.9%
Race, ethnicity, and origin ACS 2023
- Neighborhood character
- Predominantly White (72%)
- Race & ethnicity
- White 72% Black 16% Hispanic / Latino 6% Two or more races 5% Asian 2% Native American 1%
- Hispanic origin (detail)
- Mexican 3% Puerto Rican 1%
- Common ancestry
- Lithuanian 3% Slovak 1% Romanian 1%
- Foreign-born
- 3% · Canada, South Korea, Vietnam
- Languages at home
- 94% English-only · Spanish 3% French/Haitian/Cajun 1%
Political lean MEDSL · Vernon
- 2024 margin
- Solid R (+67.9) · D 15.6% · R 83.4% · Other 1.0%
- 2008→2024 swing
- -14.5pp toward R · 2008: -53.4pp · 2024: -67.9pp
- All cycles
- 2024: R+67.9 2020: R+64.9 2016: R+65.0 2012: R+57.5 2008: R+53.4
Not yet ingested
- Civics
- —
Market trends
- HPI YoY
- ▼ -61.06%
- Current HPI
- 128.8849
- Rent YoY
- ▲ 9.60%
- Metro
- Fort Polk South, LA
- State GDP YoY
- ▲ 3.29%
- F500 in state
- 10
Industry mix (Fortune 500 HQ in LA)
| Industry | F500 HQs | Revenue |
|---|---|---|
| Telecommunications | 2 | $23B |
|
||
| Utilities | 1 | $12B |
|
||
| Wholesale / Distribution | 1 | $5B |
|
||
| Advertising | 1 | $2B |
|
||
Price history
+757.1% since first listed7 events — show timeline
- 2026-06-14 Listed $30,000 GFPAR
- 2023-09-22 Sold (MLS) — GFPAR
- 2023-08-19 Relisted — GFPAR
- 2023-08-12 Delisted — GFPAR
- 2023-06-07 Price Changed $50,000 GFPAR
- 2023-05-09 Listed $65,000 GFPAR
- 2008-06-03 Sold (Public Records) $3,500 Public Records
Property tax history
+9.1%/yrLatest (2025): $250 · -0.8% YoY. Source: county tax records.
Cash-flow waterfall
monthlySold comps — $/sqft
last 12 mo · ≤1 miLoading sold comps…