 Multi-family
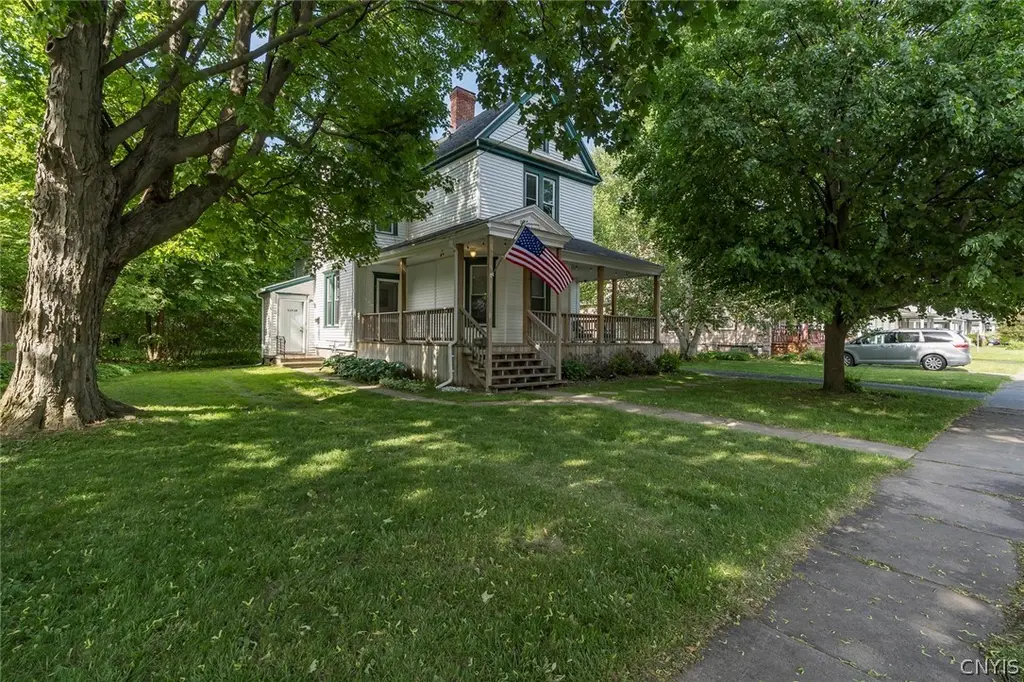
117 Bowers Ave · Watertown, NY
Flood risk 3/10 · Minor
- FEMA flood zone
- X
- Chance of flooding over 30 yrs
- 0.2%
- Est. flood insurance / yr
- $473 – $860
Fire risk 1/10 · Minimal
- Est. fire insurance / yr
- $691 – $1,283
Heat risk 2/10 · Minimal
- Hot days now (above 91°F)
- 7 days/yr
- Hot days in 30 yrs
- 16 days/yr
Wind risk 1/10 · Minimal
- Chance of severe wind over 30 yrs
- 0.0%
Air-quality risk 2/10 · Minimal
- Unhealthy air days now
- 1 days/yr
- Unhealthy air days in 30 yrs
- 1 days/yr
Risk factors via First Street. Map © Google.
Why this score? — see what drove the C+ grade
The composite is a weighted blend of 9 inputs, each scored 0–100. Each bar is that input's sub-score; the figure is the points it added to the 100-point composite (weight × sub-score).
- Cash flow +25.2/30.0
- DSCR +8.3/10.0
- ARV discount +7.5/15.0
- 1% rule +5.7/10.0
- Rent growth +5.0/5.0
- Schools +3.7/10.0
- Livability +3.4/5.0
- Condition / age +2.5/5.0
- Appreciation +0.0/10.0
$239,900
🖨 Deal sheet 📄 Offer letter ✓ Due diligence
Multi-family units
County records classify this as Multi-Family (2-4 Unit). Listing-text estimate: 1 unit. estimate disagrees with records
Listing remarks MLS
Amazing Investment Opportunity! This 2-unit duplex is steps away from the Samaritan Medical Center. The property has a strong rental history and features 2BR/1BA downstairs, 2BR/1BA upstairs, original woodwork, detached garage, ample parking and private backyard. Live in one appt and rent the other to pay your mortgage. Ideal location and meticulously cared for. Call now for details & showing. 24 hours due to tenant upstairs.
Key facts
- Formal dining room
- Prime location
- 0.23 acre lot
Tags
Property features AI
Finance
- Financial info: Property configured as two units with separate gas and electric meters; Unit rents reported: one unit at $1,100 and one unit at $1,400; Owner pays water; water is included in rent; Operating expenses include snow removal and water/sewer
Exterior
- Parking: Garage (1 car); Paved parking; At least two parking spaces
- Utilities: Public water connected; Sewer connected
- Home design: Two-story building; Existing/resale property
- Construction: Vinyl siding; Built previously (existing)
- Exterior features: Rectangular residential lot; 67 x 150 lot dimensions; City street frontage
Interior
- Kitchen: Eat-in kitchen (one unit); Kitchen included in both units
- Bedrooms: Two 2-bedroom units
- Flooring: Carpet; Hardwood; Tile; Varied flooring
- Bathrooms: Each unit has one full bathroom (2 full bathrooms total)
- Heating & cooling: Gas forced-air heating; Has heating
- Interior features: Full basement
- Laundry & utility: Laundry in unit (one unit)
Neighborhood map
What this means for you Summary
Snapshot
- This is a 4-bed/2.0-bath multifamily listed at $240k.
Deal economics
- At list price, monthly cash flow is $536 ($6k/yr) — positive.
- The deal already cash-flows at list — no discount required.
- Meets the 1% rule at list price ($3k rent vs $240k).
- Cap rate 9.0% vs local median 6.2% in Watertown — top-decile yield for the area; either an underpriced asset or a hidden risk that comps aren't pricing in. Stress-test before assuming the spread holds.
Location & tenants
- Location reads 68/100 on livability (#540 in NY) — a middle-class / working-renter tenant base. Strengths: health & safety A+, cost of living A-, housing A-; Watch: amenities C-, schools D, crime F.
- Watertown City School District (urban): math 34% / reading 54% proficiency, ranked #481 of 590 in NY (top 82%) — families likely to look elsewhere, expect single-tenant / working-renter base with shorter leases.
- Market conditions: Rents rising fast (+10.0%/yr); 223 active listings in the ZIP; 9 comparable units currently listed for rent nearby; rentals lingering (median 44d on market — plan ~5-8 weeks vacancy on turnover, expect pricing pressure); 100% of comp listings sitting > 30 days — soft ceiling on asking rent; 196 units permitted in Jefferson County in 2024 (0 in 5+ unit buildings).
- At $2,568/mo this rent would consume 52% of the median local household income ($59k/yr) (locally 1634% of renters already pay >50% of income on rent) — very limited rent-growth headroom before tenants either downsize or default.
Forward outlook
- Local home prices are declining (-3.0%/yr); year-one equity from $2k of loan paydown is wiped out by about $7k of value loss. Plan a longer hold.
- Jefferson County population projected at -12% by 2050 — secular population decline; favor cash flow + early exit over multi-decade hold.
- At projected returns (-3.0% appreciation + 8.0% rent growth), your $67k cash investment doubles in ~8 years — after that, you're playing with house money.
Negotiation context
- Only 2 days on market — expect competitive offers; lowballing is unlikely to land.
- 4 sale attempts since 14y ago with the ask held roughly flat each time — persistent listings suggest the price (not the market) is what's stuck; bring a comps-based counter.
- Current owner paid $165k; 45% above their basis — modest negotiation headroom, anchor on the comps not their cost.
Risks & watch-outs
- Watch-outs: built in 1890 — expect roof / HVAC / electrical / plumbing capex.
Questions for the listing agent
- Built in 1890 — when were the roof, HVAC, electrical panel, plumbing, and water heater last replaced?
- Is there a deadline driving the sale (1031 exchange, divorce, estate, relocation)? That informs how much negotiation room exists.
- Schools are D-rated, which usually means shorter tenancies and higher turnover. Who's the typical renter profile here, and what's been the actual vacancy rate?
- Crime grade is F in this area — have there been break-ins, vandalism, or insurance claims at this property in the last 3 years? What carrier currently insures it and at what premium?
- What's the average days-on-market for RENTAL listings here right now (not sales)? A rising rental-DOM trend means longer vacancies and softer asking-rent achievability than the comps imply.
- What's the recent tenant-quality profile in this submarket — average credit score on applications, eviction rate, late-payment / NSF rate, and stable-employment percentage? A property-management company in the area should have these aggregated.
- How much new apartment / multifamily construction is in the pipeline within 1–3 miles? Heavy new supply (>2% of stock underway) typically softens rents 12–24 months out; light construction supports rent growth.
Investment metrics
- 1% rule
- 1.07% ✓
- Cap rate
- 8.97%
- Cash-on-cash
- 9.58%
- DSCR
- 1.43
- GRM
- 7.8
CMA / ARV
- ARV (on-the-fly)
- $150,075
- Comps found
- 7
Show comp detail 7 sales within ~0.75 mi
| Address | Dist | Beds/Ba | Sqft | Sold | Price | $/sf | Match |
|---|---|---|---|---|---|---|---|
| 713 Myrtle Ave | 0.22mi | 4/2.0 | 2,016 (-7%) | 8mo | $140,000 | $69 | 71 |
| 512 Hamlin St | 0.41mi | 5/2.5 (+1) | 2,220 (+2%) | 3mo | $236,000 | $106 | 68 |
| 159 Winslow St | 0.28mi | 4/3.0 | 2,073 (-5%) | 21mo | $98,000 | $47 | 57 |
| 502 Academy St | 0.56mi | 4/2.5 | 2,112 (-3%) | 16mo | $180,000 | $85 | 54 |
| 301 Keyes Ave | 0.40mi | 4/2.0 | 2,450 (+13%) | 8mo | $30,000 | $12 | 53 |
| 636 Gotham St | 0.25mi | 3/2.0 (-1) | 1,979 (-9%) | 18mo | $152,000 | $77 | 53 |
| 712 Cadwell St | 0.47mi | 5/2.0 (+1) | 2,108 (-3%) | 22mo | $82,500 | $39 | 50 |
Match score weights: distance 35% · size 25% · config 20% · recency 20%. Top-matched comps best support the ARV.
Projected returns pro-forma
-3.0% appreciation · 8.0% rent growth · sell at horizon
- IRR
- 3.2%
- Equity multiple
- 1.13×
- Total profit
- $8,784
- Equity at exit
- $35,770
- IRR
- 16.8%
- Equity multiple
- 2.68×
- Total profit
- $113,135
- Equity at exit
- $20,742
Cash invested: $67,172 (down + closing). Projections, not guarantees.
Landlord ↔ Tenant lean methodology
- Overall (STATE)
- 15 Strongly Tenant-Friendly
- State New York
- 15 Strongly Tenant-Friendly · D+10
- County
- — inherits STATE
- City
- — inherits STATE
ZIP-level market 13601
- Home prices YoY
- -5.6%
- Rents YoY
- 10.0%
- Active inventory
- 223
- Price-to-rent
- 15.6×
Monthly cashflow live
- Estimated rent
- $2,568 high interval (Pro) →
- Mortgage (P&I)
- −$1,258
- Tax from tax record
- −$135 /mo · $1,614/yr
- Insurance
- −$100
- HOA
- −$0
- Vacancy / Maint / Mgmt
- −$539
- Net cashflow
- $536
Break-even live
2-unit breakdown (identical units grouped — click to expand)
| Units | Beds | Baths | Est. rent |
|---|---|---|---|
| 2× units | 2 | 1 | $2,568 |
| #1 | 2 | 1 | $1,284 |
| #2 | 2 | 1 | $1,284 |
| Total (2 units) | $2,568 | ||
UW: 25.0% down · 7.5% · 30yr · 1.5% tax · 5.0% vac · 8.0% maint · 8.0% mgmt
Financing live
Cash to close
- Down payment
- $59,975
- Closing costs
- $7,197
- Reserves months
- —
- Total cash needed
- —
Loan-product check · same deal, 3 products live
Conventional
25% down · 7.5% · 30yr
- Down + closing
- —
- Monthly P&I
- —
- Monthly cashflow
- —
- DSCR
- —
- Eligible?
- —
Personal DTI + credit; lowest rate.
DSCR
20% down · 8.5% · 30yr
- Down + closing
- —
- Monthly P&I
- —
- Monthly cashflow
- —
- DSCR
- —
- Eligible?
- —
No personal income docs; deal must DSCR.
Hard money
10% down · 12.0% · 12mo
- Down + closing
- —
- Monthly P&I
- —
- Monthly cashflow
- —
- DSCR
- —
- Eligible?
- —
Short-term bridge; refi at stabilization.
Rent comps 9 comps
| Address | Beds | Baths | Sqft | Rent | $/sqft | DOM | Units | Dist |
|---|---|---|---|---|---|---|---|---|
| 128 Park Ave Watertown, NY | 3.0 | 2.0 | 2300 | $2,400 | $1.04 | 43d | 1 | 0.05mi |
| 328 Clay St Unit 3 Watertown, NY | 3.0 | 2.0 | 1500 | $1,650 | $1.10 | 43d | 1 | 0.48mi |
| 417 Franklin St Watertown, NY | 3.0 | 2.5 | 3000 | $1,750 | $0.58 | 43d | 1 | 0.53mi |
| 621 Academy St Watertown, NY | 3.0 | 2.0 | 1652 | $1,600 | $0.97 | 43d | 1 | 0.64mi |
| 123 State Pl Watertown, NY | 3.0 | 1.5 | 1500 | $1,750 | $1.17 | 43d | 1 | 0.82mi |
| 156 N Meadow St Watertown, NY | 4.0 | 1.0 | 2535 | $1,500 | $0.59 | 43d | 1 | 0.98mi |
| 377 W Main St Unit 1 Watertown, NY | 3.0 | 1.0 | 1991 | $1,350 | $0.68 | 43d | 1 | 1.09mi |
| 702 Leray St Watertown, NY | 3.0 | 1.0 | 2700 | $1,300 | $0.48 | 43d | 1 | 1.40mi |
| 256 Michigan Ave Watertown, NY | 2.0–4.0 | 1.0–2.5 | 1435 | $1,626 | $1.13 | 43d | 9 | 1.48mi |
Listing history 11 events
-
2026-06-19days on market $239,900 Active 2 DOM
-
2026-06-18days on market $239,900 Active 1 DOM
-
2026-06-17days on market $239,900 Active 12 DOM
-
2026-06-16days on market $239,900 Active 11 DOM
-
2026-06-15days on market $239,900 Active 10 DOM
-
2026-06-14days on market $239,900 Active 8 DOM
-
2026-06-12days on market $239,900 Active 7 DOM
-
2026-06-09days on market $239,900 Active 4 DOM
-
2026-06-08days on market $239,900 Active 3 DOM
-
2026-06-07remarks 693-char remark
-
2026-06-07$239,900 Active 2 DOM
ⓘ Source: listings_history table (triggers on properties + properties_extension) + one-shot
backfill from property_details.listing_events for pre-trigger history.
Tax reassessment forecast NY · Partial reset (capped growth)
- Current annual tax
- $1,614 · $135/mo
- Projected year-2 tax
- $2,834 · $236/mo
- Expected delta
- +$1,220/yr (+$102/mo · 75.6%)
ⓘ Screening estimate from a state-policy table — verify with the county assessor before closing.
Climate risk First Street
- Flood 3/10 Moderate FEMA zone X · 20% chance over 30 yrs
- Wildfire 1/10 Low
- Heat 2/10 Low 7 d/yr ≥91°F today · 16 d/yr by 30 yrs out
- Wind 1/10 Low 0% chance of damaging wind over 30 yrs
- Air quality 2/10 Low 1 unhealthy d/yr today · 1 by 30 yrs out
Nearby sold comps map
Loading sold comps map…
Walkable amenities ~0.75 mi
Loading nearby amenities…
Taxation est. · year 1
- Rental income
- $30,816
- − Mortgage interest
- −$13,438
- − Property taxes
- −$1,614
- − Insurance
- −$1,200
- − Repairs & maintenance
- −$2,465
- − Management
- −$2,465
- − Depreciation
- −$6,979
- Taxable income
- $2,655
- Est. tax owed @ 24.0%
- −$637
- After-tax cash flow
- $5,797/yr
For passive investors: Depreciation is non-cash, so a rental often shows a tax loss while cash-flowing — sheltering income. Rental losses are passive: they offset passive income freely, and up to $25,000/yr can offset ordinary (W-2) income if you actively participate and your MAGI is under $100k (phasing out to $0 by $150k); unused losses carry forward. On sale, claimed depreciation is recaptured at up to 25%, and gains may owe capital-gains tax (a 1031 exchange can defer both). Figures are a year-1 estimate at your 24.0% rate — not tax advice; consult a CPA.
Schools (NCES district)
- District
- Watertown City School District
- NCES district ID
- 3630120
- Math proficiency
- 34% ▼ -10.00%
- Reading proficiency
- 54% ▲ 12.00%
- Median HH income
- $40,919
- Composite
- 36.86/100
- National rank
- #4551
- State rank
- #481 of 590 in NY
Livability — Watertown
- Score
- 68/100
- State rank
- #540
- US rank
- #9700
Category grades
Schools grade is shown separately in the Schools card above.
Census & demographics
- Census place
- Watertown, NY
- County
- Jefferson County · 47,417 people
- City population
- 36,839
- Metro
- Watertown-Fort Drum, NY
- Population (ZIP)
- 36,839
- Household income
- $58,791
- Rent vs Own
- Severe rent burden
- 1634.0
Population outlook (Jefferson County) Hauer SSP2
- Today (2025)
- 111,748 people
- By 2030
- 109,370 · -2.1%
- By 2040
- 103,828 · -7.1%
- By 2050
- 98,523 · -11.8%
- By 2075
- 91,422 · -18.2%
- By 2100
- 78,214 · -30.0%
Race, ethnicity, and origin ACS 2023
- Neighborhood character
- Predominantly White (82%)
- Race & ethnicity
- White 82% Two or more races 7% Hispanic / Latino 6% Black 4% Asian 2%
- Hispanic origin (detail)
- Mexican 2% Puerto Rican 2%
- Common ancestry
- Lithuanian 7% Romanian 3% Slovak 2%
- Foreign-born
- 4% · Canada
- Languages at home
- 94% English-only · Spanish 3% Other Indo-European 1% German/W. Germanic 1%
Political lean MEDSL · Jefferson
- 2024 margin
- Strong R (+23.6) · D 38.2% · R 61.8%
- 2008→2024 swing
- -18.3pp toward R · 2008: -5.3pp · 2024: -23.6pp
- All cycles
- 2024: R+23.6 2020: R+19.0 2016: R+22.4 2012: R+2.9 2008: R+5.3
Not yet ingested
- Civics
- —
Market trends
- HPI YoY
- ▼ -18.86%
- Current HPI
- 316.636
- Rent YoY
- ▲ 9.96%
- Metro
- Watertown-Fort Drum, NY
- State GDP YoY
- ▲ 2.60%
- F500 in state
- 92
Industry mix (Fortune 500 HQ in NY)
| Industry | F500 HQs | Revenue |
|---|---|---|
| Financial Services | 10 | $950B |
|
||
| Consumer Goods | 9 | $162B |
|
||
| Insurance | 4 | $225B |
|
||
| Telecommunications | 2 | $144B |
|
||
| Pharmaceuticals | 2 | $112B |
|
||
| Media / Entertainment | 2 | $69B |
|
||
Price history
+369.5% since first listed12 events — show timeline
- 2026-06-05 Listed $239,900 CNYIS
- 2023-05-19 Sold (Public Records) $165,000 Public Records
- 2023-05-18 Sold (MLS) $165,000 CNYIS
- 2023-03-27 Contingent — CNYIS
- 2023-03-23 Listed $174,000 CNYIS
- 2019-03-13 Listing Removed — CNYIS
- 2018-10-31 Listed $144,900 CNYIS
- 2012-12-05 Sold (Public Records) $114,000 Public Records
- 2012-12-05 Sold (MLS) $114,000 CNYIS
- 2012-04-30 Listed $119,900 CNYIS
- 2006-12-15 Sold (Public Records) $120,000 Public Records
- 2002-12-23 Sold (Public Records) $51,100 Public Records
Property tax history
+18.7%/yrLatest (2025): $1,614 · +3.9% YoY. Source: county tax records.
Cash-flow waterfall
monthlySold comps — $/sqft
last 12 mo · ≤1 miLoading sold comps…