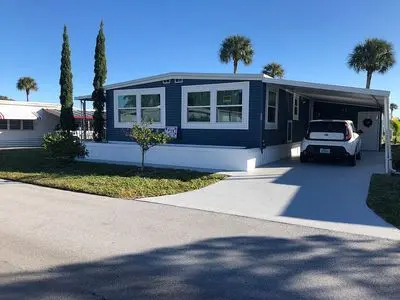
2549 SE Penny Ln · Stuart, FL
Flood risk 4/10 · Minor
- FEMA flood zone
- X (unshaded)
- Chance of flooding over 30 yrs
- 0.23%
- Est. flood insurance / yr
- $507 – $1,088
Fire risk 1/10 · Minimal
- Est. fire insurance / yr
- $947 – $1,759
Heat risk 10/10 · Severe
- Hot days now (above 106°F)
- 7 days/yr
- Hot days in 30 yrs
- 24 days/yr
Wind risk 10/10 · Severe
- Chance of severe wind over 30 yrs
- 99.0%
Air-quality risk 2/10 · Minimal
- Unhealthy air days now
- 1 days/yr
- Unhealthy air days in 30 yrs
- 1 days/yr
Risk factors via First Street. Map © Google.
Why this score? — see what drove the B grade
The composite is a weighted blend of 9 inputs, each scored 0–100. Each bar is that input's sub-score; the figure is the points it added to the 100-point composite (weight × sub-score).
- Cash flow +30.0/30.0
- 1% rule +10.0/10.0
- DSCR +10.0/10.0
- ARV discount +7.5/15.0
- Schools +4.5/10.0
- Livability +4.2/5.0
- Condition / age +2.5/5.0
- Rent growth +2.3/5.0
- Appreciation +0.0/10.0
$154,000
🖨 Deal sheet (PDF) 📄 Offer letter ✓ Due diligence
Listing remarks MLS
Prepare to fall in love with this recently renovated 3/2 mobile home. It comes with all the new features of a brand new mobile home without the high cost. It boasts of keyless entry doors, new roof, hurricane impact windows, all new electrical wiring and plumbing. And you will love the new kitchen cabinets, quartz countertops, cast iron Koehler sink with touchless faucet and stainless steel appliances. This home actually comes with a man cave, laundry room and a large outdoor patio. Leisure Village is a great community to live in whether your are a full time resident or just come for the winter.
Key facts
- New plumbing
- New electric wiring
- New ceiling fans
Tags
Neighborhood map
What this means for you Summary
Snapshot
- This is a 2-bed/2.0-bath condo listed at $154k.
Deal economics
- At list price, monthly cash flow is $775 ($9k/yr) — positive.
- The deal already cash-flows at list — no discount required.
- Meets the 1% rule at list price ($2k rent vs $154k).
- Recommended offer: $152k (1.5% below list) — sets the bar for market timing.
- Cap rate 12.3% vs local median 3.5% in Stuart — top-decile yield for the area; either an underpriced asset or a hidden risk that comps aren't pricing in. Stress-test before assuming the spread holds.
Location & tenants
- Location reads 84/100 on livability (#39 in FL, #790 nationally) — a professional / high-income tenant draw. Strengths: commute A+, housing A+, health & safety A+; Watch: crime C-, employment C-, amenities D.
- Martin (suburban): math 52% / reading 53% proficiency, ranked #24 of 73 in FL (top 33%) — acceptable for families but not a draw, mixed tenant base, ~2y average lease.
- Zoned schools: Pinewood Elementary School (math 37% / reading 39%, grade F, #1,587 of 2,144 statewide, top 74%, 726 students, 64% FRL); Dr. David L. Anderson Middle School (math 51% / reading 46%, grade C-, #274 of 571 statewide, top 50%, 1,035 students, 63% FRL); Martin County High School (math 45% / reading 54%, grade D, #179 of 667 statewide, top 29%, 2,273 students, 42% FRL) — zoned schools average 56% FRL vs 41% district-wide (16 pts higher); higher-poverty schools than district average — tighter screening recommended.
- Market conditions: Rents soft (-0.7%/yr); 259 active listings in the ZIP; 39 comparable units currently listed for rent nearby; rentals at typical pace (median 26d on market — plan ~3-4 weeks tenant-placement turnaround); 737 units permitted in Martin County in 2024 (167 in 5+ unit buildings).
- This rent runs 45% of the median local income ($63k/yr) — at the standard rent-burdened threshold; future hikes will face affordability resistance.
Forward outlook
- Local home prices are declining (-3.0%/yr); year-one equity from $1k of loan paydown is wiped out by about $5k of value loss. Plan a longer hold.
- Martin County population projected at +19% by 2050 — long-run rental-demand tailwind backs the buy-and-hold thesis.
- At projected returns (-3.0% appreciation + 0.0% rent growth), your $43k cash investment doubles in ~7 years — after that, you're playing with house money.
Negotiation context
- It's been on market 19 days — a 2% lower offer ($152k) is reasonable based on typical stale-listing flexibility.
- 3 sale attempts since 11y ago with the ask held roughly flat each time — persistent listings suggest the price (not the market) is what's stuck; bring a comps-based counter.
- Current owner paid $112k; 38% above their basis — modest negotiation headroom, anchor on the comps not their cost.
Risks & watch-outs
- Climate carrying-cost: severe wind risk, 99% chance of damaging wind over 30y; extreme-heat days projected 7→24/yr by 2055 (HVAC capex compounding) — expect insurance premiums to compound above CPI over the hold.
Questions for the listing agent
- Any open or pending special assessments — roof, HVAC, plumbing, elevator, façade? What's the per-unit balance and payoff schedule, and is the seller paying it off at close or rolling it to the buyer?
- Is there a deadline driving the sale (1031 exchange, divorce, estate, relocation)? That informs how much negotiation room exists.
- Schools are A-rated — typically a magnet for longer-tenancy family renters. What's the average tenant stay here, and is there a school-zone premium baked into asking?
- What's the average days-on-market for RENTAL listings here right now (not sales)? A rising rental-DOM trend means longer vacancies and softer asking-rent achievability than the comps imply.
- What's the recent tenant-quality profile in this submarket — average credit score on applications, eviction rate, late-payment / NSF rate, and stable-employment percentage? A property-management company in the area should have these aggregated.
- How much new apartment / multifamily construction is in the pipeline within 1–3 miles? Heavy new supply (>2% of stock underway) typically softens rents 12–24 months out; light construction supports rent growth.
Investment metrics
- 1% rule
- 1.51% ✓
- Cap rate
- 12.33%
- Cash-on-cash
- 21.57%
- DSCR
- 1.96
- GRM
- 5.5
CMA / ARV
No comps found within radius.
Projected returns pro-forma
-3.0% appreciation · 0.0% rent growth · sell at horizon
- IRR
- 10.7%
- Equity multiple
- 1.41×
- Total profit
- $17,630
- Equity at exit
- $22,962
- IRR
- 17.2%
- Equity multiple
- 2.22×
- Total profit
- $52,700
- Equity at exit
- $13,315
Cash invested: $43,120 (down + closing). Projections, not guarantees.
Landlord ↔ Tenant lean methodology
- Overall (STATE)
- 87 Strongly Landlord-Friendly
- State Florida
- 87 Strongly Landlord-Friendly · R+3
- County
- — inherits STATE
- City
- — inherits STATE
ZIP-level market 34994
- Home prices YoY
- -27.1%
- Rents YoY
- -0.7%
- Active inventory
- 259
- Price-to-rent
- 5.5×
Monthly cashflow live
- Estimated rent
- $2,328 high interval (Pro) →
- Mortgage (P&I)
- −$808
- Tax est. 1.5%
- −$192 /mo · $2,310/yr
- Insurance
- −$64
- HOA
- −$0
- Vacancy / Maint / Mgmt
- −$489
- Net cashflow
- $775
Break-even live
Sensitivity live
| Price | -10% $882 | -5% $828 | +0% $775 | +5% $722 | +10% $669 |
|---|---|---|---|---|---|
| Rent | -10% $591 | -5% $683 | +0% $775 | +5% $867 | +10% $959 |
| Rate | -1.0pp $853 | -0.5pp $814 | base $775 | +0.5pp $735 | +1.0pp $695 |
UW: 25.0% down · 7.5% · 30yr · 1.5% tax · 5.0% vac · 8.0% maint · 8.0% mgmt
Financing live
Cash to close
- Down payment
- $38,500
- Closing costs
- $4,620
- Reserves months
- —
- Total cash needed
- —
Loan-product check · same deal, 3 products live
Conventional
25% down · 7.5% · 30yr
- Down + closing
- —
- Monthly P&I
- —
- Monthly cashflow
- —
- DSCR
- —
- Eligible?
- —
Personal DTI + credit; lowest rate.
DSCR
20% down · 8.5% · 30yr
- Down + closing
- —
- Monthly P&I
- —
- Monthly cashflow
- —
- DSCR
- —
- Eligible?
- —
No personal income docs; deal must DSCR.
Hard money
10% down · 12.0% · 12mo
- Down + closing
- —
- Monthly P&I
- —
- Monthly cashflow
- —
- DSCR
- —
- Eligible?
- —
Short-term bridge; refi at stabilization.
Rent comps 39 comps
| Address | Beds | Baths | Sqft | Rent | $/sqft | DOM | Units | Dist |
|---|---|---|---|---|---|---|---|---|
| 2600 S Kanner Hwy Stuart, FL | 1.0–2.0 | 1.5–2.0 | 890 | $1,950 | $2.19 | 16d | 3 | 0.17mi |
| 44 SE Sedona Cir #201 Stuart, FL | 3.0 | 2.0 | 1443 | $2,200 | $1.52 | 25d | 1 | 0.26mi |
| 47 SE Sedona Cir #203 Stuart, FL | 3.0 | 2.5 | 1450 | $2,200 | $1.52 | 25d | 1 | 0.26mi |
| 40 SE Sedona Cir #103 Stuart, FL | 3.0 | 2.5 | 1671 | $3,800 | $2.27 | 25d | 1 | 0.46mi |
| 345 SE Angler Dr Stuart, FL | 3.0 | 2.5 | 1475 | $2,650 | $1.80 | 23d | 1 | 0.49mi |
| 1900 S Kanner Hwy Unit 2-203 Stuart, FL | 2.0 | 2.0 | 1086 | $1,800 | $1.66 | 16d | 1 | 0.55mi |
| 1950 SW Palm City Rd Stuart, FL | 2.0 | 2.0 | 1031 | $3,150 | $3.05 | 25d | 3 | 0.56mi |
| 1950 SW Palm City Rd Unit 4-4205 Stuart, FL | 2.0 | 2.0 | 938 | $2,400 | $2.56 | 16d | 1 | 0.57mi |
| 85 SE Hancock St Stuart, FL | 1.0–2.0 | 1.0–2.0 | 1278 | $2,300 | $1.80 | 16d | 2 | 0.57mi |
| 400 SE Central Pkwy Stuart, FL | 1.0–2.0 | 1.0–2.0 | 918 | $2,640 | $2.87 | 16d | 16 | 0.60mi |
| 1871 SW Palm City Rd Unit G401 Stuart, FL | 3.0 | 2.0 | 1289 | $2,200 | $1.71 | 25d | 1 | 0.66mi |
| 801 SE Central Pkwy #7 Stuart, FL | 2.0 | 2.0 | 1046 | $2,150 | $2.06 | 16d | 1 | 0.69mi |
| 1868 SW Palm City Rd Apt 202 Stuart, FL | 2.0 | 2.0 | 1191 | $2,900 | $2.43 | 25d | 1 | 0.69mi |
| 514 SW North Carolina Dr Stuart, FL | 3.0 | 2.0 | 1836 | $3,695 | $2.01 | 16d | 1 | 0.78mi |
| 2819 SW Cornell Ave Palm City, FL | 2.0 | 1.5 | 1060 | $2,150 | $2.03 | 23d | 1 | 0.85mi |
| 2124 SE Edler Dr Stuart, FL | 2.0 | 2.0 | 876 | $1,800 | $2.05 | 25d | 1 | 0.88mi |
| 2118 SE Edler Dr Unit B Stuart, FL | 2.0 | 2.0 | 876 | $1,995 | $2.28 | 25d | 1 | 0.89mi |
| 3001 SE Aster Ln #908 Stuart, FL | 2.0 | 2.0 | 1209 | $2,100 | $1.74 | 25d | 1 | 0.96mi |
| 1215 SE Glenwood Dr Stuart, FL | 2.0 | 2.0 | 1089 | $1,859 | $1.71 | 16d | 10 | 0.96mi |
| 3031 SE Aster Ln Unit 608 Stuart, FL | 2.0 | 2.0 | 1019 | $1,870 | $1.84 | 25d | 1 | 1.00mi |
| 3151 SE Aster Ln #1306 Stuart, FL | 2.0 | 2.0 | 1034 | $1,800 | $1.74 | 25d | 1 | 1.01mi |
| 3800 S Kanner Hwy Stuart, FL | 3.0 | 1.0–2.0 | 970 | $2,604 | $2.68 | 16d | 21 | 1.07mi |
| 664 SW 35th St Unit 6 Palm City, FL | 2.0 | 1.5 | 900 | $1,850 | $2.06 | 16d | 1 | 1.08mi |
| 664 SW 35th St Apt 3 Palm City, FL | 2.0 | 1.5 | 900 | $1,775 | $1.97 | 16d | 1 | 1.08mi |
| 1290 SE Parkview Pl Unit A2 Stuart, FL | 2.0 | 2.0 | 1021 | $1,800 | $1.76 | 23d | 1 | 1.10mi |
| 950 S Kanner Hwy Stuart, FL | 1.0–2.0 | 1.0–2.5 | 1062 | $2,000 | $1.88 | 25d | 5 | 1.11mi |
| 950 S Kanner Hwy Stuart, FL | 1.0–2.0 | 1.0–2.0 | 850 | $2,000 | $2.35 | 16d | 4 | 1.11mi |
| 950 S Kanner Hwy Stuart, FL | 2.0 | 2.0 | 1019 | $1,888 | $1.85 | 23d | 3 | 1.11mi |
| 2759 SE Birmingham Dr Stuart, FL | 2.0 | 2.5 | 1191 | $2,600 | $2.18 | 25d | 1 | 1.13mi |
| 3302 SE Aster Ln Stuart, FL | 2.0 | 2.0 | 888 | $1,900 | $2.14 | 25d | 1 | 1.15mi |
| 3266 SE Aster Ln Unit H246 Stuart, FL | 2.0 | 2.0 | 1200 | $2,100 | $1.75 | 25d | 1 | 1.15mi |
| 3236 SE Aster Ln Unit M225 Stuart, FL | 2.0 | 2.0 | 1200 | $2,500 | $2.08 | 25d | 1 | 1.15mi |
| 3405 SW Feroe Ave Palm City, FL | 2.0 | 2.0 | 1275 | $2,800 | $2.20 | 25d | 1 | 1.24mi |
| 3375 SW Mapp Rd Unit 204 Palm City, FL | 3.0 | 2.0 | 1067 | $2,300 | $2.16 | 25d | 1 | 1.31mi |
| 801 SE Central Ave Stuart, FL | 3.0 | 1.0 | 899 | $2,300 | $2.56 | 16d | 1 | 1.33mi |
| 1571 SE Hampshire Way #104 Stuart, FL | 3.0 | 2.0 | 1210 | $2,500 | $2.07 | 25d | 1 | 1.33mi |
| 173 SW Otter Run Pl Stuart, FL | 3.0 | 2.5 | 1753 | $2,350 | $1.34 | 25d | 1 | 1.35mi |
| 701 SW Bryant Ave Stuart, FL | 2.0 | 1.0 | 1295 | $3,300 | $2.55 | 16d | 1 | 1.36mi |
| 1544 SW Silver Pine Way Unit F-104 Palm City, FL | 2.0 | 2.0 | 1170 | $2,500 | $2.14 | 16d | 1 | 1.49mi |
HOA detail condo
- Monthly dues
- $0 · $0/yr
- Likely covers
- electric
- Assessments
- None detected in remarks — confirm with the listing agent.
Listing history 13 events
-
2026-06-21days on market $154,000 Active 19 DOM
-
2026-06-18days on market $154,000 Active 16 DOM
-
2026-06-17days on market $154,000 Active 15 DOM
-
2026-06-16days on market $154,000 Active 14 DOM
-
2026-06-15days on market $154,000 Active 13 DOM
-
2026-06-14days on market $154,000 Active 11 DOM
-
2026-06-13days on market $154,000 Active 10 DOM
-
2026-06-10days on market $154,000 Active 8 DOM
-
2026-06-09days on market $154,000 Active 7 DOM
-
2026-06-08days on market $154,000 Active 6 DOM
-
2026-06-07days on market $154,000 Active 5 DOM
-
2026-06-03remarks 695-char remark
-
2026-06-03$154,000 Active 1 DOM
ⓘ Source: listings_history table (triggers on properties + properties_extension) + one-shot
backfill from property_details.listing_events for pre-trigger history.
Climate risk First Street
- Flood 4/10 Moderate FEMA zone X (unshaded) · 23% chance over 30 yrs
- Wildfire 1/10 Low
- Heat 10/10 Extreme 7 d/yr ≥106°F today · 24 d/yr by 30 yrs out
- Wind 10/10 Extreme 99% chance of damaging wind over 30 yrs
- Air quality 2/10 Low 1 unhealthy d/yr today · 1 by 30 yrs out
Nearby sold comps map
Loading sold comps map…
Walkable amenities ~0.75 mi
Loading nearby amenities…
Taxation est. · year 1
- Rental income
- $27,941
- − Mortgage interest
- −$8,626
- − Property taxes
- −$2,310
- − Insurance
- −$770
- − Repairs & maintenance
- −$2,235
- − Management
- −$2,235
- − Depreciation
- −$4,480
- Taxable income
- $7,284
- Est. tax owed @ 24.0%
- −$1,748
- After-tax cash flow
- $7,554/yr
For passive investors: Depreciation is non-cash, so a rental often shows a tax loss while cash-flowing — sheltering income. Rental losses are passive: they offset passive income freely, and up to $25,000/yr can offset ordinary (W-2) income if you actively participate and your MAGI is under $100k (phasing out to $0 by $150k); unused losses carry forward. On sale, claimed depreciation is recaptured at up to 25%, and gains may owe capital-gains tax (a 1031 exchange can defer both). Figures are a year-1 estimate at your 24.0% rate — not tax advice; consult a CPA.
Schools (NCES district)
- District
- Martin
- NCES district ID
- 1201290
- Math proficiency
- 52% ▼ -14.00%
- Reading proficiency
- 53% ▼ -4.00%
- Median HH income
- $52,482
- Composite
- 45.1/100
- National rank
- #2690
- State rank
- #24 of 73 in FL
Livability — Stuart
- Score
- 84/100
- State rank
- #39
- US rank
- #790
Category grades
Schools grade is shown separately in the Schools card above.
Census & demographics
- County
- Martin County · 165,223 people
- City population
- 65,812
- Metro
- Port St. Lucie, FL
- Population (ZIP)
- 18,737
- Household income
- $62,533
- Rent vs Own
- Severe rent burden
- 1408.0
Population outlook (Martin County) Hauer SSP2
- Today (2025)
- 172,383 people
- By 2030
- 180,192 · +4.5%
- By 2040
- 194,114 · +12.6%
- By 2050
- 204,992 · +18.9%
- By 2075
- 229,641 · +33.2%
- By 2100
- 232,146 · +34.7%
Race, ethnicity, and origin ACS 2023
- Neighborhood character
- Majority White (65%)
- Race & ethnicity
- White 65% Hispanic / Latino 21% Two or more races 12% Black 11%
- Hispanic origin (detail)
- Mexican 6% Puerto Rican 5% Cuban 1%
- Common ancestry
- Romanian 5% Lithuanian 3% Slovak 2%
- Foreign-born
- 12% · Canada
- Languages at home
- 80% English-only · Spanish 16% Russian/Polish/Slavic 2% Other Indo-European 1%
Political lean MEDSL · Martin
- 2024 margin
- Solid R (+31.1) · D 34.1% · R 65.2%
- 2008→2024 swing
- -17.5pp toward R · 2008: -13.6pp · 2024: -31.1pp
- All cycles
- 2024: R+31.1 2020: R+24.6 2016: R+26.9 2012: R+22.9 2008: R+13.6
Not yet ingested
- Civics
- —
Market trends
- HPI YoY
- ▼ -130.08%
- Current HPI
- 349.7061
- Rent YoY
- ▼ -0.69%
- Metro
- Port St. Lucie, FL
- State GDP YoY
- ▲ 3.28%
- F500 in state
- 36
Industry mix (Fortune 500 HQ in FL)
| Industry | F500 HQs | Revenue |
|---|---|---|
| Industrial Technology | 2 | $29B |
|
||
| Insurance | 2 | $17B |
|
||
| Retail | 1 | $60B |
|
||
| Technology Distribution | 1 | $58B |
|
||
| Homebuilding | 1 | $35B |
|
||
| Technology Manufacturing | 1 | $35B |
|
||
Price history
+327.8% since first listed6 events — show timeline
- 2026-06-03 Listed $154,000 FSBO.com
- 2021-03-19 Sold (MLS) $112,000 Beaches MLS
- 2021-03-06 Pending — Beaches MLS
- 2021-01-18 Listed $115,500 Beaches MLS
- 2015-06-26 Sold (MLS) $36,000 MCRTC
- 2015-03-04 Listed $36,000 MCRTC
Property tax history
-1.8%/yrLatest (2025): $139 · -3.6% YoY. Source: county tax records.
Cash-flow waterfall
monthlySold comps — $/sqft
last 12 mo · ≤1 miLoading sold comps…