622 N Lake Ave · Davenport, OK
Flood risk 1/10 · Minimal
- FEMA flood zone
- X (unshaded)
- Chance of flooding over 30 yrs
- 0.0%
- Est. flood insurance / yr
- $507 – $1,088
Fire risk 6/10 · Moderate
- Est. fire insurance / yr
- $2,463 – $4,575
Heat risk 6/10 · Moderate
- Hot days now (above 111°F)
- 7 days/yr
- Hot days in 30 yrs
- 19 days/yr
Wind risk 3/10 · Minor
- Chance of severe wind over 30 yrs
- 6.0%
Air-quality risk 2/10 · Minimal
- Unhealthy air days now
- 1 days/yr
- Unhealthy air days in 30 yrs
- 1 days/yr
Risk factors via First Street. Map © Google.
Why this score? — see what drove the B+ grade
The composite is a weighted blend of 9 inputs, each scored 0–100. Each bar is that input's sub-score; the figure is the points it added to the 100-point composite (weight × sub-score).
- Cash flow +30.0/30.0
- 1% rule +10.0/10.0
- DSCR +10.0/10.0
- Appreciation +10.0/10.0
- ARV discount +7.5/15.0
- Livability +3.1/5.0
- Rent growth +2.5/5.0
- Schools +2.5/10.0
- Condition / age +1.0/5.0
$59,000
🖨 Deal sheet 📄 Offer letter ✓ Due diligence
Listing remarks
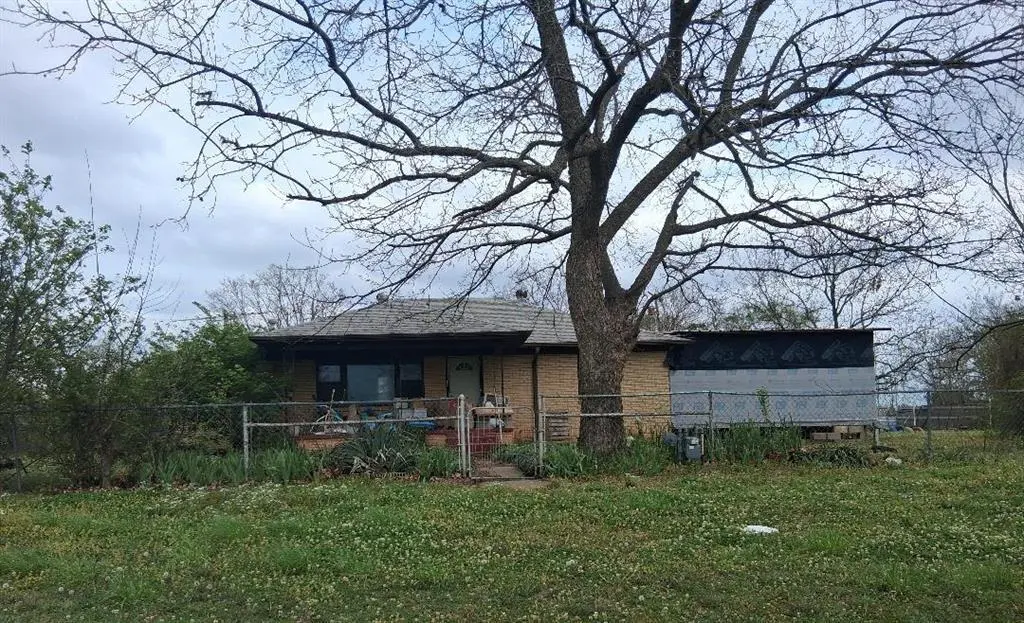
HANDYMAN SPECIAL! 3 Bedroom, 1 Bathroom Brick home located on a Corner Lot. Property has a Shop building & also an apartment that is need of repairs. Home needs electrical work and repairs. Basement, Large yard.
Key facts
- Basement
- Large yard
- Corner lot
Tags
Property features AI
Finance
- Other: Property is vacant; Located in Belless Addition; Homestead not indicated
- Financial info: Not assumable; Loan qualification possible; Listed as REO / bank-owned
- HOA & community: No mandatory association dues
Exterior
- Parking: 1-car garage
- Utilities: Living area listed as 1,280 (assessor)
- Home design: Single-family residence; One story; Residential property; Existing property
- Construction: Brick and frame construction; Composition roof; Conventional foundation; Built (existing)
- Exterior features: Covered porch; Outbuildings; Workshop; Below-ground storm shelter; Interior lot
Interior
- Bedrooms: 3 bedrooms
- Bathrooms: 1 full bathroom
- Interior features: One living area; No fireplace; No in-law plan
Neighborhood map
What this means for you Summary
Snapshot
- This is a 3-bed/1.0-bath single-family listed at $59k. Condition is rated poor.
Deal economics
- At list price, monthly cash flow is $517 ($6k/yr) — positive.
- The deal already cash-flows at list — no discount required.
- Meets the 1% rule at list price ($1k rent vs $59k).
- Recommended offer: $58k (1.5% below list) — sets the bar for market timing.
Location & tenants
- Location reads 61/100 on livability (#294 in OK) — a middle-class / working-renter tenant base. Strengths: cost of living A+, housing A+; Watch: amenities F, commute F, employment F.
- Davenport (rural): math 25% / reading 25% proficiency, ranked #335 of 513 in OK (top 65%) — low school quality limits family demand, transient renter base, plan for 1-2y turnover.
- Zoned schools: Davenport Es (math 22% / reading 32%, grade F, #311 of 845 statewide, top 40%, 276 students, 0% FRL); Davenport Hs (math 15% / reading 10%, grade F, #354 of 447 statewide, top 79%, 99 students, 0% FRL) — zoned schools average 0% FRL vs 51% district-wide (51 pts lower); this property's tenant base skews higher-income than the district average.
- Market conditions: 4 active listings in the ZIP; 19 units permitted in Lincoln County in 2024 (0 in 5+ unit buildings).
Forward outlook
- In year one you build about $6k of equity ($408 loan paydown + $6k appreciation (10.0% local appreciation)).
- At projected returns (10.0% appreciation + 3.0% rent growth), your $17k cash investment doubles in ~2 years — after that, you're playing with house money.
- By year 6, paydown + projected appreciation supports a ~$37k cash-out refi (75% LTV) — recoverable capital for the next deal without selling this one.
Negotiation context
- It's been on market 20 days — a 2% lower offer ($58k) is reasonable based on typical stale-listing flexibility.
Risks & watch-outs
- Watch-outs: built in 1951 — expect roof / HVAC / electrical / plumbing capex.
- Climate carrying-cost: major wildfire risk; extreme-heat days projected 7→19/yr by 2055 (HVAC capex compounding) — expect insurance premiums to compound above CPI over the hold.
Questions for the listing agent
- Have any recent inspections been done? Can we get a copy of the seller's disclosures and any deferred-maintenance estimates?
- Built in 1951 — when were the roof, HVAC, electrical panel, plumbing, and water heater last replaced?
- Is there a deadline driving the sale (1031 exchange, divorce, estate, relocation)? That informs how much negotiation room exists.
- Schools are F-rated, which usually means shorter tenancies and higher turnover. Who's the typical renter profile here, and what's been the actual vacancy rate?
- What's the average days-on-market for RENTAL listings here right now (not sales)? A rising rental-DOM trend means longer vacancies and softer asking-rent achievability than the comps imply.
- What's the recent tenant-quality profile in this submarket — average credit score on applications, eviction rate, late-payment / NSF rate, and stable-employment percentage? A property-management company in the area should have these aggregated.
- How much new for-sale + rental construction is in the pipeline within 1–3 miles? Heavy new supply typically softens prices + rents 12–24 months out; constrained supply supports both.
Investment metrics
- 1% rule
- 1.98% ✓
- Cap rate
- 16.81%
- Cash-on-cash
- 37.57%
- DSCR
- 2.67
- GRM
- 4.2
CMA / ARV
- ARV (on-the-fly)
- $143,360
- Comps found
- 5
Show comp detail 5 sales within ~0.75 mi
| Address | Dist | Beds/Ba | Sqft | Sold | Price | $/sf | Match |
|---|---|---|---|---|---|---|---|
| 622 East Ave | 0.07mi | 3/1.0 | 1,275 (-0%) | 13mo | $145,000 | $114 | 86 |
| 1003 N East Ave | 0.21mi | 3/1.5 | 1,256 (-2%) | 3mo | $141,000 | $112 | 83 |
| 406 E 4th St | 0.18mi | 3/1.5 | 1,356 (+6%) | 18mo | $140,000 | $103 | 64 |
| 206 E Frisco St | 0.52mi | 3/2.0 | 1,280 (0%) | 10mo | $81,500 | $64 | 63 |
| 103 W 1st | 0.55mi | 3/2.0 | 1,296 (+1%) | 9mo | $145,000 | $112 | 60 |
Match score weights: distance 35% · size 25% · config 20% · recency 20%. Top-matched comps best support the ARV.
Projected returns pro-forma
10.0% appreciation · 3.0% rent growth · sell at horizon
- IRR
- 53.2%
- Equity multiple
- 4.94×
- Total profit
- $65,093
- Equity at exit
- $53,152
- IRR
- 46.8%
- Equity multiple
- 11.04×
- Total profit
- $165,818
- Equity at exit
- $114,624
Cash invested: $16,520 (down + closing). Projections, not guarantees.
Landlord ↔ Tenant lean methodology
- Overall (STATE)
- 83 Strongly Landlord-Friendly
- State Oklahoma
- 83 Strongly Landlord-Friendly · R+20
- County
- — inherits STATE
- City
- — inherits STATE
ZIP-level market 74026
- Home prices YoY
- 5.1%
- Active inventory
- 4
- Price-to-rent
- 4.2×
Monthly cashflow live
- Estimated rent
- $1,171 medium interval (Pro) →
- Mortgage (P&I)
- −$309
- Tax est. 1.5%
- −$74 /mo · $885/yr
- Insurance
- −$25
- HOA
- −$0
- Vacancy / Maint / Mgmt
- −$246
- Net cashflow
- $517
Break-even live
UW: 25.0% down · 7.5% · 30yr · 1.5% tax · 5.0% vac · 8.0% maint · 8.0% mgmt
Financing live
Cash to close
- Down payment
- $14,750
- Closing costs
- $1,770
- Reserves months
- —
- Total cash needed
- —
Loan-product check · same deal, 3 products live
Conventional
25% down · 7.5% · 30yr
- Down + closing
- —
- Monthly P&I
- —
- Monthly cashflow
- —
- DSCR
- —
- Eligible?
- —
Personal DTI + credit; lowest rate.
DSCR
20% down · 8.5% · 30yr
- Down + closing
- —
- Monthly P&I
- —
- Monthly cashflow
- —
- DSCR
- —
- Eligible?
- —
No personal income docs; deal must DSCR.
Hard money
10% down · 12.0% · 12mo
- Down + closing
- —
- Monthly P&I
- —
- Monthly cashflow
- —
- DSCR
- —
- Eligible?
- —
Short-term bridge; refi at stabilization.
Listing history 13 events
-
2026-06-17status $59,000 Pending 20 DOM
-
2026-06-16days on market $59,000 Active 20 DOM
-
2026-06-15days on market $59,000 Active 19 DOM
-
2026-06-13days on market $59,000 Active 17 DOM
-
2026-06-12days on market $59,000 Active 16 DOM
-
2026-06-09days on market $59,000 Active 13 DOM
-
2026-06-08days on market $59,000 Active 12 DOM
-
2026-06-08days on market $59,000 Active 11 DOM
-
2026-06-07days on market $59,000 Active 10 DOM
-
2026-06-04days on market $59,000 Active 7 DOM
-
2026-06-02days on market $59,000 Active 6 DOM
-
2026-06-01days on market $59,000 Active 5 DOM
-
2026-05-31days on market $59,000 Active 4 DOM
ⓘ Source: listings_history table (triggers on properties + properties_extension) + one-shot
backfill from property_details.listing_events for pre-trigger history.
Climate risk First Street
- Flood 1/10 Low FEMA zone X (unshaded) · 0% chance over 30 yrs
- Wildfire 6/10 Major
- Heat 6/10 Major 7 d/yr ≥111°F today · 19 d/yr by 30 yrs out
- Wind 3/10 Moderate 6% chance of damaging wind over 30 yrs
- Air quality 2/10 Low 1 unhealthy d/yr today · 1 by 30 yrs out
Nearby sold comps map
Loading sold comps map…
Walkable amenities ~0.75 mi
Loading nearby amenities…
Taxation est. · year 1
- Rental income
- $14,050
- − Mortgage interest
- −$3,305
- − Property taxes
- −$885
- − Insurance
- −$295
- − Repairs & maintenance
- −$1,124
- − Management
- −$1,124
- − Depreciation
- −$1,716
- Taxable income
- $5,601
- Est. tax owed @ 24.0%
- −$1,344
- After-tax cash flow
- $4,863/yr
For passive investors: Depreciation is non-cash, so a rental often shows a tax loss while cash-flowing — sheltering income. Rental losses are passive: they offset passive income freely, and up to $25,000/yr can offset ordinary (W-2) income if you actively participate and your MAGI is under $100k (phasing out to $0 by $150k); unused losses carry forward. On sale, claimed depreciation is recaptured at up to 25%, and gains may owe capital-gains tax (a 1031 exchange can defer both). Figures are a year-1 estimate at your 24.0% rate — not tax advice; consult a CPA.
Condition & rehab AI · 10 photos
This property requires extensive repairs and structural work to be considered habitable. Immediate safety concerns and structural integrity issues need to be addressed.
Repairs flagged
- Major Exposed wiring — Safety hazard
- Major Structural damage — Structural integrity compromised
Value-add opportunities
- Both Electrical work — Safety and functionality
- Both Structural repairs — Safety and functionality
Renovation cost estimate screening
| Repair item | Severity | Est. cost |
|---|---|---|
| Exposed wiring · Safety hazard | Major | $15,000–50,000 |
| Structural damage · Structural integrity compromised | Major | $15,000–50,000 |
| Total estimated repair cost · 2 items | $30,000–100,000 |
Value-add ROI direction
- Both Electrical work — Safety and functionality ↑
- Both Structural repairs — Safety and functionality ↑
ⓘ Cost ranges are severity-bucket heuristics (US national rule-of-thumb). Get contractor quotes + a written scope before underwriting a rehab budget.
Schools (NCES district)
- District
- Davenport
- NCES district ID
- 4009450
- Math proficiency
- 25% ▲ 10.00%
- Reading proficiency
- 25% ▬ 0.00%
- Median HH income
- $43,781
- Composite
- 24.5/100
- National rank
- #13079
- State rank
- #335 of 513 in OK
Livability — Davenport
- Score
- 61/100
- State rank
- #294
- US rank
- #17664
Category grades
Schools grade is shown separately in the Schools card above.
Census & demographics
- Census place
- Davenport, OK
- Population (ZIP)
- 888
Population outlook (Lincoln County) Hauer SSP2
- Today (2025)
- 36,104 people
- By 2030
- 36,435 · +0.9%
- By 2040
- 36,696 · +1.6%
- By 2050
- 36,216 · +0.3%
- By 2075
- 35,057 · -2.9%
- By 2100
- 31,333 · -13.2%
Race, ethnicity, and origin ACS 2023
- Neighborhood character
- Predominantly White (78%)
- Race & ethnicity
- White 78% Two or more races 12% Native American 8% Hispanic / Latino 6%
- Hispanic origin (detail)
- Mexican 2%
- Common ancestry
- Slovak 3% Serbian 1% Iranian 1%
- Foreign-born
- 1% · Canada
- Languages at home
- 98% English-only · Spanish 2%
Political lean MEDSL · Lincoln
- 2024 margin
- Solid R (+63.3) · D 17.5% · R 80.8% · Other 1.7%
- 2008→2024 swing
- -13.4pp toward R · 2008: -49.8pp · 2024: -63.3pp
- All cycles
- 2024: R+63.3 2020: R+63.2 2016: R+60.1 2012: R+49.0 2008: R+49.8
Not yet ingested
- Civics
- —
Market trends
- HPI YoY
- ▲ 16.91%
- Current HPI
- 350.4694
- Rent YoY
- —
- Metro
- —
- State GDP YoY
- ▲ 1.55%
- F500 in state
- 6
Industry mix (Fortune 500 HQ in OK)
| Industry | F500 HQs | Revenue |
|---|---|---|
| Energy | 3 | $48B |
|
||
Price history
1 event — show timeline
- 2026-05-26 Listed $59,000 MLSOK
Cash-flow waterfall
monthlySold comps — $/sqft
last 12 mo · ≤1 miLoading sold comps…