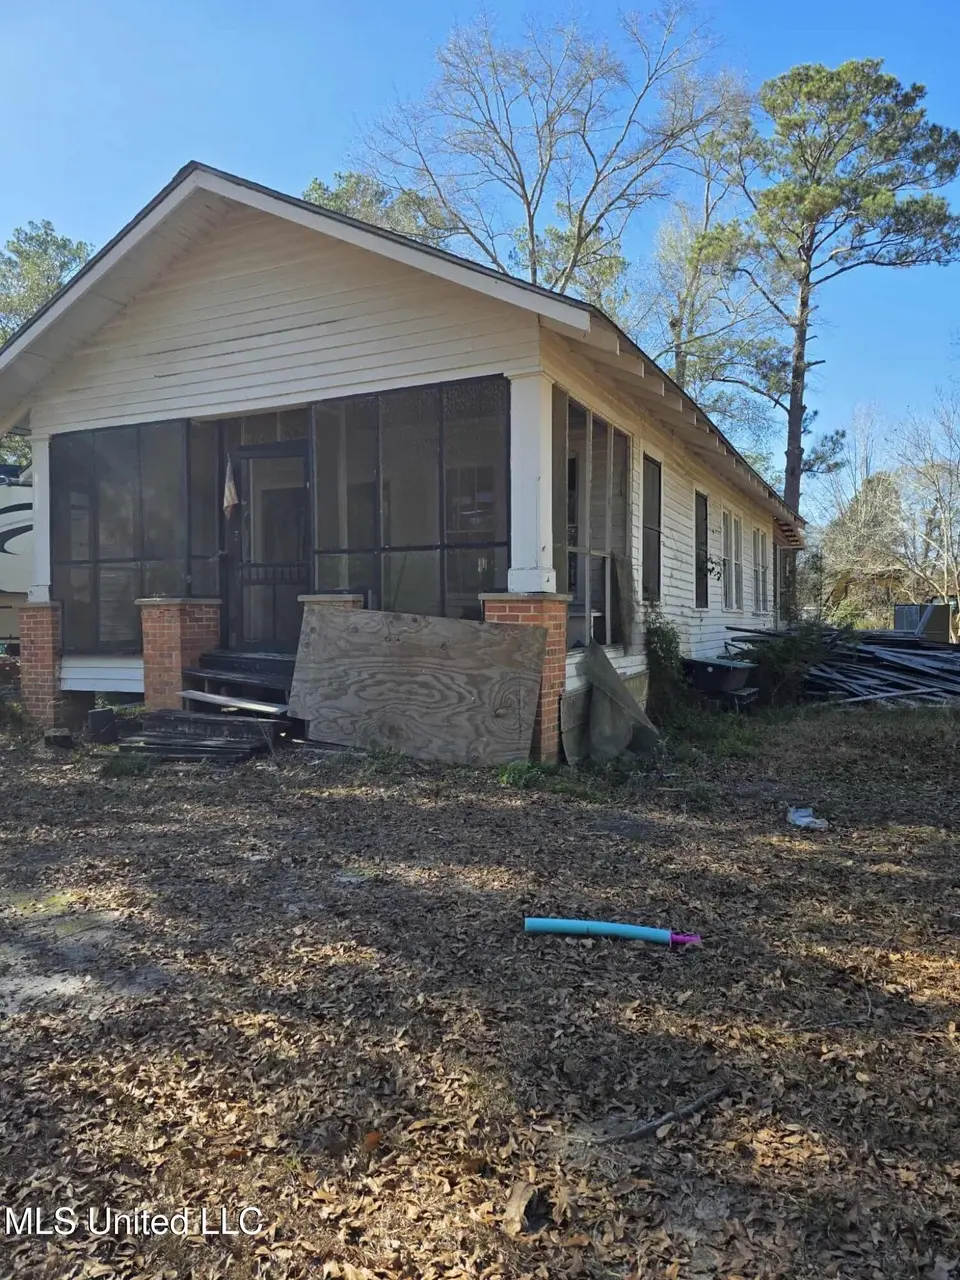
544 Lafayette Ave · Leakesville, MS
Flood risk 9/10 · Severe
- FEMA flood zone
- X (unshaded)
- Chance of flooding over 30 yrs
- 0.99%
- Est. flood insurance / yr
- $507 – $1,088
Fire risk 3/10 · Minor
- Est. fire insurance / yr
- $1,241 – $2,305
Heat risk 8/10 · Major
- Hot days now (above 108°F)
- 7 days/yr
- Hot days in 30 yrs
- 20 days/yr
Wind risk 9/10 · Severe
- Chance of severe wind over 30 yrs
- 99.0%
Air-quality risk 1/10 · Minimal
- Unhealthy air days now
- 0 days/yr
- Unhealthy air days in 30 yrs
- 0 days/yr
Risk factors via First Street. Map © Google.
Why this score? — see what drove the A- grade
The composite is a weighted blend of 9 inputs, each scored 0–100. Each bar is that input's sub-score; the figure is the points it added to the 100-point composite (weight × sub-score).
- Cash flow +30.0/30.0
- ARV discount +12.8/15.0
- 1% rule +10.0/10.0
- DSCR +10.0/10.0
- Appreciation +9.4/10.0
- Livability +3.2/5.0
- Schools +2.6/10.0
- Rent growth +2.5/5.0
- Condition / age +1.0/5.0
$80,000
🖨 Deal sheet (PDF) 📄 Offer letter ✓ Due diligence
Listing remarks MLS
House is included in sale and there are two lots that total 2.67 acres. The campers will be moved by end of January.
Key facts
- Two lots
- 2.67 acres
- 2.67 acre lot
Tags
Neighborhood map
What this means for you Summary
Snapshot
- This is a 2-bed/1.0-bath single-family listed at $80k. Condition is rated poor.
Deal economics
- At list price, monthly cash flow is $1k ($13k/yr) — positive.
- The deal already cash-flows at list — no discount required.
- Meets the 1% rule at list price ($2k rent vs $80k).
- Recommended offer: $70k (12.0% below list) — sets the bar for market timing.
Location & tenants
- Location reads 65/100 on livability (#109 in MS) — a middle-class / working-renter tenant base. Strengths: cost of living A+, health & safety A+, housing B+; Watch: schools D-, amenities F, commute F.
- Greene County School District (rural): math 28% / reading 34% proficiency, ranked #67 of 130 in MS (top 52%) — families likely to look elsewhere, expect single-tenant / working-renter base with shorter leases; 71% free/reduced lunch — lower-income household profile, screen leases tightly.
- Market conditions: 24 active listings in the ZIP; 2 units permitted in Greene County in 2024 (0 in 5+ unit buildings).
Forward outlook
- In year one you build about $8k of equity ($553 loan paydown + $7k appreciation (8.8% local appreciation)).
- Greene County population projected at -13% by 2050 — secular population decline; favor cash flow + early exit over multi-decade hold.
- At projected returns (8.8% appreciation + 3.0% rent growth), your $22k cash investment doubles in ~2 years — after that, you're playing with house money.
- By year 5, paydown + projected appreciation supports a ~$35k cash-out refi (75% LTV) — recoverable capital for the next deal without selling this one.
Negotiation context
- It's been on market 139 days — a 12% lower offer ($70k) is reasonable based on typical stale-listing flexibility.
Risks & watch-outs
- Watch-outs: flood insurance adds $66/mo; built in 1950 — expect roof / HVAC / electrical / plumbing capex.
- Climate carrying-cost: severe flood risk; severe wind risk, 99% chance of damaging wind over 30y; extreme-heat days projected 7→20/yr by 2055 (HVAC capex compounding) — expect insurance premiums to compound above CPI over the hold.
Questions for the listing agent
- It's been on market 139 days. Have you received any prior offers? Is the seller open to a 12% concession, seller financing, or rate buy-down credit?
- Have any recent inspections been done? Can we get a copy of the seller's disclosures and any deferred-maintenance estimates?
- Built in 1950 — when were the roof, HVAC, electrical panel, plumbing, and water heater last replaced?
- What's the actual annual flood-insurance premium (NFIP or private), and is the property in a SFHA with mandatory coverage?
- Why hasn't it sold? Are there any deal-killer items the seller is aware of (foundation, flood, title, zoning, code violations)?
- Is there a deadline driving the sale (1031 exchange, divorce, estate, relocation)? That informs how much negotiation room exists.
- Schools are D-rated, which usually means shorter tenancies and higher turnover. Who's the typical renter profile here, and what's been the actual vacancy rate?
- What's the average days-on-market for RENTAL listings here right now (not sales)? A rising rental-DOM trend means longer vacancies and softer asking-rent achievability than the comps imply.
- What's the recent tenant-quality profile in this submarket — average credit score on applications, eviction rate, late-payment / NSF rate, and stable-employment percentage? A property-management company in the area should have these aggregated.
- How much new for-sale + rental construction is in the pipeline within 1–3 miles? Heavy new supply typically softens prices + rents 12–24 months out; constrained supply supports both.
Investment metrics
- 1% rule
- 2.69% ✓
- Cap rate
- 23.55%
- Cash-on-cash
- 61.62%
- DSCR
- 3.74
- GRM
- 3.1
CMA / ARV
- ARV (median comp)
- $90,793
- List price
- $80,000
- Delta
- -11.89%
- Verdict
- UNDERPRICED
- Comps
- 6 within 1.0 mi
Show comp detail 1 sale within ~0.75 mi
| Address | Dist | Beds/Ba | Sqft | Sold | Price | $/sf | Match |
|---|---|---|---|---|---|---|---|
| 544 Lafayette Ave | 0.00mi | 2/1.0 | 982 (0%) | 0mo | $80,000 | $81 | 100 |
Match score weights: distance 35% · size 25% · config 20% · recency 20%. Top-matched comps best support the ARV.
Projected returns pro-forma
8.85% appreciation · 3.0% rent growth · sell at horizon
- IRR
- 69.3%
- Equity multiple
- 5.75×
- Total profit
- $106,472
- Equity at exit
- $65,482
- IRR
- 64.0%
- Equity multiple
- 12.53×
- Total profit
- $258,209
- Equity at exit
- $134,743
Cash invested: $22,400 (down + closing). Projections, not guarantees.
Landlord ↔ Tenant lean methodology
- Overall (STATE)
- 90 Strongly Landlord-Friendly
- State Mississippi
- 90 Strongly Landlord-Friendly · R+11
- County
- — inherits STATE
- City
- — inherits STATE
ZIP-level market 39451
- Home prices YoY
- 5.7%
- Active inventory
- 24
- Price-to-rent
- 3.1×
Monthly cashflow live
- Estimated rent
- $2,156 medium interval (Pro) →
- Mortgage (P&I)
- −$420
- Tax est. 1.5%
- −$100 /mo · $1,200/yr
- Insurance
- −$33
- Flood insurance flood zone
- −$66 /mo · $798/yr
- HOA
- −$0
- Vacancy / Maint / Mgmt
- −$453
- Net cashflow
- $1,084
Break-even live
Sensitivity live
| Price | -10% $1,139 | -5% $1,111 | +0% $1,084 | +5% $1,056 | +10% $1,028 |
|---|---|---|---|---|---|
| Rent | -10% $913 | -5% $999 | +0% $1,084 | +5% $1,169 | +10% $1,254 |
| Rate | -1.0pp $1,124 | -0.5pp $1,104 | base $1,084 | +0.5pp $1,063 | +1.0pp $1,042 |
UW: 25.0% down · 7.5% · 30yr · 1.5% tax · 5.0% vac · 8.0% maint · 8.0% mgmt
Financing live
Cash to close
- Down payment
- $20,000
- Closing costs
- $2,400
- Reserves months
- —
- Total cash needed
- —
Loan-product check · same deal, 3 products live
Conventional
25% down · 7.5% · 30yr
- Down + closing
- —
- Monthly P&I
- —
- Monthly cashflow
- —
- DSCR
- —
- Eligible?
- —
Personal DTI + credit; lowest rate.
DSCR
20% down · 8.5% · 30yr
- Down + closing
- —
- Monthly P&I
- —
- Monthly cashflow
- —
- DSCR
- —
- Eligible?
- —
No personal income docs; deal must DSCR.
Hard money
10% down · 12.0% · 12mo
- Down + closing
- —
- Monthly P&I
- —
- Monthly cashflow
- —
- DSCR
- —
- Eligible?
- —
Short-term bridge; refi at stabilization.
Listing history 2 events
-
2026-05-11price $80,000 116-char remark
Show marketing remark (116 chars)
House is included in sale and there are two lots that total 2.67 acres. The campers will be moved by end of January.
-
2026-01-06$99,000 Active 116-char remark
Show marketing remark (116 chars)
House is included in sale and there are two lots that total 2.67 acres. The campers will be moved by end of January.
ⓘ Source: listings_history table (triggers on properties + properties_extension) + one-shot
backfill from property_details.listing_events for pre-trigger history.
Climate risk First Street
- Flood 9/10 Extreme FEMA zone X (unshaded) · 99% chance over 30 yrs
- Wildfire 3/10 Moderate
- Heat 8/10 Severe 7 d/yr ≥108°F today · 20 d/yr by 30 yrs out
- Wind 9/10 Extreme 99% chance of damaging wind over 30 yrs
- Air quality 1/10 Low 0 unhealthy d/yr today · 0 by 30 yrs out
Nearby sold comps map
Loading sold comps map…
Walkable amenities ~0.75 mi
Loading nearby amenities…
Taxation est. · year 1
- Rental income
- $25,869
- − Mortgage interest
- −$4,481
- − Property taxes
- −$1,200
- − Insurance
- −$1,198
- − Repairs & maintenance
- −$2,070
- − Management
- −$2,070
- − Depreciation
- −$2,327
- Taxable income
- $12,524
- Est. tax owed @ 24.0%
- −$3,006
- After-tax cash flow
- $9,999/yr
For passive investors: Depreciation is non-cash, so a rental often shows a tax loss while cash-flowing — sheltering income. Rental losses are passive: they offset passive income freely, and up to $25,000/yr can offset ordinary (W-2) income if you actively participate and your MAGI is under $100k (phasing out to $0 by $150k); unused losses carry forward. On sale, claimed depreciation is recaptured at up to 25%, and gains may owe capital-gains tax (a 1031 exchange can defer both). Figures are a year-1 estimate at your 24.0% rate — not tax advice; consult a CPA.
Condition & rehab AI · 1 photo
This property requires extensive repairs to its exterior, roof, and flooring, significantly impacting its value. Immediate attention is needed to stabilize the structure and improve its appearance.
Repairs flagged
- Major Exterior siding — Sections of siding are missing
- Major Roof — Shingles are missing
- Major Flooring — Debris suggests possible damage
Value-add opportunities
- Both Rebuild exterior siding — Improves curb appeal and structural integrity
- Both Replace roof shingles — Essential for structural integrity and water resistance
- Both Repair or replace flooring — Improves living space and safety
Renovation cost estimate screening
| Repair item | Severity | Est. cost |
|---|---|---|
| Exterior siding · Sections of siding are missing | Major | $15,000–50,000 |
| Roof · Shingles are missing | Major | $15,000–50,000 |
| Flooring · Debris suggests possible damage | Major | $15,000–50,000 |
| Total estimated repair cost · 3 items | $45,000–150,000 |
Value-add ROI direction
- Both Rebuild exterior siding — Improves curb appeal and structural integrity ↑
- Both Replace roof shingles — Essential for structural integrity and water resistance ↑
- Both Repair or replace flooring — Improves living space and safety ↑
ⓘ Cost ranges are severity-bucket heuristics (US national rule-of-thumb). Get contractor quotes + a written scope before underwriting a rehab budget.
Schools (NCES district)
- District
- Greene County School District
- NCES district ID
- 2801590
- Math proficiency
- 28% ▼ -13.00%
- Reading proficiency
- 34% ▼ -8.00%
- Median HH income
- $41,432
- Composite
- 26.2/100
- National rank
- #7264
- State rank
- #67 of 130 in MS
Livability — Leakesville
- Score
- 65/100
- State rank
- #109
- US rank
- #12647
Category grades
Schools grade is shown separately in the Schools card above.
Census & demographics
- Census place
- Leakesville, MS
- Population (ZIP)
- 7,957
Population outlook (Greene County) Hauer SSP2
- Today (2025)
- 12,029 people
- By 2030
- 11,879 · -1.2%
- By 2040
- 11,196 · -6.9%
- By 2050
- 10,455 · -13.1%
- By 2075
- 8,825 · -26.6%
- By 2100
- 7,172 · -40.4%
Race, ethnicity, and origin ACS 2023
- Neighborhood character
- Majority White (61%)
- Race & ethnicity
- White 61% Black 34% Two or more races 3% Native American 1%
- Common ancestry
- Slovak 2% Italian 2% Serbian 1%
- Foreign-born
- 0%
Political lean MEDSL · Greene
- 2024 margin
- Solid R (+69.8) · D 14.8% · R 84.5%
- 2008→2024 swing
- -18.0pp toward R · 2008: -51.7pp · 2024: -69.8pp
- All cycles
- 2024: R+69.8 2020: R+65.8 2016: R+63.0 2012: R+54.1 2008: R+51.7
Not yet ingested
- Civics
- —
Market trends
- HPI YoY
- ▲ 8.85%
- Current HPI
- 165.5757
- Rent YoY
- —
- Metro
- —
- State GDP YoY
- —
- F500 in state
- 0
Price history
-19.2% since first listed2 events — show timeline
- 2026-05-11 Price Changed $80,000 MLSU
- 2026-01-06 Listed $99,000 MLSU
Cash-flow waterfall
monthlySold comps — $/sqft
last 12 mo · ≤1 miLoading sold comps…