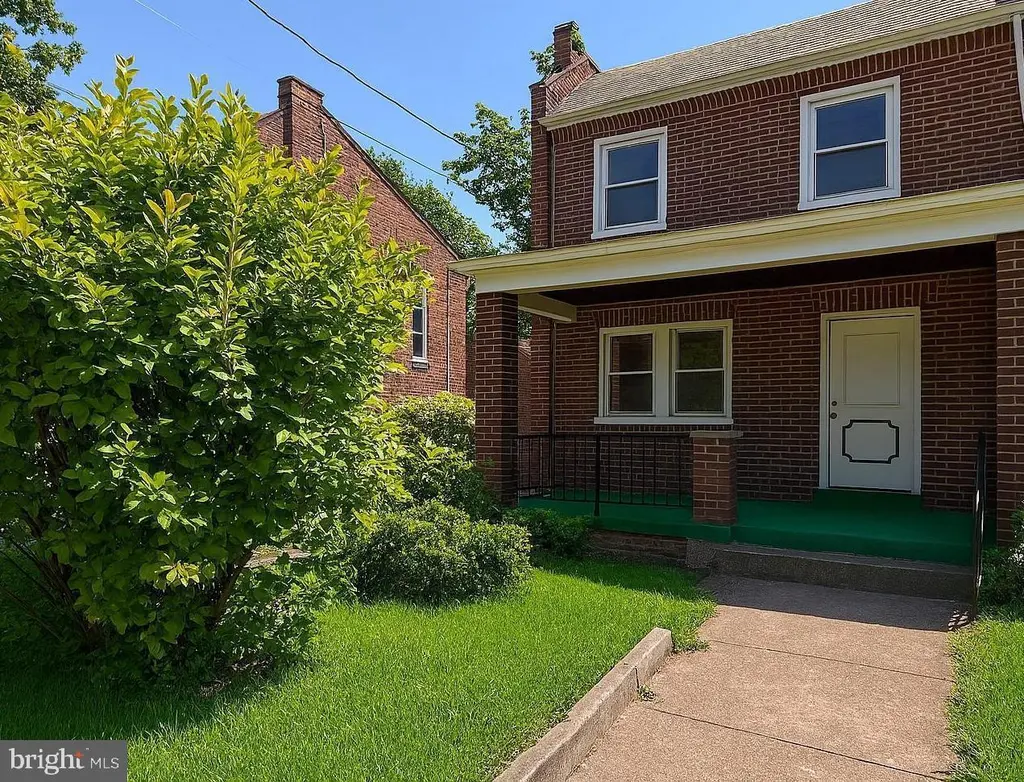
1510 Fort Davis Pl SE · Washington, DC
Flood risk 1/10 · Minimal
- FEMA flood zone
- X (unshaded)
- Chance of flooding over 30 yrs
- 0.0%
- Est. flood insurance / yr
- $473 – $860
Fire risk 2/10 · Minimal
- Est. fire insurance / yr
- $631 – $1,173
Heat risk 7/10 · Major
- Hot days now (above 104°F)
- 7 days/yr
- Hot days in 30 yrs
- 16 days/yr
Wind risk 4/10 · Minor
- Chance of severe wind over 30 yrs
- 21.0%
Air-quality risk 4/10 · Minor
- Unhealthy air days now
- 4 days/yr
- Unhealthy air days in 30 yrs
- 5 days/yr
Risk factors via First Street. Map © Google.
Why this score? — see what drove the D- grade
The composite is a weighted blend of 9 inputs, each scored 0–100. Each bar is that input's sub-score; the figure is the points it added to the 100-point composite (weight × sub-score).
- Cash flow +14.3/30.0
- DSCR +4.3/10.0
- Livability +3.7/5.0
- Schools +3.6/10.0
- Rent growth +3.5/5.0
- 1% rule +3.2/10.0
- Condition / age +2.5/5.0
- ARV discount +0.0/15.0
- Appreciation +0.0/10.0
$299,000
🖨 Deal sheet (PDF) 📄 Offer letter ✓ Due diligence
Listing remarks
Opportunity awaits at 1510 Fort Davis Place, SE—a partially renovated property ready for the next owner to bring their vision to life. The semidetached home is being sold as-is. This setup offers flexibility to customize finishes, fixtures, and design to suit your preferences or investment strategy. Ideal for homeowners looking to personalize or investors seeking value-add potential, this property presents a rare chance to own in an established neighborhood. Bring your contractor and imagination.
Key facts
- Built 1942
- Listed 43 days
Property features AI
Exterior
- Parking: On-street parking
- Utilities: Public water; No septic system (public sewer); Electric cooling; Natural gas heating and hot water
- Home design: End of row townhouse; Fee simple ownership; Estimated year built; major remodel effective 2025
- Construction: Brick construction; Other foundation type; Above-grade and below-grade structures; Below-grade finished area (398); Above-grade finished area (1,088)
- Exterior features: No tidal water
Interior
- Bedrooms: Three bedrooms on the first upper level
- Bathrooms: One full bathroom (on upper level); One half bathroom (on main level)
- Heating & cooling: Central heating (natural gas); Central air conditioning (electric); Natural gas hot water
- Interior features: Basement present (other type); Living area source: Assessor
Neighborhood map
What this means for you Summary
Snapshot
- This is a 3-bed/1.5-bath townhouse listed at $299k.
Deal economics
- At list price, monthly cash flow is $55 ($658/yr) — positive.
- The deal already cash-flows at list — no discount required.
- To meet the 1% rule (rent ≥ 1% of price), the offer needs to be $244k (18.5% below list).
- Recommended offer: $244k (18.5% below list) — sets the bar for 1% rule.
- Cap rate 6.5% vs local median 2.5% in Washington — top-decile yield for the area; either an underpriced asset or a hidden risk that comps aren't pricing in. Stress-test before assuming the spread holds.
Location & tenants
- Location reads 73/100 on livability (#1 in DC) — a middle-class / working-renter tenant base. Strengths: amenities A+, commute A+, employment A+; Watch: crime F, cost of living F.
- District Of Columbia Public Schools (urban): math 33% / reading 40% proficiency, ranked #8 of 32 in DC (top 25%) — families likely to look elsewhere, expect single-tenant / working-renter base with shorter leases; 65% free/reduced lunch — lower-income household profile, screen leases tightly.
- Market conditions: Rents rising (+3.9%/yr); 296 active listings in the ZIP; 40 comparable units currently listed for rent nearby; rentals at typical pace (median 23d on market — plan ~3-4 weeks tenant-placement turnaround); 1,737 units permitted in District of Columbia in 2024 (1,506 in 5+ unit buildings).
- At $2,438/mo this rent would consume 54% of the median local household income ($54k/yr) (locally 5148% of renters already pay >50% of income on rent) — very limited rent-growth headroom before tenants either downsize or default.
Forward outlook
- Local home prices are declining (-3.0%/yr); year-one equity from $2k of loan paydown is wiped out by about $9k of value loss. Plan a longer hold.
- District of Columbia County population projected at +50% by 2050 — long-run rental-demand tailwind backs the buy-and-hold thesis.
Negotiation context
- It's been on market 43 days — a 3% lower offer ($290k) is reasonable based on typical stale-listing flexibility.
Risks & watch-outs
- Watch-outs: built in 1942 — expect roof / HVAC / electrical / plumbing capex.
- Climate carrying-cost: extreme-heat days projected 7→16/yr by 2055 (HVAC capex compounding) — expect insurance premiums to compound above CPI over the hold.
Questions for the listing agent
- It's been on market 43 days. Have you received any prior offers? Is the seller open to a 18% concession, seller financing, or rate buy-down credit?
- Built in 1942 — when were the roof, HVAC, electrical panel, plumbing, and water heater last replaced?
- Is there a deadline driving the sale (1031 exchange, divorce, estate, relocation)? That informs how much negotiation room exists.
- Crime grade is F in this area — have there been break-ins, vandalism, or insurance claims at this property in the last 3 years? What carrier currently insures it and at what premium?
- The area grade is low — what's the realistic commute time and amenity access for the typical tenant pool here? Any planned neighborhood developments (good or bad) we should know about?
- What's the average days-on-market for RENTAL listings here right now (not sales)? A rising rental-DOM trend means longer vacancies and softer asking-rent achievability than the comps imply.
- What's the recent tenant-quality profile in this submarket — average credit score on applications, eviction rate, late-payment / NSF rate, and stable-employment percentage? A property-management company in the area should have these aggregated.
- How much new for-sale + rental construction is in the pipeline within 1–3 miles? Heavy new supply typically softens prices + rents 12–24 months out; constrained supply supports both.
Investment metrics
- 1% rule
- 0.82% ✗
- Cap rate
- 6.51%
- Cash-on-cash
- 0.79%
- DSCR
- 1.03
- GRM
- 10.2
CMA / ARV
- ARV (on-the-fly)
- $233,920
- Comps found
- 12
Show comp detail 12 sales within ~0.75 mi
| Address | Dist | Beds/Ba | Sqft | Sold | Price | $/sf | Match |
|---|---|---|---|---|---|---|---|
| 3973 Alabama Ave SE | 0.16mi | 4/2.5 (+1) | 1,088 (0%) | 3mo | $475,000 | $437 | 81 |
| 3959 R St SE | 0.21mi | 3/1.5 | 1,056 (-3%) | 9mo | $240,000 | $227 | 78 |
| 1541 41st St SE | 0.11mi | 3/2.0 | 1,024 (-6%) | 7mo | $360,000 | $352 | 77 |
| 1807 Fort Davis St SE | 0.29mi | 3/1.0 | 1,155 (+6%) | 0mo | $230,000 | $199 | 74 |
| 3918 Stone Gate Dr Unit D | 0.50mi | 3/1.5 | 1,031 (-5%) | 9mo | $169,000 | $164 | 60 |
| 3906 Southern Ave SE Unit A | 0.44mi | 3/2.0 | 1,200 (+10%) | 0mo | $190,000 | $158 | 60 |
| 2019 38th St SE Unit B | 0.47mi | 2/1.0 (-1) | 1,153 (+6%) | 9mo | $244,000 | $212 | 54 |
| 3705 Alabama Ave SE Unit A | 0.49mi | 2/1.0 (-1) | 1,030 (-5%) | 10mo | $220,000 | $214 | 53 |
| 4263 Hildreth St SE | 0.71mi | 2/1.5 (-1) | 1,045 (-4%) | 3mo | $225,000 | $215 | 53 |
| 4244 Hildreth St SE | 0.72mi | 2/1.0 (-1) | 1,151 (+6%) | 4mo | $320,000 | $278 | 46 |
| 2030 37th St SE Unit B | 0.54mi | 2/1.0 (-1) | 1,225 (+13%) | 9mo | $185,000 | $151 | 39 |
| 4243 Hildreth St SE | 0.70mi | 3/2.0 | 1,248 (+15%) | 4mo | $419,000 | $336 | 38 |
Match score weights: distance 35% · size 25% · config 20% · recency 20%. Top-matched comps best support the ARV.
Projected returns pro-forma
-3.0% appreciation · 3.86% rent growth · sell at horizon
- IRR
- -14.2%
- Equity multiple
- 0.49×
- Total profit
- $-42,915
- Equity at exit
- $44,582
- IRR
- -4.3%
- Equity multiple
- 0.71×
- Total profit
- $-24,325
- Equity at exit
- $25,852
Cash invested: $83,720 (down + closing). Projections, not guarantees.
Landlord ↔ Tenant lean methodology
- Overall (CITY)
- 0 Strongly Tenant-Friendly
- State District of Columbia
- 12 Strongly Tenant-Friendly · D+43
- County
- — inherits STATE
- City Washington
- 0 Strongly Tenant-Friendly · D+43
ZIP-level market 20020
- Rents YoY
- 3.9%
- Active inventory
- 296
- Price-to-rent
- 10.2×
Monthly cashflow live
- Estimated rent
- $2,438 high interval (Pro) →
- Mortgage (P&I)
- −$1,568
- Tax from tax record
- −$179 /mo · $2,147/yr
- Insurance
- −$125
- HOA
- −$0
- Vacancy / Maint / Mgmt
- −$512
- Net cashflow
- $55
Break-even live
Sensitivity live
| Price | -10% $224 | -5% $139 | +0% $55 | +5% $-30 | +10% $-114 |
|---|---|---|---|---|---|
| Rent | -10% $-138 | -5% $-41 | +0% $55 | +5% $151 | +10% $247 |
| Rate | -1.0pp $205 | -0.5pp $131 | base $55 | +0.5pp $-23 | +1.0pp $-101 |
UW: 25.0% down · 7.5% · 30yr · 1.5% tax · 5.0% vac · 8.0% maint · 8.0% mgmt
Financing live
Cash to close
- Down payment
- $74,750
- Closing costs
- $8,970
- Reserves months
- —
- Total cash needed
- —
Loan-product check · same deal, 3 products live
Conventional
25% down · 7.5% · 30yr
- Down + closing
- —
- Monthly P&I
- —
- Monthly cashflow
- —
- DSCR
- —
- Eligible?
- —
Personal DTI + credit; lowest rate.
DSCR
20% down · 8.5% · 30yr
- Down + closing
- —
- Monthly P&I
- —
- Monthly cashflow
- —
- DSCR
- —
- Eligible?
- —
No personal income docs; deal must DSCR.
Hard money
10% down · 12.0% · 12mo
- Down + closing
- —
- Monthly P&I
- —
- Monthly cashflow
- —
- DSCR
- —
- Eligible?
- —
Short-term bridge; refi at stabilization.
Rent comps 40 comps
| Address | Beds | Baths | Sqft | Rent | $/sqft | DOM | Units | Dist |
|---|---|---|---|---|---|---|---|---|
| 1559 41st St SE Unit 1546448P Washington, DC | 4.0 | 2.0 | 1022 | $2,926 | $2.86 | 8d | 1 | 0.14mi |
| 4113 Southern Ave SE Capitol Heights, MD | 3.0 | 1.0–1.5 | 816 | $1,950 | $2.39 | 0d | 48 | 0.22mi |
| 3935 S St SE #304 Washington, DC | 2.0 | 1.0 | 735 | $2,500 | $3.40 | 25d | 1 | 0.23mi |
| 3937 S St SE #108 Washington, DC | 2.0 | 1.0 | 751 | $1,750 | $2.33 | 8d | 1 | 0.23mi |
| 3915 Pennsylvania Ave SE Washington, DC | 2.0 | 1.0 | 782 | $2,500 | $3.20 | 25d | 1 | 0.30mi |
| 3930 Suitland Rd Suitland, MD | 1.0–2.0 | 1.0 | 772 | $1,650 | $2.14 | 0d | 28 | 0.44mi |
| 3930 Stone Gate Dr Suitland, MD | 2.0 | 1.0 | 1050 | $1,750 | $1.67 | 44d | 1 | 0.46mi |
| 3936 Stone Gate Dr Unit D Suitland, MD | 2.0 | 1.0 | 870 | $1,800 | $2.07 | 13d | 1 | 0.46mi |
| 3928 Stone Gate Dr Unit D Suitland, MD | 3.0 | 1.5 | 1031 | $1,700 | $1.65 | 19d | 1 | 0.47mi |
| 4348 Southern Ave SE Washington, DC | 3.0 | 1.0 | 860 | $2,400 | $2.79 | 19d | 1 | 0.55mi |
| 3901 Suitland Rd Suitland, MD | 1.0–2.0 | 1.0 | 816 | $1,555 | $1.90 | 0d | 9 | 0.56mi |
| 4308 Alton St Capitol Heights, MD | 3.0 | 2.0 | 1100 | $2,500 | $2.27 | 44d | 1 | 0.69mi |
| 2112 34th St SE Washington, DC | 2.0 | 1.5 | 1284 | $3,300 | $2.57 | 25d | 1 | 0.71mi |
| 4213 Hildreth St SE Washington, DC | 2.0 | 1.5 | 832 | $2,500 | $3.00 | 25d | 1 | 0.71mi |
| 812 Burns St SE Washington, DC | 3.0 | 2.5 | 1280 | $3,300 | $2.58 | 25d | 1 | 0.77mi |
| 4110 Suitland Rd Suitland, MD | 1.0–3.0 | 1.0–2.0 | 967 | $2,377 | $2.46 | 0d | 11 | 0.84mi |
| 4318 G St SE Washington, DC | 2.0 | 2.5 | 1376 | $2,500 | $1.82 | 19d | 1 | 0.89mi |
| 4632 Hillside Rd SE Unit 1 Washington, DC | 4.0 | 2.0 | 1222 | $3,000 | $2.45 | 25d | 1 | 0.93mi |
| 4332 Gorman Ter SE Washington, DC | 2.0 | 1.0 | 832 | $2,350 | $2.82 | 22d | 1 | 0.94mi |
| 1201 Benning Rd Capitol Heights, MD | 1.0–3.0 | 1.0 | 854 | $2,090 | $2.45 | 0d | 42 | 0.94mi |
| 4648 Hillside Rd SE Apt 1 Washington, DC | 4.0 | 2.0 | 1389 | $4,200 | $3.02 | 25d | 1 | 0.96mi |
| 2217 Gaylord Dr Suitland, MD | 3.0 | 1.0 | 1216 | $2,450 | $2.01 | 5d | 1 | 0.96mi |
| 608 Chaplin St SE Washington, DC | 3.0 | 2.0 | 832 | $2,200 | $2.64 | 18d | 1 | 0.98mi |
| 4601 Pistachio Ln Capitol Heights, MD | 3.0 | 2.5 | 1376 | $2,795 | $2.03 | 17d | 1 | 1.01mi |
| 1193 46th Pl SE Washington, DC | 3.0 | 1.0 | 1056 | $3,200 | $3.03 | 25d | 1 | 1.01mi |
| 5037 Benning Rd SE Washington, DC | 3.0 | 2.0 | 1184 | $3,100 | $2.62 | 25d | 1 | 1.02mi |
| 21 Randle Cir SE Washington, DC | 2.0 | 1.0 | 1100 | $2,477 | $2.25 | 25d | 1 | 1.04mi |
| 1210 Balboa Ave Unit B Capitol Heights, MD | 2.0 | 1.0 | 858 | $1,095 | $1.28 | 44d | 1 | 1.04mi |
| 2301 Houston St Suitland, MD | 3.0 | 1.0 | 1216 | $2,200 | $1.81 | 22d | 1 | 1.05mi |
| 2232 Houston St Suitland, MD | 3.0 | 1.0 | 1216 | $2,500 | $2.06 | 44d | 1 | 1.06mi |
| 2925-2929 Pennsylvania Ave SE Unit 204 Washington, DC | 3.0 | 1.0 | 980 | $3,000 | $3.06 | 4d | 1 | 1.06mi |
| 2925-2929 Pennsylvania Ave SE Unit 106 Washington, DC | 4.0 | 1.0 | 988 | $4,200 | $4.25 | 25d | 1 | 1.06mi |
| 2925-2929 Pennsylvania Ave SE Unit 106 Washington, DC | 4.0 | 1.0 | 980 | $4,200 | $4.29 | 4d | 1 | 1.06mi |
| 1707 29th St SE Unit 2 Washington, DC | 2.0 | 1.0 | 1200 | $2,350 | $1.96 | 3d | 1 | 1.09mi |
| 1800 28th Pl SE #201 Washington, DC | 3.0 | 2.0 | 1132 | $2,800 | $2.47 | 3d | 1 | 1.10mi |
| 1111 Balboa Ave Capitol Heights, MD | 3.0 | 1.0 | 864 | $2,000 | $2.31 | 19d | 1 | 1.11mi |
| 2821 R St SE Washington, DC | 2.0 | 1.0 | 853 | $1,650 | $1.93 | 25d | 1 | 1.11mi |
| 2801 R St SE Unit 2 Washington, DC | 2.0 | 1.0 | 700 | $1,569 | $2.24 | 25d | 1 | 1.17mi |
| 2621 30th St SE Unit 1 Washington, DC | 2.0 | 1.0 | 800 | $1,750 | $2.19 | 25d | 1 | 1.18mi |
| 3738 D St SE Washington, DC | 1.0–2.0 | 1.0 | 542 | $1,549 | $2.86 | 8d | 12 | 1.19mi |
Listing history 16 events
-
2026-06-18days on market $299,000 Active 43 DOM
-
2026-06-17days on market $299,000 Active 42 DOM
-
2026-06-16days on market $299,000 Active 41 DOM
-
2026-06-15days on market $299,000 Active 40 DOM
-
2026-06-13days on market $299,000 Active 38 DOM
-
2026-06-09days on market $299,000 Active 34 DOM
-
2026-06-08days on market $299,000 Active 33 DOM
-
2026-06-07days on market $299,000 Active 32 DOM
-
2026-06-04days on market $299,000 Active 29 DOM
-
2026-06-03days on market $299,000 Active 28 DOM
-
2026-06-02days on market $299,000 Active 27 DOM
-
2026-06-01days on market $299,000 Active 26 DOM
-
2026-05-31days on market $299,000 Active 25 DOM
-
2026-05-06$299,000 Active
-
2026-03-18historical
-
2026-03-05historical
ⓘ Source: listings_history table (triggers on properties + properties_extension) + one-shot
backfill from property_details.listing_events for pre-trigger history.
Tax reassessment forecast DC · Partial reset (capped growth)
- Current annual tax
- $2,147 · $179/mo
- Projected year-2 tax
- $2,147 · $179/mo
- Expected delta
- $0/yr ($0/mo · 0.0%)
ⓘ Screening estimate from a state-policy table — verify with the county assessor before closing.
Climate risk First Street
- Flood 1/10 Low FEMA zone X (unshaded) · 0% chance over 30 yrs
- Wildfire 2/10 Low
- Heat 7/10 Severe 7 d/yr ≥104°F today · 16 d/yr by 30 yrs out
- Wind 4/10 Moderate 21% chance of damaging wind over 30 yrs
- Air quality 4/10 Moderate 4 unhealthy d/yr today · 5 by 30 yrs out
Nearby sold comps map
Loading sold comps map…
Walkable amenities ~0.75 mi
Loading nearby amenities…
Taxation est. · year 1
- Rental income
- $29,260
- − Mortgage interest
- −$16,749
- − Property taxes
- −$2,147
- − Insurance
- −$1,495
- − Repairs & maintenance
- −$2,341
- − Management
- −$2,341
- − Depreciation
- −$8,698
- Taxable loss
- −$4,510
- Est. tax savings @ 24.0%
- +$1,082
- After-tax cash flow
- $1,740/yr
For passive investors: Depreciation is non-cash, so a rental often shows a tax loss while cash-flowing — sheltering income. Rental losses are passive: they offset passive income freely, and up to $25,000/yr can offset ordinary (W-2) income if you actively participate and your MAGI is under $100k (phasing out to $0 by $150k); unused losses carry forward. On sale, claimed depreciation is recaptured at up to 25%, and gains may owe capital-gains tax (a 1031 exchange can defer both). Figures are a year-1 estimate at your 24.0% rate — not tax advice; consult a CPA.
Schools (NCES district)
- District
- District Of Columbia Public Schools
- NCES district ID
- 1100030
- Math proficiency
- 33% ▲ 3.00%
- Reading proficiency
- 40% ▲ 5.00%
- Median HH income
- $67,671
- Composite
- 35.84/100
- National rank
- #9606
- State rank
- #8 of 32 in DC
Livability — Washington
- Score
- 73/100
- State rank
- #1
- US rank
- #5327
Category grades
Schools grade is shown separately in the Schools card above.
Census & demographics
- Census place
- Washington, DC
- County
- District of Columbia · 671,873 people
- City population
- 671,873
- Metro
- Washington-Arlington-Alexandria, DC-VA-MD-WV
- Population (ZIP)
- 53,005
- Household income
- $54,032
- Rent vs Own
- Severe rent burden
- 5148.0
Population outlook (District of Columbia County) Hauer SSP2
- Today (2025)
- 821,926 people
- By 2030
- 899,517 · +9.4%
- By 2040
- 1,061,162 · +29.1%
- By 2050
- 1,231,493 · +49.8%
- By 2075
- 1,603,312 · +95.1%
- By 2100
- 1,847,141 · +124.7%
Race, ethnicity, and origin ACS 2023
- Neighborhood character
- Predominantly Black (90%)
- Race & ethnicity
- Black 90% Two or more races 3% Hispanic / Latino 3% White 3%
- Common ancestry
- Lithuanian 1%
- Foreign-born
- 3% · Canada
- Languages at home
- 95% English-only · Spanish 2% French/Haitian/Cajun 1%
Political lean MEDSL · District of Columbia
- 2024 margin
- Solid D (+86.1) · D 91.2% · R 5.1% · Other 3.8%
- 2008→2024 swing
- +0.1pp no change · 2008: 85.9pp · 2024: 86.1pp
- All cycles
- 2024: D+86.1 2020: D+86.8 2016: D+88.7 2012: D+84.2 2008: D+85.9
Not yet ingested
- Civics
- —
Market trends
- HPI YoY
- ▼ -415.44%
- Current HPI
- 306.5068
- Rent YoY
- ▲ 3.86%
- Metro
- Washington-Arlington-Alexandria, DC-VA-MD-WV
- State GDP YoY
- ▲ 1.33%
- F500 in state
- 6
Industry mix (Fortune 500 HQ in DC)
| Industry | F500 HQs | Revenue |
|---|---|---|
| Financial Services | 1 | $153B |
|
||
| Life Sciences / Industrials | 1 | $25B |
|
||
| Industrial Machinery | 1 | $8B |
|
||
Price history
3 events — show timeline
- 2026-05-06 Listed $299,000 BRIGHT MLS
- 2026-03-18 Listing Removed — BRIGHT MLS
- 2026-03-05 Coming Soon — BRIGHT MLS
Property tax history
+6.4%/yrLatest (2025): $2,147 · +1.3% YoY. Source: county tax records.
Cash-flow waterfall
monthlySold comps — $/sqft
last 12 mo · ≤1 miLoading sold comps…