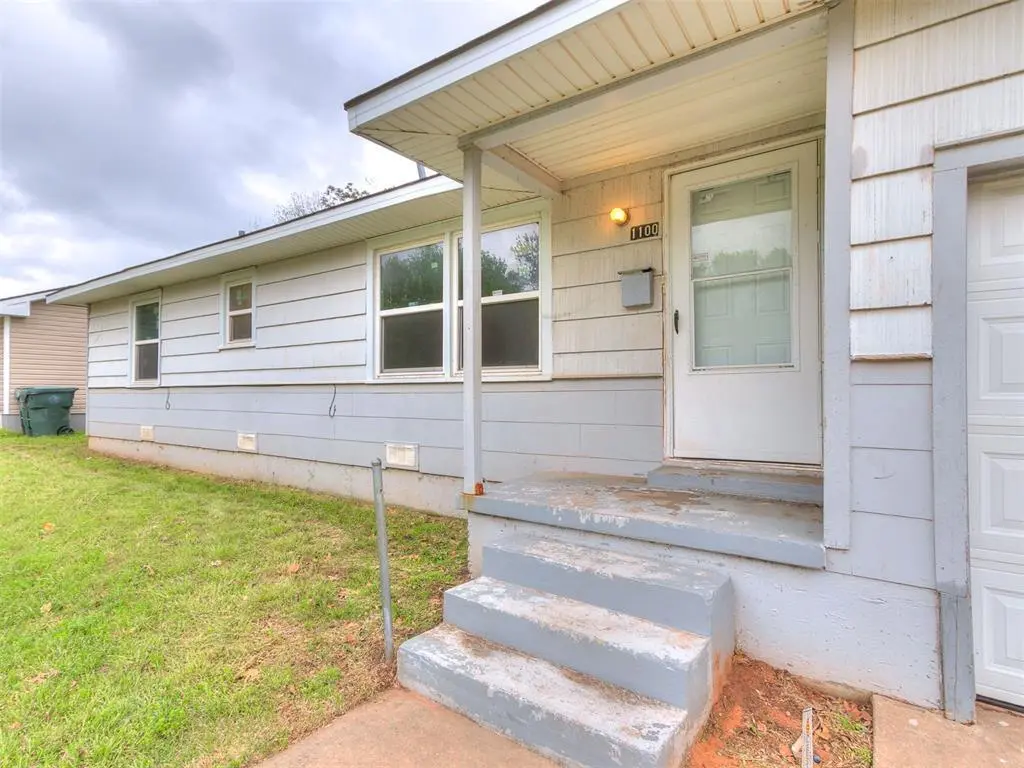
1100 Sycamore Dr · Midwest City, OK
Flood risk 1/10 · Minimal
- FEMA flood zone
- X (unshaded)
- Chance of flooding over 30 yrs
- 0.0%
- Est. flood insurance / yr
- $507 – $1,088
Fire risk 1/10 · Minimal
- Est. fire insurance / yr
- $2,463 – $4,575
Heat risk 6/10 · Moderate
- Hot days now (above 107°F)
- 7 days/yr
- Hot days in 30 yrs
- 19 days/yr
Wind risk 2/10 · Minimal
- Chance of severe wind over 30 yrs
- 4.0%
Air-quality risk 2/10 · Minimal
- Unhealthy air days now
- 1 days/yr
- Unhealthy air days in 30 yrs
- 2 days/yr
Risk factors via First Street. Map © Google.
Why this score? — see what drove the C+ grade
The composite is a weighted blend of 9 inputs, each scored 0–100. Each bar is that input's sub-score; the figure is the points it added to the 100-point composite (weight × sub-score).
- Cash flow +25.3/30.0
- ARV discount +14.1/15.0
- DSCR +8.3/10.0
- 1% rule +6.6/10.0
- Livability +3.6/5.0
- Rent growth +3.2/5.0
- Condition / age +2.5/5.0
- Schools +0.7/10.0
- Appreciation +0.0/10.0
$100,000
🖨 Deal sheet (PDF) 📄 Offer letter ✓ Due diligence
Listing remarks MLS
This 3-bedroom home in Midwest City offers the perfect chance to buy your first home, or add to your investment portfolio. Featuring a brand-new hot water tank, this property is already off to a strong start and is ready to be made your own with cosmetic updates or a renovation vision. With a functional layout and plenty of potential, this is an excellent investment opportunity for flippers, landlords, or anyone looking to expand their rental portfolio. The home sits in a convenient location close to shopping, dining, Tinker AFB, and major highways, making it attractive for future tenants or resale. Set your showing today!
Key facts
- Hot water tank
- Close to tinker afb
- Close to dining
Tags
Neighborhood map
What this means for you Summary
Snapshot
- This is a 3-bed/1.0-bath single-family listed at $100k.
Deal economics
- At list price, monthly cash flow is $226 ($3k/yr) — positive.
- The deal already cash-flows at list — no discount required.
- Meets the 1% rule at list price ($1k rent vs $100k).
- Recommended offer: $97k (3.0% below list) — sets the bar for market timing.
- Cap rate 9.0% vs local median 5.6% in Midwest City — top-decile yield for the area; either an underpriced asset or a hidden risk that comps aren't pricing in. Stress-test before assuming the spread holds.
Location & tenants
- Location reads 71/100 on livability (#30 in OK) — a middle-class / working-renter tenant base. Strengths: cost of living A+, housing A+, health & safety A; Watch: crime D+, employment D, amenities F.
- Oklahoma City (urban): math 7% / reading 10% proficiency, ranked #254 of 270 in OK (top 94%) — low school quality limits family demand, transient renter base, plan for 1-2y turnover; 82% free/reduced lunch — lower-income household profile, screen leases tightly.
- Zoned schools: Willow Brook Es (346 students, 0% FRL); Classen Ms of Advanced Studies (math 35% / reading 46%, grade F, #6 of 345 statewide, top 1%, 855 students, 0% FRL); Southeast Hs (math 8% / reading 17%, grade F, #355 of 447 statewide, top 80%, 854 students, 0% FRL) — zoned schools average 0% FRL vs 82% district-wide (82 pts lower); this property's tenant base skews higher-income than the district average.
- Zoned-school proficiency averages 26% at this address vs 8% district-wide (+18 pts) — the actual schools serving this property are materially stronger than the Oklahoma City average implies; a family-tenant draw the district grade alone would hide.
- Market conditions: Rents rising (+3.0%/yr); 173 active listings in the ZIP; 40 comparable units currently listed for rent nearby; rentals at typical pace (median 18d on market — plan ~3-4 weeks tenant-placement turnaround); 5,365 units permitted in Oklahoma County in 2024 (569 in 5+ unit buildings).
Forward outlook
- Local home prices are declining (-3.0%/yr); year-one equity from $691 of loan paydown is wiped out by about $3k of value loss. Plan a longer hold.
- Oklahoma County population projected at +41% by 2050 — long-run rental-demand tailwind backs the buy-and-hold thesis.
Negotiation context
- It's been on market 37 days — a 3% lower offer ($97k) is reasonable based on typical stale-listing flexibility.
- 5 sale attempts since 26y ago; this cycle's ask has dropped $10k (9%) from the opening price — seller is motivated, your offer sets the floor, not the list.
- Current owner paid $45k; list at $100k implies a 123% gain — meaningful room to come down on a strong offer.
Risks & watch-outs
- Watch-outs: built in 1956 — expect roof / HVAC / electrical / plumbing capex.
- Climate carrying-cost: extreme-heat days projected 7→19/yr by 2055 (HVAC capex compounding) — expect insurance premiums to compound above CPI over the hold.
Questions for the listing agent
- It's been on market 37 days. Have you received any prior offers? Is the seller open to a 3% concession, seller financing, or rate buy-down credit?
- Built in 1956 — when were the roof, HVAC, electrical panel, plumbing, and water heater last replaced?
- Is there a deadline driving the sale (1031 exchange, divorce, estate, relocation)? That informs how much negotiation room exists.
- Schools are D-rated, which usually means shorter tenancies and higher turnover. Who's the typical renter profile here, and what's been the actual vacancy rate?
- Crime grade is D in this area — have there been break-ins, vandalism, or insurance claims at this property in the last 3 years? What carrier currently insures it and at what premium?
- What's the average days-on-market for RENTAL listings here right now (not sales)? A rising rental-DOM trend means longer vacancies and softer asking-rent achievability than the comps imply.
- What's the recent tenant-quality profile in this submarket — average credit score on applications, eviction rate, late-payment / NSF rate, and stable-employment percentage? A property-management company in the area should have these aggregated.
- How much new for-sale + rental construction is in the pipeline within 1–3 miles? Heavy new supply typically softens prices + rents 12–24 months out; constrained supply supports both.
Investment metrics
- 1% rule
- 1.16% ✓
- Cap rate
- 9.01%
- Cash-on-cash
- 9.71%
- DSCR
- 1.43
- GRM
- 7.2
CMA / ARV
- ARV (median comp)
- $117,058
- List price
- $100,000
- Delta
- -14.57%
- Verdict
- UNDERPRICED
- Comps
- 20 within 1.0 mi
Show comp detail 12 sales within ~0.75 mi
| Address | Dist | Beds/Ba | Sqft | Sold | Price | $/sf | Match |
|---|---|---|---|---|---|---|---|
| 1100 Sycamore Dr | 0.00mi | 3/1.0 | 858 (0%) | 0mo | $70,000 | $82 | 100 |
| 1029 Hickory Ln | 0.06mi | 3/1.0 | 858 (0%) | 1mo | $110,000 | $128 | 96 |
| 1125 Jasmine Ln | 0.17mi | 3/1.0 | 858 (0%) | 1mo | $120,000 | $140 | 92 |
| 1116 Hickory Ln | 0.07mi | 3/1.0 | 882 (+3%) | 1mo | $70,000 | $79 | 91 |
| 3304 Woodside Dr | 0.13mi | 3/1.0 | 858 (0%) | 7mo | $110,000 | $128 | 89 |
| 3508 N Holman Ct | 0.23mi | 3/1.0 | 858 (0%) | 3mo | $127,000 | $148 | 87 |
| 1312 Hickory Ln | 0.16mi | 3/1.0 | 902 (+5%) | 2mo | $153,000 | $170 | 82 |
| 1000 N Locust Ln | 0.28mi | 3/1.0 | 916 (+7%) | 2mo | $126,000 | $138 | 74 |
| 3905 Parkwoods Ln | 0.24mi | 3/1.5 | 942 (+10%) | 1mo | $90,000 | $96 | 70 |
| 1024 Locust Dr | 0.22mi | 3/2.0 | 932 (+9%) | 3mo | $155,000 | $166 | 68 |
| 1033 Holly Ln | 0.20mi | 3/1.0 | 972 (+13%) | 5mo | $109,500 | $113 | 64 |
| 4312 Bonaparte Blvd | 0.61mi | 3/2.0 | 876 (+2%) | 6mo | $142,500 | $163 | 59 |
Match score weights: distance 35% · size 25% · config 20% · recency 20%. Top-matched comps best support the ARV.
Projected returns pro-forma
-3.0% appreciation · 2.99% rent growth · sell at horizon
- IRR
- -1.7%
- Equity multiple
- 0.94×
- Total profit
- $-1,774
- Equity at exit
- $14,910
- IRR
- 8.0%
- Equity multiple
- 1.61×
- Total profit
- $17,053
- Equity at exit
- $8,646
Cash invested: $28,000 (down + closing). Projections, not guarantees.
Landlord ↔ Tenant lean methodology
- Overall (STATE)
- 83 Strongly Landlord-Friendly
- State Oklahoma
- 83 Strongly Landlord-Friendly · R+20
- County
- — inherits STATE
- City
- — inherits STATE
ZIP-level market 73110
- Rents YoY
- 3.0%
- Active inventory
- 173
- Price-to-rent
- 7.2×
Monthly cashflow live
- Estimated rent
- $1,161 high interval (Pro) →
- Mortgage (P&I)
- −$524
- Tax est. 1.5%
- −$125 /mo · $1,500/yr
- Insurance
- −$42
- HOA
- −$0
- Vacancy / Maint / Mgmt
- −$244
- Net cashflow
- $226
Break-even live
Sensitivity live
| Price | -10% $296 | -5% $261 | +0% $226 | +5% $192 | +10% $157 |
|---|---|---|---|---|---|
| Rent | -10% $135 | -5% $181 | +0% $226 | +5% $272 | +10% $318 |
| Rate | -1.0pp $277 | -0.5pp $252 | base $226 | +0.5pp $201 | +1.0pp $174 |
UW: 25.0% down · 7.5% · 30yr · 1.5% tax · 5.0% vac · 8.0% maint · 8.0% mgmt
Financing live
Cash to close
- Down payment
- $25,000
- Closing costs
- $3,000
- Reserves months
- —
- Total cash needed
- —
Loan-product check · same deal, 3 products live
Conventional
25% down · 7.5% · 30yr
- Down + closing
- —
- Monthly P&I
- —
- Monthly cashflow
- —
- DSCR
- —
- Eligible?
- —
Personal DTI + credit; lowest rate.
DSCR
20% down · 8.5% · 30yr
- Down + closing
- —
- Monthly P&I
- —
- Monthly cashflow
- —
- DSCR
- —
- Eligible?
- —
No personal income docs; deal must DSCR.
Hard money
10% down · 12.0% · 12mo
- Down + closing
- —
- Monthly P&I
- —
- Monthly cashflow
- —
- DSCR
- —
- Eligible?
- —
Short-term bridge; refi at stabilization.
Rent comps 40 comps
| Address | Beds | Baths | Sqft | Rent | $/sqft | DOM | Units | Dist |
|---|---|---|---|---|---|---|---|---|
| 3609 Woodside Dr Midwest City, OK | 3.0 | 1.0 | 858 | $995 | $1.16 | 4d | 1 | 0.07mi |
| 3513 Parkwoods Ln Oklahoma City, OK | 3.0 | 1.5 | 903 | $1,150 | $1.27 | 45d | 1 | 0.09mi |
| 3512 N Holman Ct Oklahoma City, OK | 3.0 | 2.0 | 1092 | $1,275 | $1.17 | 4d | 1 | 0.25mi |
| 3413 Willow Creek Dr Oklahoma City, OK | 3.0 | 1.0 | 872 | $975 | $1.12 | 4d | 1 | 0.32mi |
| 3409 Willow Creek Dr Oklahoma City, OK | 3.0 | 1.0 | 932 | $1,050 | $1.13 | 25d | 1 | 0.32mi |
| 3512 Brookside Dr Oklahoma City, OK | 4.0 | 2.0 | 763 | $1,595 | $2.09 | 3d | 1 | 0.35mi |
| 4033 S Locust Dr Oklahoma City, OK | 2.0 | 1.0 | 800 | $900 | $1.12 | 25d | 1 | 0.39mi |
| 1014 Spencer Rd Oklahoma City, OK | 2.0 | 2.0 | 800 | $1,000 | $1.25 | 45d | 1 | 0.44mi |
| 1020 N Spencer Rd Oklahoma City, OK | 2.0 | 1.0 | 962 | $895 | $0.93 | 25d | 1 | 0.46mi |
| 8511 Justin Pl Oklahoma City, OK | 2.0 | 1.0 | 962 | $950 | $0.99 | 16d | 1 | 0.50mi |
| 8910 Oak Valley Dr Oklahoma City, OK | 2.0 | 2.0 | 935 | $1,000 | $1.07 | 21d | 1 | 0.51mi |
| 8517 E Reno Ave Oklahoma City, OK | 1.0–2.0 | 1.0–2.0 | 837 | $859 | $1.03 | 5d | 1 | 0.53mi |
| 1008 Willow Brook Dr Oklahoma City, OK | 3.0 | 1.5 | 1045 | $1,125 | $1.08 | 25d | 1 | 0.55mi |
| 327 N Midwest Blvd Unit 205 Midwest City, OK | 2.0 | 1.0 | 920 | $900 | $0.98 | 25d | 1 | 0.56mi |
| 8717 Saint George Way Oklahoma City, OK | 2.0 | 2.0 | 1075 | $1,150 | $1.07 | 25d | 1 | 0.58mi |
| 8801 Saint George Way Oklahoma City, OK | 3.0 | 2.0 | 1122 | $1,175 | $1.05 | 25d | 1 | 0.64mi |
| 8801 Saint George Way Oklahoma City, OK | 3.0 | 2.0 | 1122 | $1,175 | $1.05 | 12d | 1 | 0.64mi |
| 7801 NE 10th St Oklahoma City, OK | 1.0–3.0 | 1.0–2.5 | 940 | $1,199 | $1.28 | 3d | 23 | 0.76mi |
| 801 Meadowridge Dr Oklahoma City, OK | 3.0 | 1.5 | 1095 | $1,095 | $1.00 | 45d | 1 | 0.76mi |
| 8032 E Reno Ave Oklahoma City, OK | 1.0–2.0 | 1.0 | 770 | $850 | $1.10 | 4d | 3 | 0.77mi |
| 721 E Bouse Dr Oklahoma City, OK | 3.0 | 1.0 | 1002 | $1,225 | $1.22 | 4d | 1 | 0.81mi |
| 1168 N Douglas Blvd Oklahoma City, OK | 1.0–2.0 | 1.0 | 725 | $1,020 | $1.41 | 18d | 1 | 0.81mi |
| 1312 N Midwest Blvd Oklahoma City, OK | 3.0 | 1.5 | 946 | $970 | $1.03 | 4d | 1 | 0.82mi |
| 1632 N Spencer Rd Oklahoma City, OK | 2.0 | 1.0 | 772 | $895 | $1.16 | 16d | 1 | 0.88mi |
| 1401 N Midwest Blvd Midwest City, OK | 3.0 | 2.0 | 1087 | $1,000 | $0.92 | 4d | 1 | 0.91mi |
| 1401 N Midwest Blvd Unit 112 Midwest City, OK | 2.0 | 1.0 | 970 | $940 | $0.97 | 5d | 1 | 0.93mi |
| 1401 N Midwest Blvd Apt 255 Midwest City, OK | 2.0 | 1.0 | 970 | $940 | $0.97 | 21d | 1 | 0.93mi |
| 1401 N Midwest Blvd Unit 167 Midwest City, OK | 3.0 | 2.0 | 1087 | $1,000 | $0.92 | 5d | 1 | 0.93mi |
| 1401 N Midwest Blvd Midwest City, OK | 1.0–3.0 | 1.0–2.0 | 803 | $1,000 | $1.25 | 13d | 34 | 0.95mi |
| 1401 N Midwest Blvd Midwest City, OK | 3.0 | 2.0 | 1087 | $1,000 | $0.92 | 21d | 1 | 0.95mi |
| 1401 N Midwest Blvd Midwest City, OK | 3.0 | 2.0 | 1087 | $1,000 | $0.92 | 25d | 1 | 0.95mi |
| 641 E Frolich Dr Oklahoma City, OK | 3.0 | 1.5 | 1032 | $975 | $0.94 | 25d | 1 | 0.95mi |
| 1400 Marydale Ave Oklahoma City, OK | 3.0 | 1.0 | 1082 | $1,150 | $1.06 | 17d | 1 | 1.06mi |
| 121 Gill Dr Oklahoma City, OK | 3.0 | 1.0 | 950 | $1,150 | $1.21 | 3d | 1 | 1.11mi |
| 9212 Jennifer Pl Oklahoma City, OK | 3.0 | 2.0 | 960 | $1,250 | $1.30 | 45d | 1 | 1.12mi |
| 208 W Shadywood Dr Oklahoma City, OK | 3.0 | 1.0 | 891 | $1,099 | $1.23 | 25d | 1 | 1.14mi |
| 322 E Kerr Dr Oklahoma City, OK | 3.0 | 1.0 | 1086 | $1,200 | $1.10 | 25d | 1 | 1.26mi |
| 2904 Treight Creek Ln Midwest City, OK | 2.0 | 2.0 | 984 | $1,495 | $1.52 | 3d | 2 | 1.36mi |
| 633 Lotus Ave Oklahoma City, OK | 3.0 | 1.0 | 1038 | $1,300 | $1.25 | 12d | 1 | 1.37mi |
| 764 E Rose Dr Oklahoma City, OK | 3.0 | 1.0 | 920 | $1,025 | $1.11 | 4d | 1 | 1.38mi |
Listing history 14 events
-
2026-05-01price $100,000 632-char remark
Show marketing remark (632 chars)
This 3-bedroom home in Midwest City offers the perfect chance to buy your first home, or add to your investment portfolio. Featuring a brand-new hot water tank, this property is already off to a strong start and is ready to be made your own with cosmetic updates or a renovation vision. With a functional layout and plenty of potential, this is an excellent investment opportunity for flippers, landlords, or anyone looking to expand their rental portfolio. The home sits in a convenient location close to shopping, dining, Tinker AFB, and major highways, making it attractive for future tenants or resale. Set your showing today!
-
2026-04-20$110,000 Active 632-char remark
Show marketing remark (632 chars)
This 3-bedroom home in Midwest City offers the perfect chance to buy your first home, or add to your investment portfolio. Featuring a brand-new hot water tank, this property is already off to a strong start and is ready to be made your own with cosmetic updates or a renovation vision. With a functional layout and plenty of potential, this is an excellent investment opportunity for flippers, landlords, or anyone looking to expand their rental portfolio. The home sits in a convenient location close to shopping, dining, Tinker AFB, and major highways, making it attractive for future tenants or resale. Set your showing today!
-
2011-05-19historical
-
2011-05-02soldstatus $44,900
-
2011-01-31soldstatus $45,000
-
2010-10-14$49,900
-
2010-05-25soldstatus $21,500
-
2010-03-05$24,900
-
2009-01-05$62,000
-
2007-12-19historical
-
2006-02-06soldstatus $56,000
-
2001-08-01soldstatus $39,500
-
2000-11-28$32,500
-
1986-03-01soldstatus $34,000
ⓘ Source: listings_history table (triggers on properties + properties_extension) + one-shot
backfill from property_details.listing_events for pre-trigger history.
Climate risk First Street
- Flood 1/10 Low FEMA zone X (unshaded) · 0% chance over 30 yrs
- Wildfire 1/10 Low
- Heat 6/10 Major 7 d/yr ≥107°F today · 19 d/yr by 30 yrs out
- Wind 2/10 Low 4% chance of damaging wind over 30 yrs
- Air quality 2/10 Low 1 unhealthy d/yr today · 2 by 30 yrs out
Nearby sold comps map
Loading sold comps map…
Walkable amenities ~0.75 mi
Loading nearby amenities…
Taxation est. · year 1
- Rental income
- $13,938
- − Mortgage interest
- −$5,602
- − Property taxes
- −$1,500
- − Insurance
- −$500
- − Repairs & maintenance
- −$1,115
- − Management
- −$1,115
- − Depreciation
- −$2,909
- Taxable income
- $1,197
- Est. tax owed @ 24.0%
- −$287
- After-tax cash flow
- $2,431/yr
For passive investors: Depreciation is non-cash, so a rental often shows a tax loss while cash-flowing — sheltering income. Rental losses are passive: they offset passive income freely, and up to $25,000/yr can offset ordinary (W-2) income if you actively participate and your MAGI is under $100k (phasing out to $0 by $150k); unused losses carry forward. On sale, claimed depreciation is recaptured at up to 25%, and gains may owe capital-gains tax (a 1031 exchange can defer both). Figures are a year-1 estimate at your 24.0% rate — not tax advice; consult a CPA.
Schools (NCES district)
- District
- Oklahoma City
- NCES district ID
- 4022770
- Math proficiency
- 7% ▼ -5.00%
- Reading proficiency
- 10% ▼ -6.00%
- Median HH income
- $35,606
- Composite
- 7.0/100
- National rank
- #9970
- State rank
- #254 of 270 in OK
Livability — Midwest City
- Score
- 71/100
- State rank
- #30
- US rank
- #6637
Category grades
Schools grade is shown separately in the Schools card above.
Census & demographics
- Census place
- Midwest City, OK
- County
- Oklahoma County · 771,644 people
- City population
- 57,386
- Metro
- Oklahoma City, OK
- Population (ZIP)
- 32,348
- Household income
- $51,228
- Rent vs Own
- Severe rent burden
- 1440.0
Population outlook (Oklahoma County) Hauer SSP2
- Today (2025)
- 911,875 people
- By 2030
- 982,413 · +7.7%
- By 2040
- 1,130,468 · +24.0%
- By 2050
- 1,288,422 · +41.3%
- By 2075
- 1,711,482 · +87.7%
- By 2100
- 2,088,448 · +129.0%
Race, ethnicity, and origin ACS 2023
- Neighborhood character
- Diverse neighborhood (Simpson 0.63)
- Race & ethnicity
- White 55% Black 25% Two or more races 11% Hispanic / Latino 7% Native American 4% Asian 1%
- Hispanic origin (detail)
- Mexican 5%
- Common ancestry
- Lithuanian 2% Slovak 1% Serbian 1%
- Foreign-born
- 3% · Canada, Vietnam
- Languages at home
- 95% English-only · Spanish 3%
Political lean MEDSL · Oklahoma
- 2024 margin
- Toss-up / Even · D 48.0% · R 49.7% · Other 2.3%
- 2008→2024 swing
- +15.1pp toward D · 2008: -16.8pp · 2024: -1.7pp
- All cycles
- 2024: R+1.7 2020: R+1.1 2016: R+10.5 2012: R+16.7 2008: R+16.8
Not yet ingested
- Civics
- —
Market trends
- HPI YoY
- ▼ -156.25%
- Current HPI
- 257.0791
- Rent YoY
- ▲ 2.99%
- Metro
- Oklahoma City, OK
- State GDP YoY
- ▲ 1.55%
- F500 in state
- 6
Industry mix (Fortune 500 HQ in OK)
| Industry | F500 HQs | Revenue |
|---|---|---|
| Energy | 3 | $48B |
|
||
Price history
+194.1% since first listed14 events — show timeline
- 2026-05-01 Price Changed $100,000 MLSOK
- 2026-04-20 Listed $110,000 MLSOK
- 2011-05-19 Listing Removed — MLSOK
- 2011-05-02 Sold (MLS) $44,900 MLSOK
- 2011-01-31 Sold (Public Records) $45,000 Public Records
- 2010-10-14 Listed $49,900 MLSOK
- 2010-05-25 Sold (MLS) $21,500 MLSOK
- 2010-03-05 Listed $24,900 MLSOK
- 2009-01-05 Listed $62,000 MLSOK
- 2007-12-19 Listing Removed — MLSOK
- 2006-02-06 Sold (Public Records) $56,000 Public Records
- 2001-08-01 Sold (Public Records) $39,500 Public Records
- 2000-11-28 Listed $32,500 MLSOK
- 1986-03-01 Sold (Public Records) $34,000 Public Records
Cash-flow waterfall
monthlySold comps — $/sqft
last 12 mo · ≤1 miLoading sold comps…