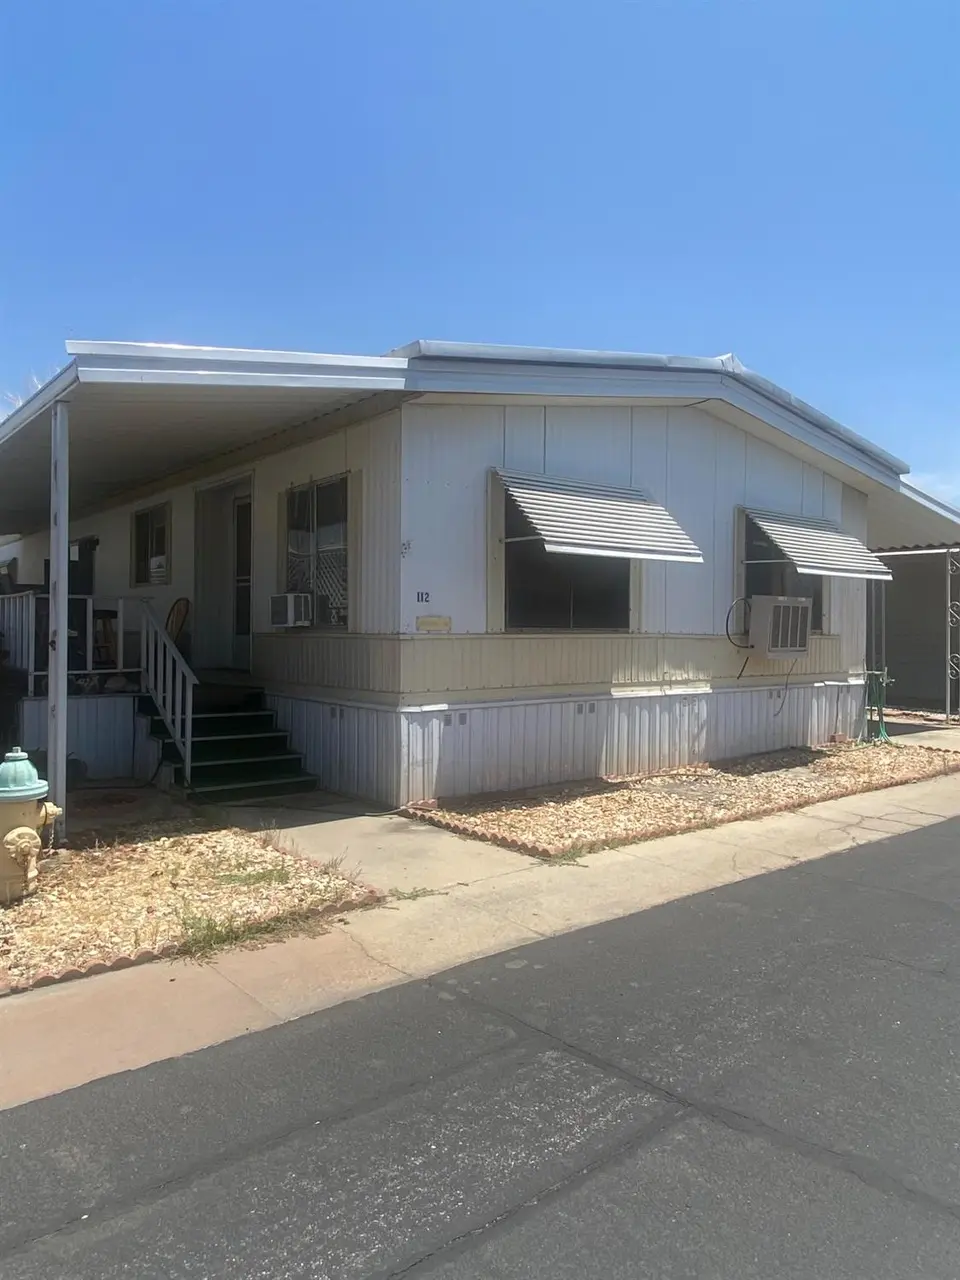
581 N Crawford Ave #112 · Dinuba, CA
Flood risk 1/10 · Minimal
- FEMA flood zone
- AO
- Chance of flooding over 30 yrs
- 0.0%
- Est. flood insurance / yr
- $848 – $2,087
Fire risk 8/10 · Major
- Est. fire insurance / yr
- $659 – $1,223
Heat risk 8/10 · Major
- Hot days now (above 106°F)
- 7 days/yr
- Hot days in 30 yrs
- 17 days/yr
Wind risk 1/10 · Minimal
- Chance of severe wind over 30 yrs
- —
Air-quality risk 10/10 · Severe
- Unhealthy air days now
- 47 days/yr
- Unhealthy air days in 30 yrs
- 53 days/yr
Risk factors via First Street. Map © Google.
Why this score? — see what drove the B+ grade
The composite is a weighted blend of 9 inputs, each scored 0–100. Each bar is that input's sub-score; the figure is the points it added to the 100-point composite (weight × sub-score).
- Cash flow +30.0/30.0
- ARV discount +15.0/15.0
- 1% rule +10.0/10.0
- DSCR +10.0/10.0
- Schools +3.7/10.0
- Livability +3.1/5.0
- Rent growth +2.5/5.0
- Condition / age +2.5/5.0
- Appreciation +0.0/10.0
$43,000
🖨 Deal sheet 📄 Offer letter ✓ Due diligence
Listing remarks MLS
Here is your 2nd chance to purchase this mobile home! 2 bdrm, 2 ba located in Dinuba Downs 55+ living community. Large living room, dining rm with built in cabinets, and family rm. Close to shopping centers. Home needs TLC, but has lost of potential! Call to make your appointment today!
Key facts
- Community pool
- Built 1981
- Listed 80 days
Neighborhood map
What this means for you Summary
Snapshot
- This is a 2-bed/2.0-bath land listed at $43k.
Deal economics
- At list price, monthly cash flow is $985 ($12k/yr) — positive.
- The deal already cash-flows at list — no discount required.
- Meets the 1% rule at list price ($2k rent vs $43k).
- Recommended offer: $40k (6.0% below list) — sets the bar for market timing.
- Cap rate 37.2% vs local median 2.7% in Dinuba — top-decile yield for the area; either an underpriced asset or a hidden risk that comps aren't pricing in. Stress-test before assuming the spread holds.
Location & tenants
- Location reads 61/100 on livability (#517 in CA) — a middle-class / working-renter tenant base. Strengths: commute A+, housing A+; Watch: schools F, crime F, amenities F.
- Dinuba Unified (town): math 26% / reading 62% proficiency, ranked #215 of 517 in CA (top 42%) — families likely to look elsewhere, expect single-tenant / working-renter base with shorter leases; 74% free/reduced lunch — lower-income household profile, screen leases tightly.
- Market conditions: 99 active listings in the ZIP; 7 comparable units currently listed for rent nearby; rentals at typical pace (median 20d on market — plan ~3-4 weeks tenant-placement turnaround); 1,447 units permitted in Tulare County in 2024 (307 in 5+ unit buildings).
Forward outlook
- Local home prices are declining (-3.0%/yr); year-one equity from $297 of loan paydown is wiped out by about $1k of value loss. Plan a longer hold.
- Tulare County population projected at +10% by 2050 — modest demand growth; plan on rents tracking national, not racing it.
- At projected returns (-3.0% appreciation + 3.0% rent growth), your $12k cash investment doubles in ~2 years — after that, you're playing with house money.
Negotiation context
- It's been on market 80 days — a 6% lower offer ($40k) is reasonable based on typical stale-listing flexibility.
- 4 sale attempts since 15y ago with the ask held roughly flat each time — persistent listings suggest the price (not the market) is what's stuck; bring a comps-based counter.
- Current owner paid $27k; list at $43k implies a 59% gain — meaningful room to come down on a strong offer.
Risks & watch-outs
- Watch-outs: flood insurance adds $122/mo.
- Climate carrying-cost: in FEMA flood zone AO (mandatory federal flood insurance); severe wildfire risk; extreme-heat days projected 7→17/yr by 2055 (HVAC capex compounding) — expect insurance premiums to compound above CPI over the hold.
Questions for the listing agent
- It's been on market 80 days. Have you received any prior offers? Is the seller open to a 6% concession, seller financing, or rate buy-down credit?
- What's the actual annual flood-insurance premium (NFIP or private), and is the property in a SFHA with mandatory coverage?
- Why hasn't it sold? Are there any deal-killer items the seller is aware of (foundation, flood, title, zoning, code violations)?
- Is there a deadline driving the sale (1031 exchange, divorce, estate, relocation)? That informs how much negotiation room exists.
- Schools are F-rated, which usually means shorter tenancies and higher turnover. Who's the typical renter profile here, and what's been the actual vacancy rate?
- Crime grade is F in this area — have there been break-ins, vandalism, or insurance claims at this property in the last 3 years? What carrier currently insures it and at what premium?
- What's the average days-on-market for RENTAL listings here right now (not sales)? A rising rental-DOM trend means longer vacancies and softer asking-rent achievability than the comps imply.
- What's the recent tenant-quality profile in this submarket — average credit score on applications, eviction rate, late-payment / NSF rate, and stable-employment percentage? A property-management company in the area should have these aggregated.
- How much new for-sale + rental construction is in the pipeline within 1–3 miles? Heavy new supply typically softens prices + rents 12–24 months out; constrained supply supports both.
Investment metrics
- 1% rule
- 4.13% ✓
- Cap rate
- 37.19%
- Cash-on-cash
- 110.34%
- DSCR
- 5.91
- GRM
- 2.0
CMA / ARV
- ARV (median comp)
- $83,250
- List price
- $43,000
- Delta
- -48.35%
- Verdict
- UNDERPRICED
- Comps
- 6 within 1.0 mi
Projected returns pro-forma
-3.0% appreciation · 3.0% rent growth · sell at horizon
- IRR
- 99.2%
- Equity multiple
- 5.64×
- Total profit
- $55,855
- Equity at exit
- $6,411
- IRR
- —
- Equity multiple
- 11.78×
- Total profit
- $129,814
- Equity at exit
- $3,718
Cash invested: $12,040 (down + closing). Projections, not guarantees.
Landlord ↔ Tenant lean methodology
- Overall (STATE)
- 18 Strongly Tenant-Friendly
- State California
- 18 Strongly Tenant-Friendly · D+13
- County
- — inherits STATE
- City
- — inherits STATE
ZIP-level market 93618
- Active inventory
- 99
- Price-to-rent
- 2.0×
Monthly cashflow live
- Estimated rent
- $1,778 high interval (Pro) →
- Mortgage (P&I)
- −$225
- Tax est. 1.5%
- −$54 /mo · $645/yr
- Insurance
- −$18
- Flood insurance flood zone
- −$122 /mo · $1,468/yr
- HOA
- −$0
- Vacancy / Maint / Mgmt
- −$373
- Net cashflow
- $985
Break-even live
UW: 25.0% down · 7.5% · 30yr · 1.5% tax · 5.0% vac · 8.0% maint · 8.0% mgmt
Financing live
Cash to close
- Down payment
- $10,750
- Closing costs
- $1,290
- Reserves months
- —
- Total cash needed
- —
Loan-product check · same deal, 3 products live
Conventional
25% down · 7.5% · 30yr
- Down + closing
- —
- Monthly P&I
- —
- Monthly cashflow
- —
- DSCR
- —
- Eligible?
- —
Personal DTI + credit; lowest rate.
DSCR
20% down · 8.5% · 30yr
- Down + closing
- —
- Monthly P&I
- —
- Monthly cashflow
- —
- DSCR
- —
- Eligible?
- —
No personal income docs; deal must DSCR.
Hard money
10% down · 12.0% · 12mo
- Down + closing
- —
- Monthly P&I
- —
- Monthly cashflow
- —
- DSCR
- —
- Eligible?
- —
Short-term bridge; refi at stabilization.
Rent comps 7 comps
| Address | Beds | Baths | Sqft | Rent | $/sqft | DOM | Units | Dist |
|---|---|---|---|---|---|---|---|---|
| 786 E North Way Dinuba, CA | 3.0 | 1.0 | 1101 | $1,975 | $1.79 | 21d | 1 | 0.46mi |
| 590 Lincoln Ave Unit 102 Dinuba, CA | 3.0 | 2.0 | 1056 | $1,995 | $1.89 | 43d | 1 | 0.50mi |
| 120 Eaton Ave Apt 22 Dinuba, CA | 2.0 | 2.0 | 900 | $1,075 | $1.19 | 2d | 1 | 0.68mi |
| 493 N Alta Ave Dinuba, CA | 3.0 | 2.0 | 1312 | $1,775 | $1.35 | 1d | 1 | 0.91mi |
| 1764 Golden Way Dinuba, CA | 3.0 | 2.0 | 1863 | $2,175 | $1.17 | 3d | 1 | 1.06mi |
| 417 W Franklin Way Dinuba, CA | 2.0 | 1.0 | 1166 | $1,595 | $1.37 | 43d | 1 | 1.09mi |
| 1050 E Kamm Ave Unit 105 Single Level Dinuba, CA | 3.0 | 2.0 | 980 | $1,550 | $1.58 | 19d | 1 | 1.35mi |
Listing history 27 events
-
2026-06-18days on market $43,000 Active 80 DOM
-
2026-06-17days on market $43,000 Active 79 DOM
-
2026-06-16days on market $43,000 Active 78 DOM
-
2026-06-15days on market $43,000 Active 77 DOM
-
2026-06-14days on market $43,000 Active 75 DOM
-
2026-06-13days on market $43,000 Active 74 DOM
-
2026-06-10days on market $43,000 Active 72 DOM
-
2026-06-09days on market $43,000 Active 71 DOM
-
2026-06-08days on market $43,000 Active 70 DOM
-
2026-06-07days on market $43,000 Active 69 DOM
-
2026-06-05days on market $43,000 Active 66 DOM
-
2026-06-03days on market $43,000 Active 65 DOM
-
2026-06-02days on market $43,000 Active 64 DOM
-
2026-06-01days on market $43,000 Active 63 DOM
-
2026-05-31days on market $43,000 Active 62 DOM
-
2026-05-30days on market $43,000 Active 61 DOM
-
2026-03-30$43,000 Active 287-char remark
Show marketing remark (287 chars)
Here is your 2nd chance to purchase this mobile home! 2 bdrm, 2 ba located in Dinuba Downs 55+ living community. Large living room, dining rm with built in cabinets, and family rm. Close to shopping centers. Home needs TLC, but has lost of potential! Call to make your appointment today!
-
2026-01-05price $47,000
-
2025-12-09price $50,000
-
2025-11-05price $59,000
-
2025-10-11price $69,900
-
2015-06-05soldstatus $27,000
-
2015-06-05soldstatus $27,000
-
2015-03-13$27,000
-
2015-03-13$27,000
-
2012-01-10soldstatus $15,600
-
2011-10-31$19,900
ⓘ Source: listings_history table (triggers on properties + properties_extension) + one-shot
backfill from property_details.listing_events for pre-trigger history.
Climate risk First Street
- Flood 1/10 Low FEMA zone AO · 0% chance over 30 yrs
- Wildfire 8/10 Severe
- Heat 8/10 Severe 7 d/yr ≥106°F today · 17 d/yr by 30 yrs out
- Wind 1/10 Low
- Air quality 10/10 Extreme 47 unhealthy d/yr today · 53 by 30 yrs out
Nearby sold comps map
Loading sold comps map…
Walkable amenities ~0.75 mi
Loading nearby amenities…
Taxation est. · year 1
- Rental income
- $21,330
- − Mortgage interest
- −$2,409
- − Property taxes
- −$645
- − Insurance
- −$1,682
- − Repairs & maintenance
- −$1,706
- − Management
- −$1,706
- − Depreciation
- −$1,251
- Taxable income
- $11,930
- Est. tax owed @ 24.0%
- −$2,863
- After-tax cash flow
- $8,954/yr
For passive investors: Depreciation is non-cash, so a rental often shows a tax loss while cash-flowing — sheltering income. Rental losses are passive: they offset passive income freely, and up to $25,000/yr can offset ordinary (W-2) income if you actively participate and your MAGI is under $100k (phasing out to $0 by $150k); unused losses carry forward. On sale, claimed depreciation is recaptured at up to 25%, and gains may owe capital-gains tax (a 1031 exchange can defer both). Figures are a year-1 estimate at your 24.0% rate — not tax advice; consult a CPA.
Schools (NCES district)
- District
- Dinuba Unified
- NCES district ID
- 0600065
- Math proficiency
- 26% ▼ -8.00%
- Reading proficiency
- 62% ▲ 17.00%
- Median HH income
- $39,763
- Composite
- 36.68/100
- National rank
- #4603
- State rank
- #215 of 517 in CA
Livability — Dinuba
- Score
- 61/100
- State rank
- #517
- US rank
- #17466
Category grades
Schools grade is shown separately in the Schools card above.
Census & demographics
- Census place
- Dinuba, CA
- Population (ZIP)
- 32,223
Population outlook (Tulare County) Hauer SSP2
- Today (2025)
- 484,681 people
- By 2030
- 496,241 · +2.4%
- By 2040
- 518,507 · +7.0%
- By 2050
- 534,920 · +10.4%
- By 2075
- 548,417 · +13.2%
- By 2100
- 513,085 · +5.9%
Race, ethnicity, and origin ACS 2023
- Neighborhood character
- Predominantly Hispanic (87%)
- Race & ethnicity
- Hispanic / Latino 87% Two or more races 21% White 11%
- Hispanic origin (detail)
- Mexican 83%
- Foreign-born
- 25% · Canada
- Languages at home
- 36% English-only · Spanish 63%
Political lean MEDSL · Tulare
- 2024 margin
- Strong R (+20.7) · D 38.5% · R 59.2% · Other 2.3%
- 2008→2024 swing
- -5.4pp toward R · 2008: -15.3pp · 2024: -20.7pp
- All cycles
- 2024: R+20.7 2020: R+7.8 2016: R+12.1 2012: R+17.8 2008: R+15.3
Not yet ingested
- Civics
- —
Market trends
- HPI YoY
- ▼ -295.76%
- Current HPI
- 360.2783
- Rent YoY
- —
- Metro
- —
- State GDP YoY
- ▲ 3.21%
- F500 in state
- 116
Industry mix (Fortune 500 HQ in CA)
| Industry | F500 HQs | Revenue |
|---|---|---|
| Technology | 27 | $1,492B |
|
||
| Financial Services | 3 | $174B |
|
||
| Retail | 3 | $44B |
|
||
| Insurance | 3 | $26B |
|
||
| Media / Entertainment | 2 | $115B |
|
||
| Pharmaceuticals / Biotech | 2 | $62B |
|
||
Price history
+116.1% since first listed11 events — show timeline
- 2026-03-30 Listed $43,000 FRESNOMLS
- 2026-01-05 Price Changed $47,000 FRESNOMLS
- 2025-12-09 Price Changed $50,000 FRESNOMLS
- 2025-11-05 Price Changed $59,000 FRESNOMLS
- 2025-10-11 Price Changed $69,900 FRESNOMLS
- 2015-06-05 Sold (MLS) $27,000 TCMLS
- 2015-06-05 Sold (MLS) $27,000 FRESNOMLS
- 2015-03-13 Listed $27,000 TCMLS
- 2015-03-13 Listed $27,000 FRESNOMLS
- 2012-01-10 Sold (MLS) $15,600 FRESNOMLS
- 2011-10-31 Listed $19,900 FRESNOMLS
Property tax history
-5.3%/yrLatest (2021): $84 · -5.6% YoY. Source: county tax records.
Cash-flow waterfall
monthlySold comps — $/sqft
last 12 mo · ≤1 miLoading sold comps…