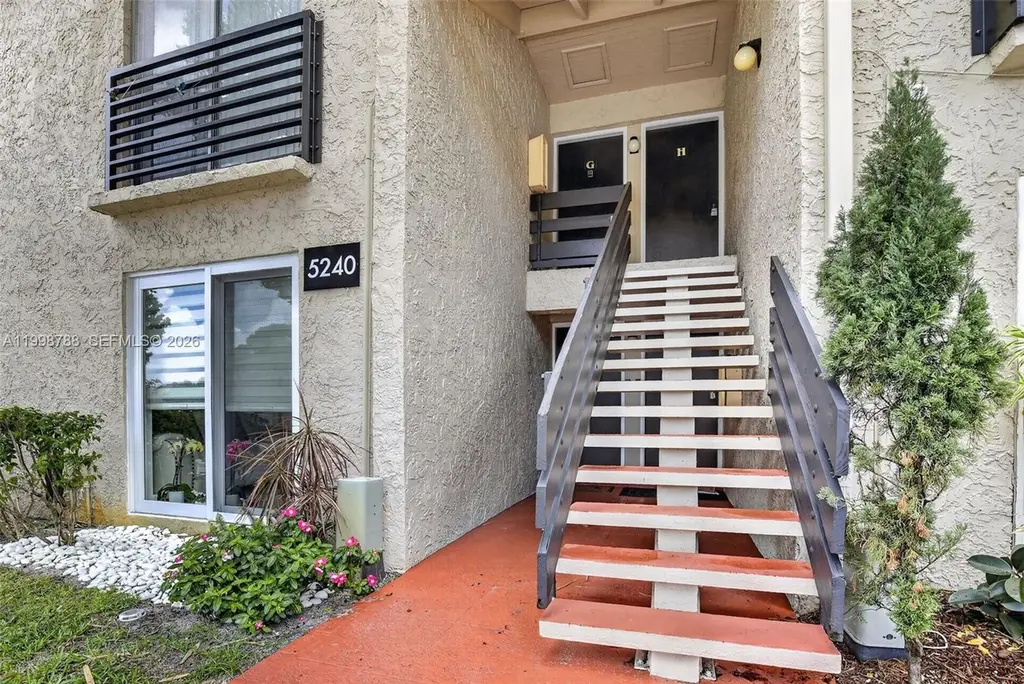
5240 NE 6th Ave Unit H26 · Oakland Park, FL
Flood risk 4/10 · Minor
- FEMA flood zone
- X (shaded)
- Chance of flooding over 30 yrs
- 0.21%
- Est. flood insurance / yr
- $507 – $1,088
Fire risk 1/10 · Minimal
- Est. fire insurance / yr
- $947 – $1,759
Heat risk 10/10 · Severe
- Hot days now (above 106°F)
- 7 days/yr
- Hot days in 30 yrs
- 26 days/yr
Wind risk 10/10 · Severe
- Chance of severe wind over 30 yrs
- 99.0%
Air-quality risk 2/10 · Minimal
- Unhealthy air days now
- 1 days/yr
- Unhealthy air days in 30 yrs
- 2 days/yr
Risk factors via First Street. Map © Google.
Why this score? — see what drove the B- grade
The composite is a weighted blend of 9 inputs, each scored 0–100. Each bar is that input's sub-score; the figure is the points it added to the 100-point composite (weight × sub-score).
- Cash flow +27.9/30.0
- 1% rule +10.0/10.0
- DSCR +9.9/10.0
- ARV discount +7.5/15.0
- Schools +4.1/10.0
- Livability +3.9/5.0
- Condition / age +3.8/5.0
- Rent growth +3.0/5.0
- Appreciation +0.0/10.0
$195,000
🖨 Deal sheet 📄 Offer letter ✓ Due diligence
Listing remarks
Welcome to this beautifully updated 3-bed, 2-bath residence at Embarcadero Condominium. This home features brand-new flooring throughout (2024) and a tankless water heater installed in 2024. The kitchen has been updated with modern appliances and includes a brand-new, in-box dishwasher, ready for the new owner. Enjoy the convenience of an in-unit washer and dryer (2024), along with two fully remodeled bathrooms. Located within a gated community with security, residents enjoy access to a community pool, assigned parking, and ample guest parking.
Key facts
- $855 HOA
- Parking
- Community pool
Property features AI
Finance
- Financial info: Pets allowed with size limit (maximum 20 lbs)
- HOA & community: Monthly association fee; Association fee covers common area maintenance, grounds maintenance, security, trash, and water; Community amenities: clubhouse, fitness center, laundry, pool
Exterior
- Parking: Assigned parking
- Security: Association-provided security
- Utilities: Central HVAC; Water included in association fee; Municipal sewer and power
- Home design: Attached property; 2-story building; Second-floor entry
- Construction: Stucco construction; Effective year built
- Exterior features: Balcony; Screened balcony; Association pool
Interior
- Kitchen: Electric range; Microwave; Dishwasher; Refrigerator
- Flooring: Hardwood; Wood
- Bathrooms: 2 full bathrooms
- Heating & cooling: Central heating; Central air conditioning
- Interior features: Second-floor entry; Hardwood/wood flooring
- Laundry & utility: Washer and dryer included; Common area laundry available
Neighborhood map
What this means for you Summary
Snapshot
- This is a 3-bed/2.0-bath condo listed at $195k. Condition is rated good.
Deal economics
- At list price, monthly cash flow is $600 ($7k/yr) — positive.
- The deal already cash-flows at list — no discount required.
- Meets the 1% rule at list price ($4k rent vs $195k).
- Recommended offer: $189k (3.0% below list) — sets the bar for market timing.
- Cap rate 10.0% vs local median 3.8% in Oakland Park — top-decile yield for the area; either an underpriced asset or a hidden risk that comps aren't pricing in. Stress-test before assuming the spread holds.
Location & tenants
- Location reads 77/100 on livability (#193 in FL, #3,082 nationally) — a middle-class / working-renter tenant base. Strengths: commute A+, housing A+, health & safety A+; Watch: schools D, amenities F.
- Broward (suburban): math 42% / reading 53% proficiency, ranked #46 of 73 in FL (top 63%) — families likely to look elsewhere, expect single-tenant / working-renter base with shorter leases.
- Market conditions: Rents rising (+2.0%/yr); 355 active listings in the ZIP; 38 comparable units currently listed for rent nearby; rentals at typical pace (median 25d on market — plan ~3-4 weeks tenant-placement turnaround); solid renter incomes; 2,111 units permitted in Broward County in 2024 (1,265 in 5+ unit buildings).
- At $3,547/mo this rent would consume 56% of the median local household income ($75k/yr) (locally 1755% of renters already pay >50% of income on rent) — very limited rent-growth headroom before tenants either downsize or default.
Forward outlook
- Local home prices are declining (-3.0%/yr); year-one equity from $1k of loan paydown is wiped out by about $6k of value loss. Plan a longer hold.
- Broward County population projected at +34% by 2050 — long-run rental-demand tailwind backs the buy-and-hold thesis.
- At projected returns (-3.0% appreciation + 2.0% rent growth), your $55k cash investment doubles in ~10 years — after that, you're playing with house money.
Negotiation context
- It's been on market 41 days — a 3% lower offer ($189k) is reasonable based on typical stale-listing flexibility.
- 3 sale attempts; this cycle's ask is 8025% above the opening price — seller raised mid-cycle; expect resistance to lowballs.
Risks & watch-outs
- Watch-outs: HOA is 24% of rent.
- Climate carrying-cost: severe wind risk, 99% chance of damaging wind over 30y; extreme-heat days projected 7→26/yr by 2055 (HVAC capex compounding) — expect insurance premiums to compound above CPI over the hold.
Questions for the listing agent
- It's been on market 41 days. Have you received any prior offers? Is the seller open to a 3% concession, seller financing, or rate buy-down credit?
- Built in 1973 — when were the roof, HVAC, electrical panel, plumbing, and water heater last replaced?
- What does the HOA fee cover, when was the last increase, and are there any pending special assessments or reserve-fund shortfalls?
- Any open or pending special assessments — roof, HVAC, plumbing, elevator, façade? What's the per-unit balance and payoff schedule, and is the seller paying it off at close or rolling it to the buyer?
- Is there a deadline driving the sale (1031 exchange, divorce, estate, relocation)? That informs how much negotiation room exists.
- Schools are D-rated, which usually means shorter tenancies and higher turnover. Who's the typical renter profile here, and what's been the actual vacancy rate?
- What's the average days-on-market for RENTAL listings here right now (not sales)? A rising rental-DOM trend means longer vacancies and softer asking-rent achievability than the comps imply.
- What's the recent tenant-quality profile in this submarket — average credit score on applications, eviction rate, late-payment / NSF rate, and stable-employment percentage? A property-management company in the area should have these aggregated.
- How much new apartment / multifamily construction is in the pipeline within 1–3 miles? Heavy new supply (>2% of stock underway) typically softens rents 12–24 months out; light construction supports rent growth.
Investment metrics
- 1% rule
- 1.82% ✓
- Cap rate
- 9.98%
- Cash-on-cash
- 13.18%
- DSCR
- 1.59
- GRM
- 4.6
CMA / ARV
No comps found within radius.
Projected returns pro-forma
-3.0% appreciation · 2.01% rent growth · sell at horizon
- IRR
- 1.8%
- Equity multiple
- 1.07×
- Total profit
- $3,690
- Equity at exit
- $29,075
- IRR
- 10.2%
- Equity multiple
- 1.75×
- Total profit
- $40,690
- Equity at exit
- $16,860
Cash invested: $54,600 (down + closing). Projections, not guarantees.
Landlord ↔ Tenant lean methodology
- Overall (STATE)
- 87 Strongly Landlord-Friendly
- State Florida
- 87 Strongly Landlord-Friendly · R+3
- County
- — inherits STATE
- City
- — inherits STATE
ZIP-level market 33334
- Home prices YoY
- -34.6%
- Rents YoY
- 2.0%
- Active inventory
- 355
- Price-to-rent
- 4.6×
Monthly cashflow live
- Estimated rent
- $3,547 high interval (Pro) →
- Mortgage (P&I)
- −$1,023
- Tax est. 1.5%
- −$244 /mo · $2,925/yr
- Insurance
- −$81
- HOA
- −$855
- Vacancy / Maint / Mgmt
- −$745
- Net cashflow
- $600
Break-even live
UW: 25.0% down · 7.5% · 30yr · 1.5% tax · 5.0% vac · 8.0% maint · 8.0% mgmt
Financing live
Cash to close
- Down payment
- $48,750
- Closing costs
- $5,850
- Reserves months
- —
- Total cash needed
- —
Loan-product check · same deal, 3 products live
Conventional
25% down · 7.5% · 30yr
- Down + closing
- —
- Monthly P&I
- —
- Monthly cashflow
- —
- DSCR
- —
- Eligible?
- —
Personal DTI + credit; lowest rate.
DSCR
20% down · 8.5% · 30yr
- Down + closing
- —
- Monthly P&I
- —
- Monthly cashflow
- —
- DSCR
- —
- Eligible?
- —
No personal income docs; deal must DSCR.
Hard money
10% down · 12.0% · 12mo
- Down + closing
- —
- Monthly P&I
- —
- Monthly cashflow
- —
- DSCR
- —
- Eligible?
- —
Short-term bridge; refi at stabilization.
Rent comps 38 comps
| Address | Beds | Baths | Sqft | Rent | $/sqft | DOM | Units | Dist |
|---|---|---|---|---|---|---|---|---|
| 5157 NE 5th Ave Unit 1 Fort Lauderdale, FL | 3.0 | 2.0 | 1250 | $3,500 | $2.80 | 3d | 1 | 0.21mi |
| 5409 NE 4th Ave Fort Lauderdale, FL | 3.0 | 2.0 | 1178 | $3,200 | $2.72 | 24d | 1 | 0.33mi |
| 4780 NE 8th Ter Oakland Park, FL | 3.0 | 2.0 | 1130 | $4,200 | $3.72 | 24d | 1 | 0.39mi |
| 5655 NE 5th Ter Fort Lauderdale, FL | 3.0 | 2.0 | 1178 | $3,250 | $2.76 | 16d | 1 | 0.45mi |
| 5655 NE 5th Ter Fort Lauderdale, FL | 3.0 | 2.0 | 1178 | $3,250 | $2.76 | 24d | 1 | 0.45mi |
| 4680 NE 5th Ave Fort Lauderdale, FL | 3.0 | 2.0 | 1300 | $3,800 | $2.92 | 7d | 1 | 0.53mi |
| 540 NE 59th Ct Fort Lauderdale, FL | 3.0 | 2.0 | 964 | $3,400 | $3.53 | 24d | 1 | 0.63mi |
| 4601 NE 4th Ave Unit 1261561P Fort Lauderdale, FL | 3.0 | 2.0 | 1097 | $4,430 | $4.04 | 24d | 1 | 0.64mi |
| 5841 NE 3rd Ave Fort Lauderdale, FL | 3.0 | 2.0 | 834 | $3,200 | $3.84 | 24d | 1 | 0.65mi |
| 5365 N Andrews Ave Fort Lauderdale, FL | 3.0 | 2.0 | 1016 | $3,500 | $3.44 | 24d | 1 | 0.66mi |
| 4580 NE 3rd Ave Fort Lauderdale, FL | 3.0 | 2.0 | 1192 | $3,300 | $2.77 | 20d | 1 | 0.68mi |
| 4650 NE 2nd Ave Fort Lauderdale, FL | 3.0 | 2.0 | 1356 | $3,950 | $2.91 | 24d | 1 | 0.68mi |
| 4511 NE 13th Ave Oakland Park, FL | 3.0 | 3.0 | 1416 | $4,300 | $3.04 | 4d | 1 | 0.71mi |
| 4511 NE 13th Ave Oakland Park, FL | 2.0 | 2.0 | 1400 | $3,200 | $2.29 | 7d | 1 | 0.71mi |
| 4511 NE 13th Ave Oakland Park, FL | 3.0 | 3.0 | 1416 | $4,300 | $3.04 | 24d | 1 | 0.71mi |
| 261 NE 45th St Fort Lauderdale, FL | 3.0 | 2.0 | 997 | $3,247 | $3.26 | 24d | 1 | 0.77mi |
| 320 NW 51st Ct Fort Lauderdale, FL | 3.0 | 2.0 | 1396 | $3,500 | $2.51 | 24d | 1 | 0.79mi |
| 540 NE 61st Ct Fort Lauderdale, FL | 3.0 | 2.0 | 1272 | $3,395 | $2.67 | 3d | 1 | 0.80mi |
| 240 NW 48th Ct Fort Lauderdale, FL | 3.0 | 2.0 | 1240 | $3,100 | $2.50 | 3d | 1 | 0.80mi |
| 4764 NE 15th Way Oakland Park, FL | 3.0 | 2.0 | 1218 | $3,500 | $2.87 | 24d | 1 | 0.82mi |
| 1575 NE 47th St Oakland Park, FL | 3.0 | 2.0 | 1358 | $3,700 | $2.72 | 24d | 1 | 0.84mi |
| 4360 NE 13th Ave Oakland Park, FL | 3.0 | 2.0 | 1269 | $3,700 | $2.92 | 24d | 1 | 0.87mi |
| 4360 NE 13th Ave Oakland Park, FL | 3.0 | 2.0 | 1459 | $3,700 | $2.54 | 5d | 1 | 0.87mi |
| 4360 NE 13th Ave Unit Main Oakland Park, FL | 3.0 | 2.0 | 1269 | $4,500 | $3.55 | 22d | 1 | 0.87mi |
| 351 NE 41st St Oakland Park, FL | 2.0 | 1.0 | 900 | $3,400 | $3.78 | 24d | 1 | 1.01mi |
| 5770 NE 18th Ave Fort Lauderdale, FL | 4.0 | 2.0 | 1459 | $7,500 | $5.14 | 14d | 1 | 1.03mi |
| 1421 NE 41st St Oakland Park, FL | 2.0 | 2.0 | 1366 | $4,000 | $2.93 | 24d | 1 | 1.06mi |
| 6500 N Andrews Ave Fort Lauderdale, FL | 2.0 | 1.0–2.0 | 943 | $3,146 | $3.34 | 2d | 31 | 1.14mi |
| 3801 Dixie Hwy Oakland Park, FL | 2.0 | 1.0–2.0 | 944 | $3,584 | $3.80 | 14d | 45 | 1.26mi |
| 3781 NE 13th Ave Oakland Park, FL | 2.0 | 1.0 | 869 | $3,900 | $4.49 | 24d | 1 | 1.32mi |
| 1740 NE 64th St Fort Lauderdale, FL | 3.0 | 2.0 | 1364 | $4,800 | $3.52 | 4d | 1 | 1.34mi |
| 1740 NE 64th St Fort Lauderdale, FL | 3.0 | 2.0 | 1364 | $4,800 | $3.52 | 11d | 1 | 1.34mi |
| 2155 NE 56th Ct Fort Lauderdale, FL | 3.0 | 2.0 | 1500 | $3,500 | $2.33 | 24d | 1 | 1.36mi |
| 2100 NE 45th St #1 Fort Lauderdale, FL | 3.0 | 3.5 | 1340 | $9,500 | $7.09 | 24d | 1 | 1.36mi |
| 4804 NE 21st Ave #4804 Fort Lauderdale, FL | 2.0 | 2.0 | 1400 | $4,500 | $3.21 | 24d | 1 | 1.40mi |
| 331 NW 38th St Oakland Park, FL | 2.0 | 1.5 | 1040 | $3,900 | $3.75 | 7d | 1 | 1.47mi |
| 331 NW 38th St Oakland Park, FL | 2.0 | 1.5 | 1040 | $3,900 | $3.75 | 17d | 1 | 1.47mi |
| 342 SW 14th St Pompano Beach, FL | 3.0 | 2.0 | 1458 | $5,000 | $3.43 | 24d | 1 | 1.50mi |
HOA detail condo
- Monthly dues
- $855 · $10,260/yr
- Likely covers
- waterpoolsecurityparking
- Assessments
- None detected in remarks — confirm with the listing agent.
Listing history 20 events
-
2026-06-18days on market $195,000 Active 41 DOM
-
2026-06-17days on market $195,000 Active 40 DOM
-
2026-06-16days on market $195,000 Active 39 DOM
-
2026-06-15days on market $195,000 Active 38 DOM
-
2026-06-13days on market $195,000 Active 36 DOM
-
2026-06-09days on market $195,000 Active 32 DOM
-
2026-06-08days on market $195,000 Active 31 DOM
-
2026-06-07days on market $195,000 Active 30 DOM
-
2026-06-04days on market $195,000 Active 27 DOM
-
2026-06-03days on market $195,000 Active 26 DOM
-
2026-06-02days on market $195,000 Active 25 DOM
-
2026-06-02price $195,000 Active 24 DOM
-
2026-06-01days on market $215,000 Active 24 DOM
-
2026-05-31days on market $215,000 Active 23 DOM
-
2026-05-23historical $2,200
-
2026-05-14status Active
-
2026-05-12price $2,200
-
2026-04-25price $2,275
-
2026-04-17$2,400
-
2026-04-10$215,000 Active
ⓘ Source: listings_history table (triggers on properties + properties_extension) + one-shot
backfill from property_details.listing_events for pre-trigger history.
Climate risk First Street
- Flood 4/10 Moderate FEMA zone X (shaded) · 21% chance over 30 yrs
- Wildfire 1/10 Low
- Heat 10/10 Extreme 7 d/yr ≥106°F today · 26 d/yr by 30 yrs out
- Wind 10/10 Extreme 99% chance of damaging wind over 30 yrs
- Air quality 2/10 Low 1 unhealthy d/yr today · 2 by 30 yrs out
Nearby sold comps map
Loading sold comps map…
Walkable amenities ~0.75 mi
Loading nearby amenities…
Taxation est. · year 1
- Rental income
- $42,570
- − Mortgage interest
- −$10,923
- − Property taxes
- −$2,925
- − Insurance
- −$975
- − Repairs & maintenance
- −$3,406
- − Management
- −$3,406
- − HOA
- −$10,260
- − Depreciation
- −$5,673
- Taxable income
- $5,003
- Est. tax owed @ 24.0%
- −$1,201
- After-tax cash flow
- $5,998/yr
For passive investors: Depreciation is non-cash, so a rental often shows a tax loss while cash-flowing — sheltering income. Rental losses are passive: they offset passive income freely, and up to $25,000/yr can offset ordinary (W-2) income if you actively participate and your MAGI is under $100k (phasing out to $0 by $150k); unused losses carry forward. On sale, claimed depreciation is recaptured at up to 25%, and gains may owe capital-gains tax (a 1031 exchange can defer both). Figures are a year-1 estimate at your 24.0% rate — not tax advice; consult a CPA.
Condition & rehab AI · 12 photos
This well-maintained 3-bedroom, 2-bath condo is move-in ready with recent updates and a good condition score.
Value-add opportunities
- Resale Paint exterior — Enhances curb appeal and property value
- Both Replace blinds — Improves natural light and aesthetics
- Resale Replace flooring — Modernizes the space and adds value
Renovation cost estimate screening
Value-add ROI direction
- Resale Paint exterior — Enhances curb appeal and property value ↑
- Both Replace blinds — Improves natural light and aesthetics ↑
- Resale Replace flooring — Modernizes the space and adds value ↑
ⓘ Cost ranges are severity-bucket heuristics (US national rule-of-thumb). Get contractor quotes + a written scope before underwriting a rehab budget.
Schools (NCES district)
- District
- Broward
- NCES district ID
- 1200180
- Math proficiency
- 42% ▼ -18.00%
- Reading proficiency
- 53% ▼ -5.00%
- Median HH income
- $52,139
- Composite
- 40.88/100
- National rank
- #3621
- State rank
- #46 of 73 in FL
Livability — Oakland Park
- Score
- 77/100
- State rank
- #193
- US rank
- #3082
Category grades
Schools grade is shown separately in the Schools card above.
Census & demographics
- Census place
- Oakland Park, FL
- County
- Broward County · 1,963,430 people
- City population
- 68,410
- Metro
- Miami-Fort Lauderdale-Pompano Beach, FL
- Population (ZIP)
- 30,935
- Household income
- $75,361
- Rent vs Own
- Severe rent burden
- 1755.0
Population outlook (Broward County) Hauer SSP2
- Today (2025)
- 2,207,033 people
- By 2030
- 2,360,704 · +7.0%
- By 2040
- 2,661,208 · +20.6%
- By 2050
- 2,946,698 · +33.5%
- By 2075
- 3,602,273 · +63.2%
- By 2100
- 3,970,984 · +79.9%
Race, ethnicity, and origin ACS 2023
- Neighborhood character
- Diverse neighborhood (Simpson 0.68)
- Race & ethnicity
- White 43% Hispanic / Latino 32% Two or more races 25% Black 17% Asian 2%
- Hispanic origin (detail)
- Mexican 2% Puerto Rican 4% Cuban 4%
- Common ancestry
- Hispanic 5% Lithuanian 3% Romanian 2%
- Foreign-born
- 31% · Canada, Jamaica, Vietnam
- Languages at home
- 59% English-only · Spanish 28% Other Indo-European 5% French/Haitian/Cajun 5%
Political lean MEDSL · Broward
- 2024 margin
- D (+17.0) · D 58.0% · R 41.0%
- 2008→2024 swing
- -17.8pp toward R · 2008: 34.7pp · 2024: 17.0pp
- All cycles
- 2024: D+17.0 2020: D+29.8 2016: D+35.0 2012: D+34.9 2008: D+34.7
Not yet ingested
- Civics
- —
Market trends
- HPI YoY
- ▼ -208.58%
- Current HPI
- 394.9526
- Rent YoY
- ▲ 2.01%
- Metro
- Miami-Fort Lauderdale-Pompano Beach, FL
- State GDP YoY
- ▲ 3.28%
- F500 in state
- 36
Industry mix (Fortune 500 HQ in FL)
| Industry | F500 HQs | Revenue |
|---|---|---|
| Industrial Technology | 2 | $29B |
|
||
| Insurance | 2 | $17B |
|
||
| Retail | 1 | $60B |
|
||
| Technology Distribution | 1 | $58B |
|
||
| Homebuilding | 1 | $35B |
|
||
| Technology Manufacturing | 1 | $35B |
|
||
Price history
-99.0% since first listed6 events — show timeline
- 2026-05-23 Rental Removed $2,200 MARMLS
- 2026-05-14 Relisted — MARMLS
- 2026-05-12 Price Changed $2,200 MARMLS
- 2026-04-25 Price Changed $2,275 MARMLS
- 2026-04-17 Listed for Rent $2,400 MARMLS
- 2026-04-10 Listed $215,000 MARMLS
Cash-flow waterfall
monthlySold comps — $/sqft
last 12 mo · ≤1 miLoading sold comps…