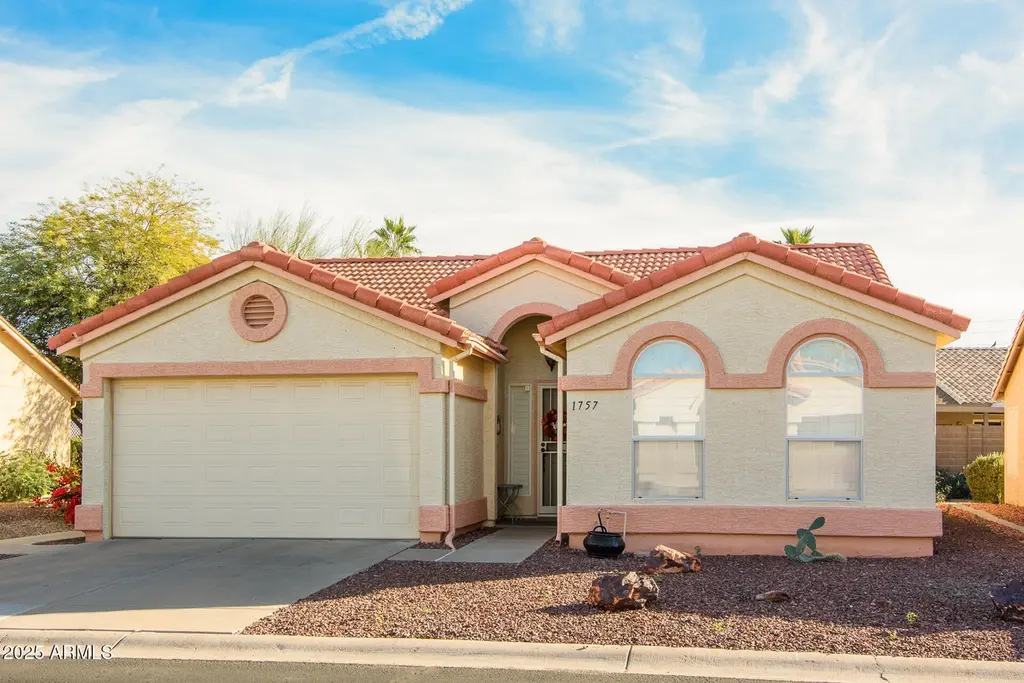
1757 E Lindrick Dr · Chandler, AZ
Flood risk 1/10 · Minimal
- FEMA flood zone
- X (shaded)
- Chance of flooding over 30 yrs
- 0.0%
- Est. flood insurance / yr
- $507 – $1,088
Fire risk 5/10 · Moderate
- Est. fire insurance / yr
- $610 – $1,132
Heat risk 9/10 · Severe
- Hot days now (above 112°F)
- 6 days/yr
- Hot days in 30 yrs
- 17 days/yr
Wind risk 1/10 · Minimal
- Chance of severe wind over 30 yrs
- —
Air-quality risk 1/10 · Minimal
- Unhealthy air days now
- 0 days/yr
- Unhealthy air days in 30 yrs
- 0 days/yr
Risk factors via First Street. Map © Google.
Why this score? — see what drove the D grade
The composite is a weighted blend of 9 inputs, each scored 0–100. Each bar is that input's sub-score; the figure is the points it added to the 100-point composite (weight × sub-score).
- ARV discount +11.7/15.0
- Cash flow +10.2/30.0
- Schools +4.8/10.0
- Livability +3.9/5.0
- Rent growth +3.3/5.0
- DSCR +2.9/10.0
- 1% rule +2.5/10.0
- Condition / age +2.5/5.0
- Appreciation +0.0/10.0
$308,000
🖨 Deal sheet (PDF) 📄 Offer letter ✓ Due diligence
Listing remarks MLS
ANOTHER HUGE PRICE REDUCTION AND A BRAND NEW ROOF. Gorgeous EXTENDED CARMEL model in SUNBIRD GOLF RESORT with no neighbors in back. Beautifully updated and immaculately maintained 2 bedroom/2 bath home & 1.5-car garage. Bright and airy with vaulted ceilings, updated flooring and low-maintenance yard. Great quiet location in this wonderful, friendly adult community where you can enjoy all of the amenities including golf, tennis, swimming pools, pickle-ball, billiards, restaurant, lounge, state-of-the-art fitness center and so much more. Must see to appreciate why this home would be the best way to enjoy the SunBird Golf Resort lifestyle.
Key facts
- Low maintenance yard
- No neighbors in back
- Updated flooring
Tags
Neighborhood map
What this means for you Summary
Snapshot
- This is a 2-bed/2.0-bath single-family listed at $308k.
Deal economics
- At list price, monthly cash flow is $-175 ($-2k/yr) — negative.
- To cash-flow at today's rent, offer at most $277k (10.0% below list).
- To meet the 1% rule (rent ≥ 1% of price), the offer needs to be $232k (24.6% below list).
- Recommended offer: $232k (24.6% below list) — sets the bar for 1% rule.
- Cap rate 5.6% vs local median 3.3% in Chandler — top-decile yield for the area; either an underpriced asset or a hidden risk that comps aren't pricing in. Stress-test before assuming the spread holds.
Location & tenants
- Location reads 78/100 on livability (#9 in AZ, #2,508 nationally) — a middle-class / working-renter tenant base. Strengths: employment A+, housing A+, crime A-; Watch: health & safety D, cost of living D-.
- Chandler Unified District #80 (4242) (suburban): math 49% / reading 57% proficiency, ranked #31 of 249 in AZ (top 12%) — acceptable for families but not a draw, mixed tenant base, ~2y average lease.
- Zoned schools: Knox Gifted Academy (math 90% / reading 97%, grade A+, #1 of 1,109 statewide, top 0%, 672 students, 6% FRL); Santan Junior High School (math 46% / reading 56%, grade C, #23 of 218 statewide, top 11%, 1,234 students, 13% FRL); Arizona College Prep High School (math 91% / reading 83%, grade A, #2 of 381 statewide, top 0%, 1,775 students, 7% FRL) — zoned schools average 9% FRL vs 25% district-wide (17 pts lower); this property's tenant base skews higher-income than the district average.
- Zoned-school proficiency averages 77% at this address vs 53% district-wide (+24 pts) — the actual schools serving this property are materially stronger than the Chandler Unified District #80 (4242) average implies; a family-tenant draw the district grade alone would hide.
- Market conditions: Rents rising (+3.0%/yr); 298 active listings in the ZIP; 12 comparable units currently listed for rent nearby; rentals at typical pace (median 22d on market — plan ~3-4 weeks tenant-placement turnaround); high-income renter base; 36,011 units permitted in Maricopa County in 2024 (12,801 in 5+ unit buildings).
Forward outlook
- Local home prices are declining (-3.0%/yr); year-one equity from $2k of loan paydown is wiped out by about $9k of value loss. Plan a longer hold.
- Maricopa County population projected at +38% by 2050 — long-run rental-demand tailwind backs the buy-and-hold thesis.
Negotiation context
- It's been on market 165 days — a 12% lower offer ($271k) is reasonable based on typical stale-listing flexibility.
- 2 sale attempts since 20y ago; this cycle's ask has dropped $37k (11%) from the opening price — seller is motivated, your offer sets the floor, not the list.
- Current owner paid $140k; list at $308k implies a 120% gain — meaningful room to come down on a strong offer.
Risks & watch-outs
- Climate carrying-cost: moderate wildfire risk; extreme-heat days projected 6→17/yr by 2055 (HVAC capex compounding) — expect insurance premiums to compound above CPI over the hold.
Questions for the listing agent
- What do current leases actually rent for vs. the listed asking? Can we see a recent rent roll and the last 12 months of T-12 income?
- It's been on market 165 days. Have you received any prior offers? Is the seller open to a 25% concession, seller financing, or rate buy-down credit?
- What does the HOA fee cover, when was the last increase, and are there any pending special assessments or reserve-fund shortfalls?
- Why hasn't it sold? Are there any deal-killer items the seller is aware of (foundation, flood, title, zoning, code violations)?
- Is there a deadline driving the sale (1031 exchange, divorce, estate, relocation)? That informs how much negotiation room exists.
- Schools are B-rated — typically a magnet for longer-tenancy family renters. What's the average tenant stay here, and is there a school-zone premium baked into asking?
- The area grade is low — what's the realistic commute time and amenity access for the typical tenant pool here? Any planned neighborhood developments (good or bad) we should know about?
- What's the average days-on-market for RENTAL listings here right now (not sales)? A rising rental-DOM trend means longer vacancies and softer asking-rent achievability than the comps imply.
- What's the recent tenant-quality profile in this submarket — average credit score on applications, eviction rate, late-payment / NSF rate, and stable-employment percentage? A property-management company in the area should have these aggregated.
- How much new for-sale + rental construction is in the pipeline within 1–3 miles? Heavy new supply typically softens prices + rents 12–24 months out; constrained supply supports both.
Investment metrics
- 1% rule
- 0.75% ✗
- Cap rate
- 5.61%
- Cash-on-cash
- -2.43%
- DSCR
- 0.89
- GRM
- 11.1
CMA / ARV
- ARV (median comp)
- $339,626
- List price
- $308,000
- Delta
- -9.31%
- Verdict
- FAIR
- Comps
- 20 within 1.0 mi
Show comp detail 12 sales within ~0.75 mi
| Address | Dist | Beds/Ba | Sqft | Sold | Price | $/sf | Match |
|---|---|---|---|---|---|---|---|
| 6901 S Coral Gable Dr | 0.11mi | 2/2.0 | 1,017 (-6%) | 2mo | $285,000 | $280 | 84 |
| 1701 E Kerby Farms Rd E | 0.08mi | 2/2.0 | 985 (-9%) | 1mo | $280,000 | $284 | 80 |
| 1941 E Kerby Farms Rd | 0.21mi | 2/2.0 | 1,017 (-6%) | 1mo | $294,500 | $290 | 79 |
| 1757 E Palm Beach Dr | 0.04mi | 2/2.0 | 969 (-10%) | 2mo | $306,000 | $316 | 79 |
| 1521 E Buena Vista Dr | 0.42mi | 2/2.0 | 1,065 (-2%) | 2mo | $345,000 | $324 | 76 |
| 1972 E Doral Dr | 0.46mi | 2/2.0 | 1,029 (-5%) | 1mo | $316,000 | $307 | 70 |
| 1882 E Colonial Dr | 0.31mi | 2/2.0 | 969 (-10%) | 2mo | $295,000 | $304 | 66 |
| 1440 E La Costa Dr | 0.68mi | 2/2.0 | 1,100 (+2%) | 1mo | $327,500 | $298 | 65 |
| 6541 S Cypress Point Dr | 0.40mi | 2/2.0 | 974 (-10%) | 1mo | $279,000 | $286 | 64 |
| 1822 E Riviera Dr | 0.47mi | 2/2.0 | 974 (-10%) | 1mo | $260,000 | $267 | 60 |
| 1460 E Doral Dr | 0.56mi | 2/2.0 | 1,170 (+8%) | 1mo | $329,500 | $282 | 60 |
| 1518 E Spyglass Dr | 0.46mi | 1/2.0 (-1) | 1,195 (+10%) | 1mo | $325,000 | $272 | 55 |
Match score weights: distance 35% · size 25% · config 20% · recency 20%. Top-matched comps best support the ARV.
Projected returns pro-forma
-3.0% appreciation · 3.05% rent growth · sell at horizon
- IRR
- -20.3%
- Equity multiple
- 0.29×
- Total profit
- $-60,974
- Equity at exit
- $45,924
- IRR
- -13.3%
- Equity multiple
- 0.22×
- Total profit
- $-67,121
- Equity at exit
- $26,630
Cash invested: $86,240 (down + closing). Projections, not guarantees.
Landlord ↔ Tenant lean methodology
- Overall (STATE)
- 87 Strongly Landlord-Friendly
- State Arizona
- 87 Strongly Landlord-Friendly · R+3
- County
- — inherits STATE
- City
- — inherits STATE
ZIP-level market 85249
- Home prices YoY
- -13.6%
- Rents YoY
- 3.0%
- Active inventory
- 298
- Price-to-rent
- 11.1×
Monthly cashflow live
- Estimated rent
- $2,321 high interval (Pro) →
- Mortgage (P&I)
- −$1,615
- Tax from tax record
- −$140 /mo · $1,679/yr
- Insurance
- −$128
- HOA
- −$125
- Vacancy / Maint / Mgmt
- −$487
- Net cashflow
- $-175
Break-even live
Sensitivity live
| Price | -10% $-1 | -5% $-88 | +0% $-175 | +5% $-262 | +10% $-349 |
|---|---|---|---|---|---|
| Rent | -10% $-358 | -5% $-267 | +0% $-175 | +5% $-83 | +10% $8 |
| Rate | -1.0pp $-20 | -0.5pp $-97 | base $-175 | +0.5pp $-255 | +1.0pp $-336 |
UW: 25.0% down · 7.5% · 30yr · 1.5% tax · 5.0% vac · 8.0% maint · 8.0% mgmt
Financing live
Cash to close
- Down payment
- $77,000
- Closing costs
- $9,240
- Reserves months
- —
- Total cash needed
- —
Loan-product check · same deal, 3 products live
Conventional
25% down · 7.5% · 30yr
- Down + closing
- —
- Monthly P&I
- —
- Monthly cashflow
- —
- DSCR
- —
- Eligible?
- —
Personal DTI + credit; lowest rate.
DSCR
20% down · 8.5% · 30yr
- Down + closing
- —
- Monthly P&I
- —
- Monthly cashflow
- —
- DSCR
- —
- Eligible?
- —
No personal income docs; deal must DSCR.
Hard money
10% down · 12.0% · 12mo
- Down + closing
- —
- Monthly P&I
- —
- Monthly cashflow
- —
- DSCR
- —
- Eligible?
- —
Short-term bridge; refi at stabilization.
Rent comps 12 comps
| Address | Beds | Baths | Sqft | Rent | $/sqft | DOM | Units | Dist |
|---|---|---|---|---|---|---|---|---|
| 6973 S Oakmont Dr Chandler, AZ | 2.0 | 2.0 | 1467 | $2,500 | $1.70 | 45d | 1 | 0.14mi |
| 1830 E Westchester Dr Chandler, AZ | 2.0 | 2.0 | 1017 | $1,800 | $1.77 | 45d | 1 | 0.21mi |
| 1830 E Westchester Dr Chandler, AZ | 2.0 | 2.0 | 1017 | $1,800 | $1.77 | 26d | 1 | 0.21mi |
| 6761 S Oakmont Dr Chandler, AZ | 2.0 | 2.0 | 1469 | $2,200 | $1.50 | 22d | 1 | 0.25mi |
| 6381 S Championship Dr Chandler, AZ | 2.0 | 2.0 | 1065 | $2,800 | $2.63 | 0d | 1 | 0.56mi |
| 6481 S Windstream Pl Chandler, AZ | 2.0 | 2.0 | 1258 | $3,500 | $2.78 | 0d | 1 | 0.68mi |
| 1464 E Runaway Bay Dr Chandler, AZ | 2.0 | 2.0 | 1072 | $1,975 | $1.84 | 26d | 1 | 0.71mi |
| 6242 S Cypress Point Dr Chandler, AZ | 2.0 | 2.0 | 921 | $1,700 | $1.85 | 20d | 1 | 0.72mi |
| 6450 S Nash Way Chandler, AZ | 2.0 | 2.0 | 1240 | $2,300 | $1.85 | 17d | 1 | 0.83mi |
| 1452 E Torrey Pines Ln Chandler, AZ | 2.0 | 2.0 | 1199 | $3,900 | $3.25 | 22d | 1 | 0.87mi |
| 1864 E Augusta Ave Chandler, AZ | 2.0 | 2.0 | 930 | $1,750 | $1.88 | 5d | 1 | 0.88mi |
| 5900 S Gilbert Rd Chandler, AZ | 3.0 | 2.0 | 1500 | $6,800 | $4.53 | 0d | 1 | 1.49mi |
HOA detail
- Monthly dues
- $125 · $1,500/yr
- Likely covers
- poolgym
Listing history 19 events
-
2026-06-21days on market $308,000 Active 165 DOM
-
2026-06-18days on market $308,000 Active 162 DOM
-
2026-06-17days on market $308,000 Active 161 DOM
-
2026-06-16days on market $308,000 Active 160 DOM
-
2026-06-15statusdays on market $308,000 Active 159 DOM
-
2026-06-07statusdays on market $308,000 Pending 158 DOM
-
2026-06-04days on market $308,000 Active 157 DOM
-
2026-06-03days on market $308,000 Active 156 DOM
-
2026-06-02days on market $308,000 Active 155 DOM
-
2026-06-01days on market $308,000 Active 154 DOM
-
2026-05-31days on market $308,000 Active 153 DOM
-
2026-04-23price $308,000 648-char remark
Show marketing remark (648 chars)
ANOTHER HUGE PRICE REDUCTION AND A BRAND NEW ROOF. Gorgeous EXTENDED CARMEL model in SUNBIRD GOLF RESORT with no neighbors in back. Beautifully updated and immaculately maintained 2 bedroom/2 bath home & 1.5-car garage. Bright and airy with vaulted ceilings, updated flooring and low-maintenance yard. Great quiet location in this wonderful, friendly adult community where you can enjoy all of the amenities including golf, tennis, swimming pools, pickle-ball, billiards, restaurant, lounge, state-of-the-art fitness center and so much more. Must see to appreciate why this home would be the best way to enjoy the SunBird Golf Resort lifestyle.
-
2026-02-28price $330,000 648-char remark
Show marketing remark (648 chars)
ANOTHER HUGE PRICE REDUCTION AND A BRAND NEW ROOF. Gorgeous EXTENDED CARMEL model in SUNBIRD GOLF RESORT with no neighbors in back. Beautifully updated and immaculately maintained 2 bedroom/2 bath home & 1.5-car garage. Bright and airy with vaulted ceilings, updated flooring and low-maintenance yard. Great quiet location in this wonderful, friendly adult community where you can enjoy all of the amenities including golf, tennis, swimming pools, pickle-ball, billiards, restaurant, lounge, state-of-the-art fitness center and so much more. Must see to appreciate why this home would be the best way to enjoy the SunBird Golf Resort lifestyle.
-
2025-12-29$345,000 Active 648-char remark
Show marketing remark (648 chars)
ANOTHER HUGE PRICE REDUCTION AND A BRAND NEW ROOF. Gorgeous EXTENDED CARMEL model in SUNBIRD GOLF RESORT with no neighbors in back. Beautifully updated and immaculately maintained 2 bedroom/2 bath home & 1.5-car garage. Bright and airy with vaulted ceilings, updated flooring and low-maintenance yard. Great quiet location in this wonderful, friendly adult community where you can enjoy all of the amenities including golf, tennis, swimming pools, pickle-ball, billiards, restaurant, lounge, state-of-the-art fitness center and so much more. Must see to appreciate why this home would be the best way to enjoy the SunBird Golf Resort lifestyle.
-
2011-11-15soldstatus $140,000
-
2006-06-01soldstatus $199,900
-
2006-05-31soldstatus $199,900 357-char remark
Show marketing remark (357 chars)
THIS 55+ GOLF COMMUNITY OFFERS MANY AMENITIES. THIS EXTENDED CARMEL MODEL SHOWS LIKE A MODEL!! HAS VIEW TO GREENBELT. GREAT ROOM WITH CUSTOM WINDOW COVERINGS, THAT GIVES AND OPEN AND AIRY FEELING. TILE IN ENTRY AND KITCHEN. UTILITY SINK IN GARAGE. SOFT WATER LOOP WITH PLUMBING FOR R.O. SYSTEM. CEILING FANS, WASHER AND DRYER AND REFRIGERATIOR ARE INCLUDED.
-
2006-04-19historical 357-char remark
Show marketing remark (357 chars)
THIS 55+ GOLF COMMUNITY OFFERS MANY AMENITIES. THIS EXTENDED CARMEL MODEL SHOWS LIKE A MODEL!! HAS VIEW TO GREENBELT. GREAT ROOM WITH CUSTOM WINDOW COVERINGS, THAT GIVES AND OPEN AND AIRY FEELING. TILE IN ENTRY AND KITCHEN. UTILITY SINK IN GARAGE. SOFT WATER LOOP WITH PLUMBING FOR R.O. SYSTEM. CEILING FANS, WASHER AND DRYER AND REFRIGERATIOR ARE INCLUDED.
-
2006-02-20$204,900 357-char remark
Show marketing remark (357 chars)
THIS 55+ GOLF COMMUNITY OFFERS MANY AMENITIES. THIS EXTENDED CARMEL MODEL SHOWS LIKE A MODEL!! HAS VIEW TO GREENBELT. GREAT ROOM WITH CUSTOM WINDOW COVERINGS, THAT GIVES AND OPEN AND AIRY FEELING. TILE IN ENTRY AND KITCHEN. UTILITY SINK IN GARAGE. SOFT WATER LOOP WITH PLUMBING FOR R.O. SYSTEM. CEILING FANS, WASHER AND DRYER AND REFRIGERATIOR ARE INCLUDED.
ⓘ Source: listings_history table (triggers on properties + properties_extension) + one-shot
backfill from property_details.listing_events for pre-trigger history.
Tax reassessment forecast AZ · Resets to sale price
- Current annual tax
- $1,679 · $140/mo
- Projected year-2 tax
- $2,033 · $169/mo
- Expected delta
- +$354/yr (+$30/mo · 21.1%)
ⓘ Screening estimate from a state-policy table — verify with the county assessor before closing.
Climate risk First Street
- Flood 1/10 Low FEMA zone X (shaded) · 0% chance over 30 yrs
- Wildfire 5/10 Major
- Heat 9/10 Extreme 6 d/yr ≥112°F today · 17 d/yr by 30 yrs out
- Wind 1/10 Low
- Air quality 1/10 Low 0 unhealthy d/yr today · 0 by 30 yrs out
Nearby sold comps map
Loading sold comps map…
Walkable amenities ~0.75 mi
Loading nearby amenities…
Taxation est. · year 1
- Rental income
- $27,850
- − Mortgage interest
- −$17,253
- − Property taxes
- −$1,679
- − Insurance
- −$1,540
- − Repairs & maintenance
- −$2,228
- − Management
- −$2,228
- − HOA
- −$1,500
- − Depreciation
- −$8,960
- Taxable loss
- −$7,537
- Est. tax savings @ 24.0%
- +$1,809
- After-tax cash flow
- $-290/yr
For passive investors: Depreciation is non-cash, so a rental often shows a tax loss while cash-flowing — sheltering income. Rental losses are passive: they offset passive income freely, and up to $25,000/yr can offset ordinary (W-2) income if you actively participate and your MAGI is under $100k (phasing out to $0 by $150k); unused losses carry forward. On sale, claimed depreciation is recaptured at up to 25%, and gains may owe capital-gains tax (a 1031 exchange can defer both). Figures are a year-1 estimate at your 24.0% rate — not tax advice; consult a CPA.
Schools (NCES district)
- District
- Chandler Unified District #80 (4242)
- NCES district ID
- 0401870
- Math proficiency
- 49% ▼ -8.00%
- Reading proficiency
- 57% ▼ -2.00%
- Median HH income
- $74,048
- Composite
- 47.54/100
- National rank
- #2268
- State rank
- #31 of 249 in AZ
Livability — Chandler
- Score
- 78/100
- State rank
- #9
- US rank
- #2508
Category grades
Schools grade is shown separately in the Schools card above.
Census & demographics
- Census place
- Chandler, AZ
- County
- Maricopa County · 4,537,380 people
- City population
- 299,016
- Metro
- Phoenix-Mesa-Chandler, AZ
- Population (ZIP)
- 48,746
- Household income
- $153,633
- Rent vs Own
- Severe rent burden
- 304.0
Population outlook (Maricopa County) Hauer SSP2
- Today (2025)
- 4,979,203 people
- By 2030
- 5,378,229 · +8.0%
- By 2040
- 6,156,598 · +23.6%
- By 2050
- 6,872,376 · +38.0%
- By 2075
- 8,401,270 · +68.7%
- By 2100
- 9,247,439 · +85.7%
Race, ethnicity, and origin ACS 2023
- Neighborhood character
- Predominantly White (66%)
- Race & ethnicity
- White 66% Hispanic / Latino 12% Asian 12% Two or more races 11% Black 3% Native American 1%
- Hispanic origin (detail)
- Mexican 8%
- Common ancestry
- Romanian 3% Slovak 2% Lithuanian 2%
- Foreign-born
- 13% · China, Canada, Vietnam
- Languages at home
- 84% English-only · Spanish 4% Chinese 3% Other Indo-European 3%
Political lean MEDSL · Maricopa
- 2024 margin
- Toss-up / Even · D 47.7% · R 51.2% · Other 1.1%
- 2008→2024 swing
- +7.1pp toward D · 2008: -10.6pp · 2024: -3.5pp
- All cycles
- 2024: R+3.5 2020: D+2.2 2016: R+3.5 2012: R+12.0 2008: R+10.6
Not yet ingested
- Civics
- —
Market trends
- HPI YoY
- ▼ -47.22%
- Current HPI
- 299.4196
- Rent YoY
- ▲ 3.05%
- Metro
- Phoenix-Mesa-Chandler, AZ
- State GDP YoY
- ▲ 4.54%
- F500 in state
- 20
Industry mix (Fortune 500 HQ in AZ)
| Industry | F500 HQs | Revenue |
|---|---|---|
| Technology | 2 | $13B |
|
||
| Mining / Metals | 1 | $23B |
|
||
| Environmental Services | 1 | $16B |
|
||
| Metals / Steel | 1 | $14B |
|
||
| Technology Distribution | 1 | $9B |
|
||
| Homebuilding | 1 | $8B |
|
||
Price history
+50.3% since first listed8 events — show timeline
- 2026-04-23 Price Changed $308,000 ARMLS
- 2026-02-28 Price Changed $330,000 ARMLS
- 2025-12-29 Listed $345,000 ARMLS
- 2011-11-15 Sold (Public Records) $140,000 Public Records
- 2006-06-01 Sold (Public Records) $199,900 Public Records
- 2006-05-31 Sold (MLS) $199,900 ARMLS
- 2006-04-19 Listing Removed — ARMLS
- 2006-02-20 Listed $204,900 ARMLS
Property tax history
+2.7%/yrLatest (2025): $1,679 · +1.6% YoY. Source: county tax records.
Cash-flow waterfall
monthlySold comps — $/sqft
last 12 mo · ≤1 miLoading sold comps…