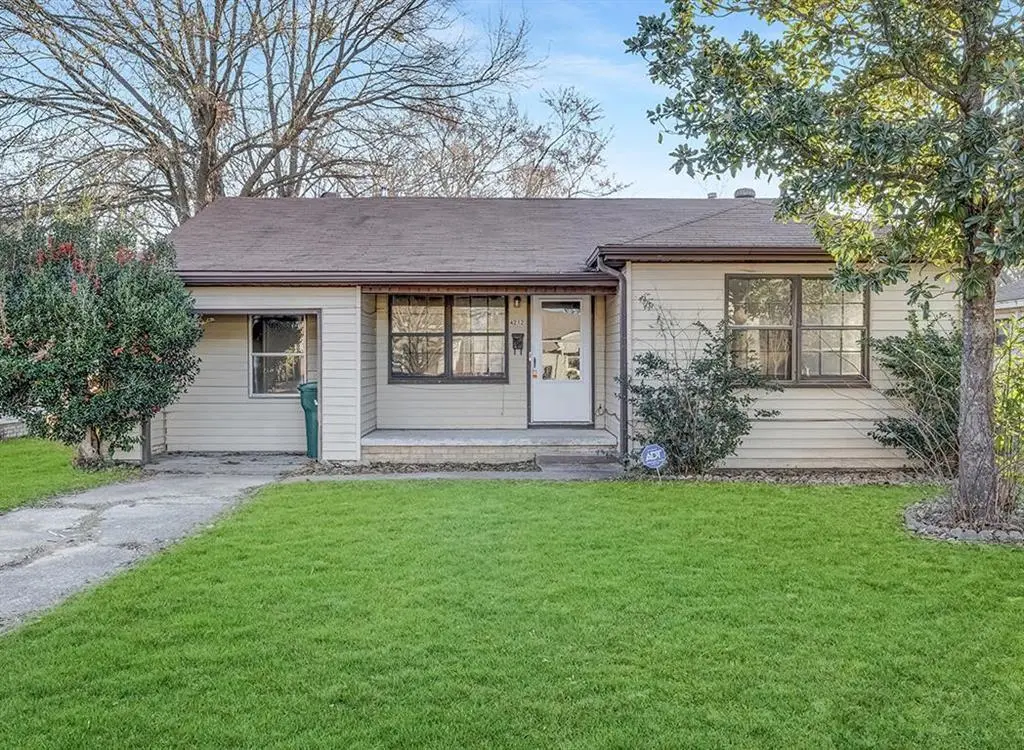
4212 Elizabeth St · Texarkana, TX
Flood risk 1/10 · Minimal
- FEMA flood zone
- X (unshaded)
- Chance of flooding over 30 yrs
- 0.0%
- Est. flood insurance / yr
- $507 – $1,088
Fire risk 1/10 · Minimal
- Est. fire insurance / yr
- $1,222 – $2,270
Heat risk 7/10 · Major
- Hot days now (above 110°F)
- 7 days/yr
- Hot days in 30 yrs
- 22 days/yr
Wind risk 4/10 · Minor
- Chance of severe wind over 30 yrs
- 22.0%
Air-quality risk 2/10 · Minimal
- Unhealthy air days now
- 1 days/yr
- Unhealthy air days in 30 yrs
- 1 days/yr
Risk factors via First Street. Map © Google.
Why this score? — see what drove the C- grade
The composite is a weighted blend of 9 inputs, each scored 0–100. Each bar is that input's sub-score; the figure is the points it added to the 100-point composite (weight × sub-score).
- Cash flow +15.6/30.0
- ARV discount +12.7/15.0
- 1% rule +5.2/10.0
- DSCR +4.8/10.0
- Livability +3.9/5.0
- Schools +3.2/10.0
- Rent growth +2.5/5.0
- Condition / age +2.5/5.0
- Appreciation +0.0/10.0
$130,000
🖨 Deal sheet 📄 Offer letter ✓ Due diligence
Listing remarks MLS
Freshly painted interiors, updated flooring, abundant natural light, large living area with charming arched entryways and ceiling fan, functional kitchen with ample cabinetry and counter space, well-sized bedrooms with good closet space, updated bathroom with modern finishes, fully fenced spacious backyard, great curb appeal, and mature trees — everything tenants love. The highest-returning property in the portfolio. Vacant and move-in ready from day one. FOR HOMEOWNERS Move straight into a home that feels brand new — fresh paint, updated floors, modern finishes, and a fully fenced backyard ready for outdoor enjoyment and gatherings. Located in Texarkana's well-connected 75503 zip with parks, dining, retail, and community events all within easy reach. Character, charm, and value in one move-in ready package. FOR INVESTORS The strongest return in the portfolio. Vacant and ready to rent, with no make-ready work needed. The 75503 zip has strong, consistent rental demand from working families and professionals, and updated homes at this price point lease fast and stay leased. The portfolio's best entry point for return potential. Part of a 20-property SFR portfolio across Texarkana and Nash. Options range from 3-bed homes to premium properties. Buy one or add multiple.
Key facts
- Flowering shrubs
- Arched doorway
- Fenced backyard
Tags
Neighborhood map
What this means for you Summary
Snapshot
- This is a 3-bed/1.0-bath single-family listed at $130k.
Deal economics
- At list price, monthly cash flow is $55 ($660/yr) — positive.
- The deal already cash-flows at list — no discount required.
- Meets the 1% rule at list price ($1k rent vs $130k).
- Recommended offer: $122k (6.0% below list) — sets the bar for market timing.
- Cap rate 6.8% vs local median 4.3% in Texarkana — top-decile yield for the area; either an underpriced asset or a hidden risk that comps aren't pricing in. Stress-test before assuming the spread holds.
Location & tenants
- Location reads 77/100 on livability (#93 in TX, #3,241 nationally) — a middle-class / working-renter tenant base. Strengths: cost of living A+, housing A+, health & safety A+; Watch: amenities D+, schools D, crime D.
- Texarkana ISD (urban): math 36% / reading 41% proficiency, ranked #472 of 826 in TX (top 57%) — families likely to look elsewhere, expect single-tenant / working-renter base with shorter leases; 64% free/reduced lunch — lower-income household profile, screen leases tightly.
- Market conditions: 298 active listings in the ZIP; 12 comparable units currently listed for rent nearby; rentals lingering (median 44d on market — plan ~5-8 weeks vacancy on turnover, expect pricing pressure); 100% of comp listings sitting > 30 days — soft ceiling on asking rent; 137 units permitted in Bowie County in 2024 (5 in 5+ unit buildings).
Forward outlook
- Local home prices are declining (-3.0%/yr); year-one equity from $899 of loan paydown is wiped out by about $4k of value loss. Plan a longer hold.
Negotiation context
- It's been on market 84 days — a 6% lower offer ($122k) is reasonable based on typical stale-listing flexibility.
- 7 sale attempts since 3y ago; this cycle's ask is 10300% above the opening price — seller raised mid-cycle; expect resistance to lowballs.
Risks & watch-outs
- Watch-outs: built in 1950 — expect roof / HVAC / electrical / plumbing capex.
- Climate carrying-cost: extreme-heat days projected 7→22/yr by 2055 (HVAC capex compounding) — expect insurance premiums to compound above CPI over the hold.
Questions for the listing agent
- It's been on market 84 days. Have you received any prior offers? Is the seller open to a 6% concession, seller financing, or rate buy-down credit?
- Built in 1950 — when were the roof, HVAC, electrical panel, plumbing, and water heater last replaced?
- Why hasn't it sold? Are there any deal-killer items the seller is aware of (foundation, flood, title, zoning, code violations)?
- Is there a deadline driving the sale (1031 exchange, divorce, estate, relocation)? That informs how much negotiation room exists.
- Schools are D-rated, which usually means shorter tenancies and higher turnover. Who's the typical renter profile here, and what's been the actual vacancy rate?
- Crime grade is D in this area — have there been break-ins, vandalism, or insurance claims at this property in the last 3 years? What carrier currently insures it and at what premium?
- What's the average days-on-market for RENTAL listings here right now (not sales)? A rising rental-DOM trend means longer vacancies and softer asking-rent achievability than the comps imply.
- What's the recent tenant-quality profile in this submarket — average credit score on applications, eviction rate, late-payment / NSF rate, and stable-employment percentage? A property-management company in the area should have these aggregated.
- How much new for-sale + rental construction is in the pipeline within 1–3 miles? Heavy new supply typically softens prices + rents 12–24 months out; constrained supply supports both.
Investment metrics
- 1% rule
- 1.02% ✓
- Cap rate
- 6.80%
- Cash-on-cash
- 1.81%
- DSCR
- 1.08
- GRM
- 8.2
CMA / ARV
- ARV (median comp)
- $146,900
- List price
- $130,000
- Delta
- -11.50%
- Verdict
- UNDERPRICED
- Comps
- 12 within 1.0 mi
Show comp detail 2 sales within ~0.75 mi
| Address | Dist | Beds/Ba | Sqft | Sold | Price | $/sf | Match |
|---|---|---|---|---|---|---|---|
| 3416 Moore Dr | 0.60mi | 3/2.0 | 1,478 (+12%) | 10mo | $114,900 | $78 | 39 |
| 406 E 36th St | 0.63mi | 3/2.0 | 1,504 (+14%) | 22mo | $167,000 | $111 | 24 |
Match score weights: distance 35% · size 25% · config 20% · recency 20%. Top-matched comps best support the ARV.
Projected returns pro-forma
-3.0% appreciation · 3.0% rent growth · sell at horizon
- IRR
- -13.3%
- Equity multiple
- 0.52×
- Total profit
- $-17,485
- Equity at exit
- $19,383
- IRR
- -4.3%
- Equity multiple
- 0.71×
- Total profit
- $-10,405
- Equity at exit
- $11,240
Cash invested: $36,400 (down + closing). Projections, not guarantees.
Landlord ↔ Tenant lean methodology
- Overall (STATE)
- 87 Strongly Landlord-Friendly
- State Texas
- 87 Strongly Landlord-Friendly · R+5
- County
- — inherits STATE
- City
- — inherits STATE
ZIP-level market 75503
- Home prices YoY
- -21.0%
- Active inventory
- 298
- Price-to-rent
- 8.2×
Monthly cashflow live
- Estimated rent
- $1,321 high interval (Pro) →
- Mortgage (P&I)
- −$682
- Tax from tax record
- −$253 /mo · $3,034/yr
- Insurance
- −$54
- HOA
- −$0
- Vacancy / Maint / Mgmt
- −$277
- Net cashflow
- $55
Break-even live
UW: 25.0% down · 7.5% · 30yr · 1.5% tax · 5.0% vac · 8.0% maint · 8.0% mgmt
Financing live
Cash to close
- Down payment
- $32,500
- Closing costs
- $3,900
- Reserves months
- —
- Total cash needed
- —
Loan-product check · same deal, 3 products live
Conventional
25% down · 7.5% · 30yr
- Down + closing
- —
- Monthly P&I
- —
- Monthly cashflow
- —
- DSCR
- —
- Eligible?
- —
Personal DTI + credit; lowest rate.
DSCR
20% down · 8.5% · 30yr
- Down + closing
- —
- Monthly P&I
- —
- Monthly cashflow
- —
- DSCR
- —
- Eligible?
- —
No personal income docs; deal must DSCR.
Hard money
10% down · 12.0% · 12mo
- Down + closing
- —
- Monthly P&I
- —
- Monthly cashflow
- —
- DSCR
- —
- Eligible?
- —
Short-term bridge; refi at stabilization.
Rent comps 12 comps
| Address | Beds | Baths | Sqft | Rent | $/sqft | DOM | Units | Dist |
|---|---|---|---|---|---|---|---|---|
| 4101 Olive St Texarkana, TX | 2.0 | 1.0 | 1400 | $1,300 | $0.93 | 43d | 1 | 0.11mi |
| 3801 Magnolia St Unit MG01 Texarkana, TX | 3.0 | 1.5 | 1200 | $1,000 | $0.83 | 43d | 1 | 0.38mi |
| 4841 N Park Rd Texarkana, TX | 2.0 | 1.5 | 1260 | $1,100 | $0.87 | 43d | 1 | 0.48mi |
| 722 W 34th St Texarkana, TX | 2.0 | 1.0 | 1298 | $1,300 | $1.00 | 43d | 1 | 0.60mi |
| 3514 Sabine Ave Texarkana, TX | 4.0 | 2.0 | 1600 | $1,845 | $1.15 | 43d | 1 | 0.67mi |
| 3302 Anthony Dr Texarkana, TX | 3.0 | 2.0 | 1726 | $850 | $0.49 | 43d | 1 | 0.71mi |
| 1504 Colorado St Texarkana, TX | 3.0 | 2.0 | 1298 | $1,595 | $1.23 | 43d | 1 | 0.79mi |
| 2101 Pecan St Texarkana, AR | 3.0 | 1.0 | 1453 | $1,125 | $0.77 | 43d | 1 | 1.24mi |
| 1400 E 35th St Unit PS6-052 Texarkana, AR | 2.0 | 2.0 | 1025 | $899 | $0.88 | 43d | 1 | 1.34mi |
| 1400 E 35th St Unit PS2-013 Texarkana, AR | 2.0 | 1.0 | 980 | $859 | $0.88 | 43d | 1 | 1.34mi |
| 1400 E 35th St Unit PS16-142 Texarkana, AR | 2.0 | 1.0 | 980 | $809 | $0.83 | 43d | 1 | 1.34mi |
| 333 Links Dr Texarkana, AR | 1.0–2.0 | 1.0–2.0 | 790 | $960 | $1.21 | 43d | 1 | 1.49mi |
Listing history 33 events
-
2026-06-19days on market $130,000 Active 84 DOM
-
2026-06-18days on market $130,000 Active 83 DOM
-
2026-06-17days on market $130,000 Active 82 DOM
-
2026-06-17price $130,000 Active 81 DOM
-
2026-06-16days on market $133,000 Active 81 DOM
-
2026-06-15days on market $133,000 Active 80 DOM
-
2026-06-14days on market $133,000 Active 78 DOM
-
2026-06-13days on market $133,000 Active 77 DOM
-
2026-06-10days on market $133,000 Active 75 DOM
-
2026-06-09days on market $133,000 Active 74 DOM
-
2026-06-08days on market $133,000 Active 73 DOM
-
2026-06-07days on market $133,000 Active 72 DOM
-
2026-06-05days on market $133,000 Active 69 DOM
-
2026-06-02days on market $133,000 Active 67 DOM
-
2026-06-01days on market $133,000 Active 66 DOM
-
2026-05-31days on market $133,000 Active 65 DOM
-
2026-05-30days on market $133,000 Active 64 DOM
-
2026-05-11$1,250
-
2026-04-18historical $1,250
-
2026-03-27$135,000 Active 1311-char remark
Show marketing remark (1311 chars)
Freshly painted interiors, updated flooring, abundant natural light, large living area with charming arched entryways and ceiling fan, functional kitchen with ample cabinetry and counter space, well-sized bedrooms with good closet space, updated bathroom with modern finishes, fully fenced spacious backyard, great curb appeal, and mature trees — everything tenants love. The highest-returning property in the portfolio. Vacant and move-in ready from day one. FOR HOMEOWNERS Move straight into a home that feels brand new — fresh paint, updated floors, modern finishes, and a fully fenced backyard ready for outdoor enjoyment and gatherings. Located in Texarkana's well-connected 75503 zip with parks, dining, retail, and community events all within easy reach. Character, charm, and value in one move-in ready package. FOR INVESTORS The strongest return in the portfolio. Vacant and ready to rent, with no make-ready work needed. The 75503 zip has strong, consistent rental demand from working families and professionals, and updated homes at this price point lease fast and stay leased. The portfolio's best entry point for return potential. Part of a 20-property SFR portfolio across Texarkana and Nash. Options range from 3-bed homes to premium properties. Buy one or add multiple.
-
2026-02-21$1,250
-
2025-07-23soldstatus
-
2024-08-11historical
-
2024-06-15status Active
-
2024-06-12price $110,000
-
2024-06-12price $110,000
-
2024-05-08price $115,000
-
2024-05-04price $115,000
-
2024-01-23price $120,000
-
2023-12-15$125,000 Active
-
2023-12-14$125,000 New Listing
-
2023-12-13$125,000 Active
-
2000-04-06soldstatus
ⓘ Source: listings_history table (triggers on properties + properties_extension) + one-shot
backfill from property_details.listing_events for pre-trigger history.
Tax reassessment forecast TX · Resets to sale price
- Current annual tax
- $3,034 · $253/mo
- Projected year-2 tax
- $3,034 · $253/mo
- Expected delta
- $0/yr ($0/mo · 0.0%)
ⓘ Screening estimate from a state-policy table — verify with the county assessor before closing.
Climate risk First Street
- Flood 1/10 Low FEMA zone X (unshaded) · 0% chance over 30 yrs
- Wildfire 1/10 Low
- Heat 7/10 Severe 7 d/yr ≥110°F today · 22 d/yr by 30 yrs out
- Wind 4/10 Moderate 22% chance of damaging wind over 30 yrs
- Air quality 2/10 Low 1 unhealthy d/yr today · 1 by 30 yrs out
Nearby sold comps map
Loading sold comps map…
Walkable amenities ~0.75 mi
Loading nearby amenities…
Taxation est. · year 1
- Rental income
- $15,855
- − Mortgage interest
- −$7,282
- − Property taxes
- −$3,034
- − Insurance
- −$650
- − Repairs & maintenance
- −$1,268
- − Management
- −$1,268
- − Depreciation
- −$3,782
- Taxable loss
- −$1,430
- Est. tax savings @ 24.0%
- +$343
- After-tax cash flow
- $1,004/yr
For passive investors: Depreciation is non-cash, so a rental often shows a tax loss while cash-flowing — sheltering income. Rental losses are passive: they offset passive income freely, and up to $25,000/yr can offset ordinary (W-2) income if you actively participate and your MAGI is under $100k (phasing out to $0 by $150k); unused losses carry forward. On sale, claimed depreciation is recaptured at up to 25%, and gains may owe capital-gains tax (a 1031 exchange can defer both). Figures are a year-1 estimate at your 24.0% rate — not tax advice; consult a CPA.
Schools (NCES district)
- District
- Texarkana ISD
- NCES district ID
- 4842480
- Math proficiency
- 36% ▼ -7.00%
- Reading proficiency
- 41% ▼ -1.00%
- Median HH income
- $35,692
- Composite
- 31.87/100
- National rank
- #5867
- State rank
- #472 of 826 in TX
Livability — Texarkana
- Score
- 77/100
- State rank
- #93
- US rank
- #3241
Category grades
Schools grade is shown separately in the Schools card above.
Census & demographics
- Census place
- Texarkana, TX
- County
- Bowie County · 61,238 people
- City population
- 61,238
- Metro
- Texarkana, TX-AR
- Population (ZIP)
- 26,372
- Household income
- $72,159
- Rent vs Own
- Severe rent burden
- 773.0
Population outlook (Bowie County) Hauer SSP2
- Today (2025)
- 94,699 people
- By 2030
- 94,824 · +0.1%
- By 2040
- 94,870 · +0.2%
- By 2050
- 93,686 · -1.1%
- By 2075
- 90,082 · -4.9%
- By 2100
- 76,579 · -19.1%
Race, ethnicity, and origin ACS 2023
- Neighborhood character
- Majority White (63%)
- Race & ethnicity
- White 63% Black 23% Hispanic / Latino 7% Two or more races 5% Asian 3%
- Hispanic origin (detail)
- Mexican 6%
- Common ancestry
- Slovak 2% Serbian 1% Lithuanian 1%
- Foreign-born
- 5% · Canada, Vietnam, South Korea
- Languages at home
- 92% English-only · Spanish 6% Other Indo-European 1%
Political lean MEDSL · Bowie
- 2024 margin
- Solid R (+48.7) · D 25.3% · R 74.0%
- 2008→2024 swing
- -10.8pp toward R · 2008: -37.9pp · 2024: -48.7pp
- All cycles
- 2024: R+48.7 2020: R+42.8 2016: R+46.6 2012: R+41.5 2008: R+37.9
Not yet ingested
- Civics
- —
Market trends
- HPI YoY
- ▼ -48.09%
- Current HPI
- 181.3052
- Rent YoY
- —
- Metro
- Texarkana, TX-AR
- State GDP YoY
- ▲ 3.95%
- F500 in state
- 110
Industry mix (Fortune 500 HQ in TX)
| Industry | F500 HQs | Revenue |
|---|---|---|
| Energy | 16 | $1,198B |
|
||
| Technology | 5 | $198B |
|
||
| Engineering / Construction | 4 | $72B |
|
||
| Energy Services | 3 | $60B |
|
||
| Utilities | 3 | $41B |
|
||
| Healthcare | 2 | $330B |
|
||
Price history
-99.0% since first listed16 events — show timeline
- 2026-05-11 Listed for Rent $1,250 Avail
- 2026-04-18 Rental Removed $1,250 Avail
- 2026-03-27 Listed $135,000 NTREIS
- 2026-02-21 Listed for Rent $1,250 Avail
- 2025-07-23 Sold (Public Records) — Public Records
- 2024-08-11 Listing Removed — CARMLS
- 2024-06-15 Relisted — TBOR
- 2024-06-12 Price Changed $110,000 CARMLS
- 2024-06-12 Price Changed $110,000 TBOR
- 2024-05-08 Price Changed $115,000 GTAR
- 2024-05-04 Price Changed $115,000 TBOR
- 2024-01-23 Price Changed $120,000 TBOR
- 2023-12-15 Listed $125,000 GTAR
- 2023-12-14 Listed $125,000 CARMLS
- 2023-12-13 Listed $125,000 TBOR
- 2000-04-06 Sold (Public Records) — Public Records
Property tax history
+7.4%/yrLatest (2025): $3,034 · +24.2% YoY. Source: county tax records.
Cash-flow waterfall
monthlySold comps — $/sqft
last 12 mo · ≤1 miLoading sold comps…