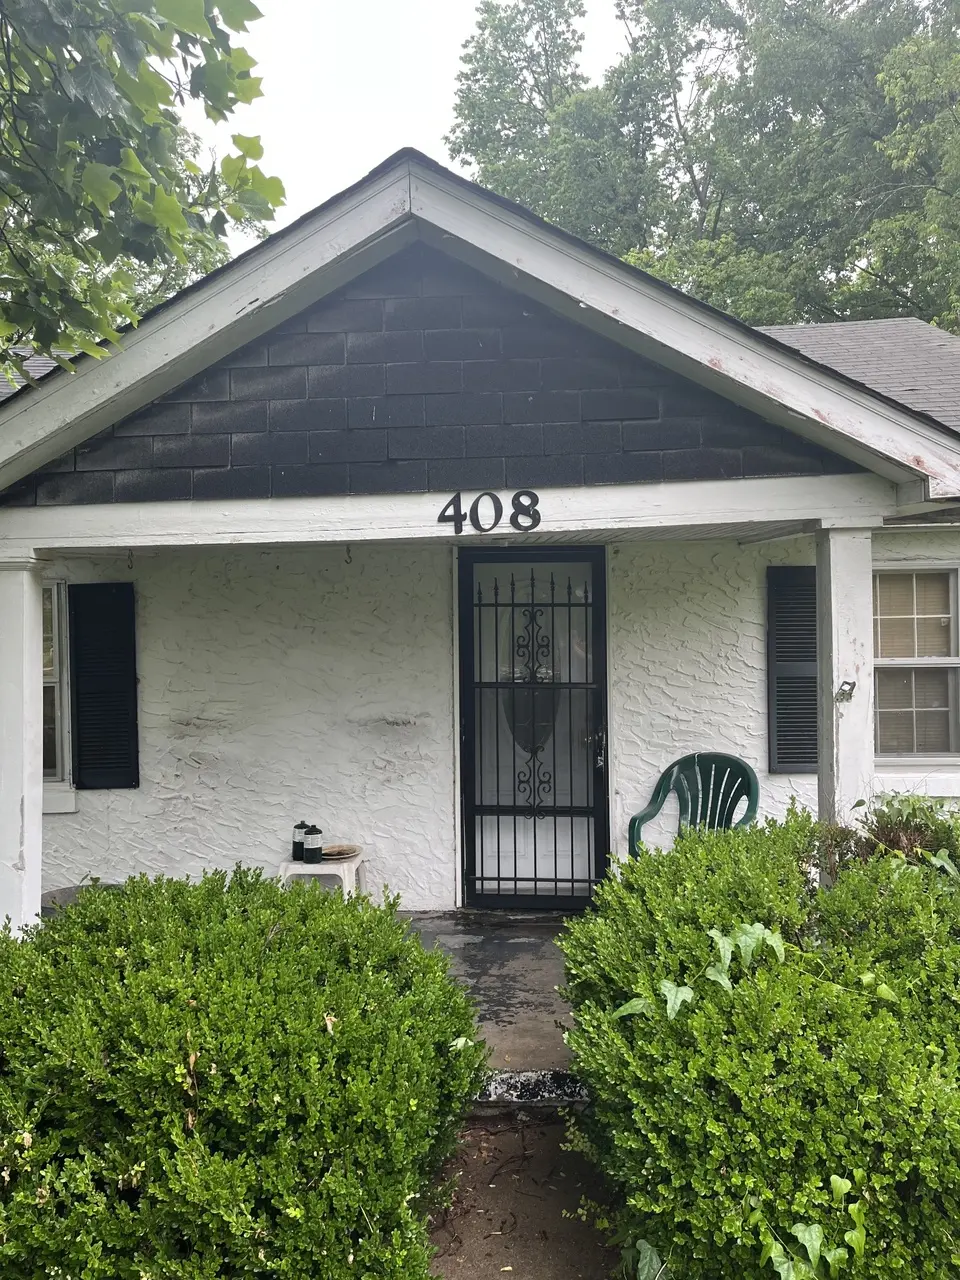
408 W 13th St · Columbia, TN
Flood risk 1/10 · Minimal
- FEMA flood zone
- X (unshaded)
- Chance of flooding over 30 yrs
- 0.0%
- Est. flood insurance / yr
- $507 – $1,088
Fire risk 3/10 · Minor
- Est. fire insurance / yr
- $949 – $1,763
Heat risk 5/10 · Moderate
- Hot days now (above 106°F)
- 7 days/yr
- Hot days in 30 yrs
- 18 days/yr
Wind risk 4/10 · Minor
- Chance of severe wind over 30 yrs
- 14.0%
Air-quality risk 1/10 · Minimal
- Unhealthy air days now
- 0 days/yr
- Unhealthy air days in 30 yrs
- 0 days/yr
Risk factors via First Street. Map © Google.
Why this score? — see what drove the B- grade
The composite is a weighted blend of 9 inputs, each scored 0–100. Each bar is that input's sub-score; the figure is the points it added to the 100-point composite (weight × sub-score).
- Cash flow +30.0/30.0
- 1% rule +10.0/10.0
- DSCR +10.0/10.0
- ARV discount +7.5/15.0
- Rent growth +3.7/5.0
- Livability +3.2/5.0
- Condition / age +2.5/5.0
- Schools +1.8/10.0
- Appreciation +0.0/10.0
$65,000
🖨 Deal sheet 📄 Offer letter ✓ Due diligence
Listing remarks
Investors! This is an excellent investment opportunity in the heart of Columbia. This property features a substantial lot measuring 59 feet by 206 feet and is located just minutes from downtown. Please note that the house requires a full renovation. The property is being sold strictly as-is, and the sale includes all remaining furniture and contents currently on-site. Due to high interest, we are going live today and will accept all offers by Wednesday at 2:00 PM. The seller's estate will review the highest and best. The seller is: The Estate of Johnny Levell Akins.
Key facts
- 0.26 acre lot
- Built 1940
- Listed 3 days
Property features AI
Finance
- Financial info: Annual tax amount reported (see listing)
Exterior
- Parking: No covered spaces; No marked parking spaces
- Utilities: Public water; Public sewer; Water available
- Home design: Single-family residence; One story; Existing year built
- Construction: Vinyl siding
- Exterior features: Lot approximately 0.26 acres; Lot dimensions about 60 x 200
Interior
- Kitchen: Electric oven
- Bedrooms: 2 bedrooms (both on the main level)
- Flooring: Other
- Bathrooms: 1 full bathroom
- Heating & cooling: Heating present (type: Other); Cooling present (type: Other)
- Interior features: Electric oven; Other flooring
Neighborhood map
What this means for you Summary
Snapshot
- This is a 2-bed/1.0-bath single-family listed at $65k.
Deal economics
- At list price, monthly cash flow is $533 ($6k/yr) — positive.
- The deal already cash-flows at list — no discount required.
- Meets the 1% rule at list price ($1k rent vs $65k).
- Cap rate 16.1% vs local median 2.8% in Columbia — top-decile yield for the area; either an underpriced asset or a hidden risk that comps aren't pricing in. Stress-test before assuming the spread holds.
Location & tenants
- Location reads 63/100 on livability (#207 in TN) — a middle-class / working-renter tenant base. Strengths: cost of living A+, housing A+; Watch: employment C-, health & safety C-, crime F.
- Maury County (town): math 19% / reading 21% proficiency, ranked #108 of 139 in TN (top 78%) — low school quality limits family demand, transient renter base, plan for 1-2y turnover.
- Zoned schools: Highland Park Elementary (math 22% / reading 17%, grade F, #654 of 952 statewide, top 72%, 291 students, 0% FRL); Columbia Central High School (math 7% / reading 27%, grade F, #225 of 332 statewide, top 69%, 1,474 students, 0% FRL) — zoned schools average 0% FRL vs 48% district-wide (48 pts lower); this property's tenant base skews higher-income than the district average.
- Market conditions: Rents rising fast (+5.0%/yr); 1118 active listings in the ZIP; 26 comparable units currently listed for rent nearby; rentals at typical pace (median 24d on market — plan ~3-4 weeks tenant-placement turnaround); 46% of comp listings sitting > 30 days — soft ceiling on asking rent; 1,650 units permitted in Maury County in 2024 (60 in 5+ unit buildings).
Forward outlook
- Local home prices are declining (-3.0%/yr); year-one equity from $449 of loan paydown is wiped out by about $2k of value loss. Plan a longer hold.
- Maury County population projected at +34% by 2050 — long-run rental-demand tailwind backs the buy-and-hold thesis.
- At projected returns (-3.0% appreciation + 5.0% rent growth), your $18k cash investment doubles in ~4 years — after that, you're playing with house money.
Negotiation context
- Only 3 days on market — expect competitive offers; lowballing is unlikely to land.
Risks & watch-outs
- Watch-outs: built in 1940 — expect roof / HVAC / electrical / plumbing capex.
- Climate carrying-cost: extreme-heat days projected 7→18/yr by 2055 (HVAC capex compounding) — expect insurance premiums to compound above CPI over the hold.
Questions for the listing agent
- Built in 1940 — when were the roof, HVAC, electrical panel, plumbing, and water heater last replaced?
- Is there a deadline driving the sale (1031 exchange, divorce, estate, relocation)? That informs how much negotiation room exists.
- Schools are F-rated, which usually means shorter tenancies and higher turnover. Who's the typical renter profile here, and what's been the actual vacancy rate?
- Crime grade is F in this area — have there been break-ins, vandalism, or insurance claims at this property in the last 3 years? What carrier currently insures it and at what premium?
- What's the average days-on-market for RENTAL listings here right now (not sales)? A rising rental-DOM trend means longer vacancies and softer asking-rent achievability than the comps imply.
- What's the recent tenant-quality profile in this submarket — average credit score on applications, eviction rate, late-payment / NSF rate, and stable-employment percentage? A property-management company in the area should have these aggregated.
- How much new for-sale + rental construction is in the pipeline within 1–3 miles? Heavy new supply typically softens prices + rents 12–24 months out; constrained supply supports both.
Investment metrics
- 1% rule
- 1.90% ✓
- Cap rate
- 16.14%
- Cash-on-cash
- 35.16%
- DSCR
- 2.56
- GRM
- 4.4
CMA / ARV
- ARV (on-the-fly)
- $210,250
- Comps found
- 12
Show comp detail 12 sales within ~0.75 mi
| Address | Dist | Beds/Ba | Sqft | Sold | Price | $/sf | Match |
|---|---|---|---|---|---|---|---|
| 1812 Cherokee Dr | 0.39mi | 2/1.0 | 802 (-5%) | 1mo | $240,224 | $300 | 74 |
| 408 Green Acres Dr | 0.47mi | 2/1.0 | 844 (+0%) | 6mo | $255,000 | $302 | 73 |
| 1610 Blocker Cir | 0.36mi | 2/1.0 | 900 (+7%) | 1mo | $217,000 | $241 | 71 |
| 412 W 13th St | 0.03mi | 3/1.0 (+1) | 936 (+11%) | 7mo | $269,900 | $288 | 69 |
| 1803 Dimple Ct | 0.37mi | 2/1.0 | 876 (+4%) | 9mo | $206,000 | $235 | 68 |
| 1004 Billy Lee St | 0.47mi | 2/1.0 | 780 (-7%) | 1mo | $195,000 | $250 | 65 |
| 1509 Bailey St | 0.47mi | 2/1.0 | 893 (+6%) | 6mo | $90,000 | $101 | 62 |
| 807 W 9th St | 0.51mi | 3/1.0 (+1) | 891 (+6%) | 0mo | $185,000 | $208 | 61 |
| 311 E 17th St | 0.62mi | 2/2.0 | 833 (-1%) | 6mo | $190,000 | $228 | 60 |
| 1815 Dimple Ct | 0.43mi | 2/1.0 | 938 (+12%) | 2mo | $234,000 | $249 | 60 |
| 1808 Parkway Ave | 0.61mi | 2/1.0 | 750 (-11%) | 1mo | $212,500 | $283 | 53 |
| 807 Brown St | 0.73mi | 2/1.0 | 742 (-12%) | 6mo | $235,000 | $317 | 41 |
Match score weights: distance 35% · size 25% · config 20% · recency 20%. Top-matched comps best support the ARV.
Projected returns pro-forma
-3.0% appreciation · 4.97% rent growth · sell at horizon
- IRR
- 32.9%
- Equity multiple
- 2.43×
- Total profit
- $25,947
- Equity at exit
- $9,692
- IRR
- 41.0%
- Equity multiple
- 5.23×
- Total profit
- $77,072
- Equity at exit
- $5,620
Cash invested: $18,200 (down + closing). Projections, not guarantees.
Landlord ↔ Tenant lean methodology
- Overall (STATE)
- 87 Strongly Landlord-Friendly
- State Tennessee
- 87 Strongly Landlord-Friendly · R+13
- County
- — inherits STATE
- City
- — inherits STATE
ZIP-level market 38401
- Home prices YoY
- -22.7%
- Rents YoY
- 5.0%
- Active inventory
- 1118
- Price-to-rent
- 4.4×
Monthly cashflow live
- Estimated rent
- $1,237 high interval (Pro) →
- Mortgage (P&I)
- −$341
- Tax from tax record
- −$76 /mo · $912/yr
- Insurance
- −$27
- HOA
- −$0
- Vacancy / Maint / Mgmt
- −$260
- Net cashflow
- $533
Break-even live
UW: 25.0% down · 7.5% · 30yr · 1.5% tax · 5.0% vac · 8.0% maint · 8.0% mgmt
Financing live
Cash to close
- Down payment
- $16,250
- Closing costs
- $1,950
- Reserves months
- —
- Total cash needed
- —
Loan-product check · same deal, 3 products live
Conventional
25% down · 7.5% · 30yr
- Down + closing
- —
- Monthly P&I
- —
- Monthly cashflow
- —
- DSCR
- —
- Eligible?
- —
Personal DTI + credit; lowest rate.
DSCR
20% down · 8.5% · 30yr
- Down + closing
- —
- Monthly P&I
- —
- Monthly cashflow
- —
- DSCR
- —
- Eligible?
- —
No personal income docs; deal must DSCR.
Hard money
10% down · 12.0% · 12mo
- Down + closing
- —
- Monthly P&I
- —
- Monthly cashflow
- —
- DSCR
- —
- Eligible?
- —
Short-term bridge; refi at stabilization.
Rent comps 26 comps
| Address | Beds | Baths | Sqft | Rent | $/sqft | DOM | Units | Dist |
|---|---|---|---|---|---|---|---|---|
| 322 W 12th St Unit 1 Columbia, TN | 1.0 | 1.0 | 790 | $1,100 | $1.39 | 2d | 1 | 0.09mi |
| 1214 School St Columbia, TN | 2.0 | 1.0 | 1036 | $1,300 | $1.25 | 23d | 1 | 0.12mi |
| 1315 S High St Columbia, TN | 1.0 | 1.0 | 800 | $1,000 | $1.25 | 4d | 1 | 0.22mi |
| 109 E 15th St Columbia, TN | 2.0 | 1.0 | 812 | $1,500 | $1.85 | 43d | 1 | 0.40mi |
| 917 S High St Unit A Columbia, TN | 1.0 | 1.0 | 700 | $1,083 | $1.55 | 43d | 1 | 0.47mi |
| 207 E 16th St Unit A Columbia, TN | 1.0 | 1.0 | 796 | $700 | $0.88 | 43d | 1 | 0.55mi |
| 220 E 14th St Unit A Columbia, TN | 1.0 | 1.0 | 537 | $700 | $1.30 | 43d | 1 | 0.56mi |
| 216 E 15th St Columbia, TN | 1.0 | 1.0 | 558 | $700 | $1.25 | 43d | 1 | 0.57mi |
| 1510 Whatley St Columbia, TN | 2.0 | 1.0 | 832 | $1,050 | $1.26 | 12d | 1 | 0.58mi |
| 810 Trotwood Ave Unit C Columbia, TN | 1.0 | 1.0 | 900 | $1,300 | $1.44 | 43d | 1 | 0.69mi |
| 314 E 18th St Columbia, TN | 3.0 | 1.0 | 988 | $999 | $1.01 | 14d | 1 | 0.73mi |
| 212 W 6th St Unit 8 Columbia, TN | 1.0 | 1.0 | 677 | $1,150 | $1.70 | 43d | 1 | 0.74mi |
| 1901 Cherry St Columbia, TN | 2.0 | 1.0 | 676 | $1,650 | $2.44 | 43d | 1 | 0.81mi |
| 314 E Highland Dr Columbia, TN | 2.0 | 1.0 | 692 | $1,150 | $1.66 | 43d | 1 | 0.88mi |
| 908 Mapleash Ave Columbia, TN | 3.0 | 2.0 | 1112 | $1,750 | $1.57 | 17d | 1 | 0.94mi |
| 208 Hill St Columbia, TN | 2.0 | 1.0 | 901 | $1,450 | $1.61 | 23d | 1 | 1.14mi |
| 203 Stewart St Unit a Columbia, TN | 2.0 | 1.0 | 850 | $1,200 | $1.41 | 20d | 1 | 1.28mi |
| 103 Naydonlin Dr Unit B Columbia, TN | 2.0 | 1.0 | 712 | $1,100 | $1.54 | 43d | 1 | 1.30mi |
| 1106 W 7th St Unit 2 Columbia, TN | 2.0 | 1.0 | 760 | $1,000 | $1.32 | 43d | 1 | 1.33mi |
| 1106 W 7th St Unit 3 Bedroom Columbia, TN | 3.0 | 1.0 | 760 | $1,200 | $1.58 | 3d | 1 | 1.33mi |
| 100 Stonebridge Way Columbia, TN | 2.0–3.0 | 2.0 | 1067 | $1,045 | $0.98 | 1d | 4 | 1.37mi |
| 2516 Pitts Ct Columbia, TN | 1.0–4.0 | 1.0–2.0 | 896 | $1,533 | $1.71 | 4d | 6 | 1.38mi |
| 2701 McIntosh Dr Unit A Columbia, TN | 2.0 | 1.5 | 1008 | $1,250 | $1.24 | 17d | 1 | 1.45mi |
| 2701 McIntosh Dr Unit A Columbia, TN | 2.0 | 1.5 | 1008 | $1,250 | $1.24 | 14d | 1 | 1.45mi |
| 1955 Union Pl Columbia, TN | 1.0–3.0 | 1.0–2.5 | 923 | $1,530 | $1.66 | 1d | 12 | 1.46mi |
| 124 7th Ave Columbia, TN | 1.0 | 1.0 | 650 | $900 | $1.38 | 43d | 1 | 1.49mi |
Listing history 3 events
-
2026-05-14status Pending
-
2026-05-11$65,000 Active
-
2026-05-08historical $65,000
ⓘ Source: listings_history table (triggers on properties + properties_extension) + one-shot
backfill from property_details.listing_events for pre-trigger history.
Tax reassessment forecast TN · Resets to sale price
- Current annual tax
- $912 · $76/mo
- Projected year-2 tax
- $912 · $76/mo
- Expected delta
- $0/yr ($0/mo · 0.0%)
ⓘ Screening estimate from a state-policy table — verify with the county assessor before closing.
Climate risk First Street
- Flood 1/10 Low FEMA zone X (unshaded) · 0% chance over 30 yrs
- Wildfire 3/10 Moderate
- Heat 5/10 Major 7 d/yr ≥106°F today · 18 d/yr by 30 yrs out
- Wind 4/10 Moderate 14% chance of damaging wind over 30 yrs
- Air quality 1/10 Low 0 unhealthy d/yr today · 0 by 30 yrs out
Nearby sold comps map
Loading sold comps map…
Walkable amenities ~0.75 mi
Loading nearby amenities…
Taxation est. · year 1
- Rental income
- $14,844
- − Mortgage interest
- −$3,641
- − Property taxes
- −$912
- − Insurance
- −$325
- − Repairs & maintenance
- −$1,188
- − Management
- −$1,188
- − Depreciation
- −$1,891
- Taxable income
- $5,700
- Est. tax owed @ 24.0%
- −$1,368
- After-tax cash flow
- $5,031/yr
For passive investors: Depreciation is non-cash, so a rental often shows a tax loss while cash-flowing — sheltering income. Rental losses are passive: they offset passive income freely, and up to $25,000/yr can offset ordinary (W-2) income if you actively participate and your MAGI is under $100k (phasing out to $0 by $150k); unused losses carry forward. On sale, claimed depreciation is recaptured at up to 25%, and gains may owe capital-gains tax (a 1031 exchange can defer both). Figures are a year-1 estimate at your 24.0% rate — not tax advice; consult a CPA.
Schools (NCES district)
- District
- Maury County
- NCES district ID
- 4702760
- Math proficiency
- 19% ▼ -5.00%
- Reading proficiency
- 21% ▼ -4.00%
- Median HH income
- $47,668
- Composite
- 17.69/100
- National rank
- #9024
- State rank
- #108 of 139 in TN
Livability — Columbia
- Score
- 63/100
- State rank
- #207
- US rank
- #16090
Category grades
Schools grade is shown separately in the Schools card above.
Census & demographics
- Census place
- Columbia, TN
- County
- Maury County · 121,382 people
- City population
- 67,482
- Metro
- Nashville-Davidson--Murfreesboro--Franklin, TN
- Population (ZIP)
- 67,482
- Household income
- $68,475
- Rent vs Own
- Severe rent burden
- 2026.0
Population outlook (Maury County) Hauer SSP2
- Today (2025)
- 102,894 people
- By 2030
- 110,269 · +7.2%
- By 2040
- 124,426 · +20.9%
- By 2050
- 137,543 · +33.7%
- By 2075
- 167,438 · +62.7%
- By 2100
- 184,489 · +79.3%
Race, ethnicity, and origin ACS 2023
- Neighborhood character
- Predominantly White (74%)
- Race & ethnicity
- White 74% Black 12% Hispanic / Latino 9% Two or more races 7%
- Hispanic origin (detail)
- Mexican 7%
- Common ancestry
- Slovak 1% Serbian 1% Romanian 1%
- Foreign-born
- 4% · Canada
- Languages at home
- 94% English-only · Spanish 5%
Political lean MEDSL · Maury
- 2024 margin
- Solid R (+44.6) · D 27.1% · R 71.8% · Other 1.1%
- 2008→2024 swing
- -6.2pp toward R · 2008: -38.4pp · 2024: -44.6pp
- All cycles
- 2024: R+44.6 2020: R+36.5 2016: R+39.2 2012: R+26.9 2008: R+38.4
Not yet ingested
- Civics
- —
Market trends
- HPI YoY
- ▼ -100.75%
- Current HPI
- 343.0362
- Rent YoY
- ▲ 4.97%
- Metro
- Nashville-Davidson--Murfreesboro--Franklin, TN
- State GDP YoY
- ▲ 2.78%
- F500 in state
- 22
Industry mix (Fortune 500 HQ in TN)
| Industry | F500 HQs | Revenue |
|---|---|---|
| Healthcare | 3 | $91B |
|
||
| Retail | 3 | $72B |
|
||
| Transportation / Logistics | 1 | $88B |
|
||
| Paper / Packaging | 1 | $19B |
|
||
| Insurance | 1 | $13B |
|
||
| Energy | 1 | $12B |
|
||
Price history
+0.0% since first listed3 events — show timeline
- 2026-05-14 Pending — REALTRACS as Distributed by MLS Grid
- 2026-05-11 Listed $65,000 REALTRACS as Distributed by MLS Grid
- 2026-05-08 Coming Soon $65,000 REALTRACS as Distributed by MLS Grid
Property tax history
+7.1%/yrLatest (2025): $912 · +0.0% YoY. Source: county tax records.
Cash-flow waterfall
monthlySold comps — $/sqft
last 12 mo · ≤1 miLoading sold comps…