1522 Navajo Pl · Colorado Springs, CO
Flood risk 1/10 · Minimal
- FEMA flood zone
- X (unshaded)
- Chance of flooding over 30 yrs
- 0.0%
- Est. flood insurance / yr
- $473 – $860
Fire risk 2/10 · Minimal
- Est. fire insurance / yr
- $939 – $1,743
Heat risk 2/10 · Minimal
- Hot days now (above 90°F)
- 6 days/yr
- Hot days in 30 yrs
- 16 days/yr
Wind risk 2/10 · Minimal
- Chance of severe wind over 30 yrs
- —
Air-quality risk 1/10 · Minimal
- Unhealthy air days now
- 0 days/yr
- Unhealthy air days in 30 yrs
- 0 days/yr
Risk factors via First Street. Map © Google.
Why this score? — see what drove the B- grade
The composite is a weighted blend of 9 inputs, each scored 0–100. Each bar is that input's sub-score; the figure is the points it added to the 100-point composite (weight × sub-score).
- Cash flow +30.0/30.0
- 1% rule +10.0/10.0
- DSCR +10.0/10.0
- ARV discount +7.5/15.0
- Livability +3.9/5.0
- Rent growth +3.1/5.0
- Schools +2.5/10.0
- Condition / age +2.5/5.0
- Appreciation +0.0/10.0
$125,000
🖨 Deal sheet 📄 Offer letter ✓ Due diligence
Listing remarks
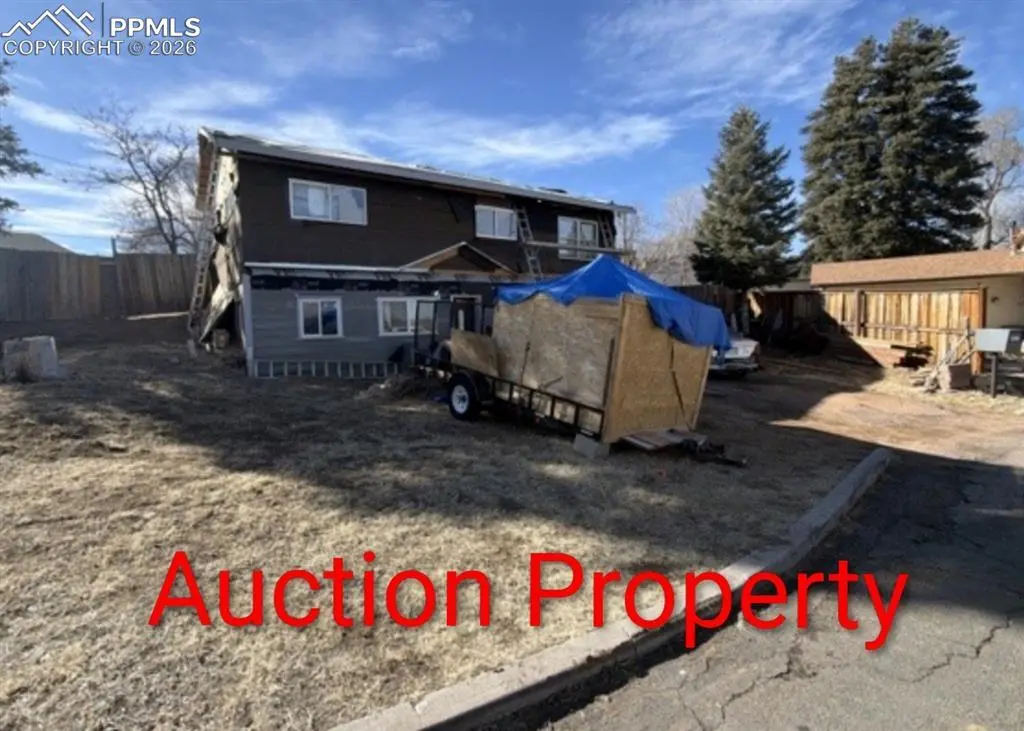
* * "Auction Property * * * This property has been placed in an upcoming RESERVE auction. Property is subject to a buyer's premium pursuant to the Auction Participation Agreement. The list price is the opening bid only and does not indicate the reserve or sale price. NO ACCESS granted. DO NOT DISTURB occupants. Room and home information pulled from past MLS's and may not apply. Condition unknown.
Key facts
- 9,100 sq ft lot
- Built 1955
- Listed 69 days
Property features AI
Finance
- Financial info: Cash terms
- HOA & community: Homeowners association with covenants (no fee applicable)
Exterior
- Utilities: See property description for water and other utilities
- Home design: Single-family home; Existing home; Basement fully finished
- Construction: Wood-frame structure; Composite shingle roof; Full basement (100% finished)
- Exterior features: Level lot
Interior
- Bedrooms: At least one main-floor bedroom; Basement primary bedroom
- Bathrooms: 1 full bath; 1 three-quarter bath
- Heating & cooling: See property description for heating and cooling specifics
- Interior features: Cooling and heating details provided in property description
Neighborhood map
What this means for you Summary
Snapshot
- This is a 3-bed/2.0-bath single-family listed at $125k.
Deal economics
- At list price, monthly cash flow is $887 ($11k/yr) — positive.
- The deal already cash-flows at list — no discount required.
- Meets the 1% rule at list price ($2k rent vs $125k).
- Recommended offer: $118k (6.0% below list) — sets the bar for market timing.
- Cap rate 14.8% vs local median 3.3% in Colorado Springs — top-decile yield for the area; either an underpriced asset or a hidden risk that comps aren't pricing in. Stress-test before assuming the spread holds.
Location & tenants
- Location reads 78/100 on livability (#23 in CO, #2,639 nationally) — a middle-class / working-renter tenant base. Strengths: amenities A+, housing A+, health & safety A+; Watch: cost of living C-, crime F.
- Colorado Springs School District No. 11 In The County Of E (urban): math 20% / reading 37% proficiency, ranked #56 of 86 in CO (top 65%) — low school quality limits family demand, transient renter base, plan for 1-2y turnover.
- Market conditions: Rents rising (+2.3%/yr); 148 active listings in the ZIP; 22 comparable units currently listed for rent nearby; rentals leasing fast (median 4d on market — plan ~1-2 weeks tenant-placement turnaround); 3,906 units permitted in El Paso County in 2024 (872 in 5+ unit buildings).
- This rent runs 41% of the median local income ($63k/yr) — at the standard rent-burdened threshold; future hikes will face affordability resistance.
Forward outlook
- Local home prices are declining (-3.0%/yr); year-one equity from $864 of loan paydown is wiped out by about $4k of value loss. Plan a longer hold.
- El Paso County population projected at +28% by 2050 — long-run rental-demand tailwind backs the buy-and-hold thesis.
- At projected returns (-3.0% appreciation + 2.3% rent growth), your $35k cash investment doubles in ~5 years — after that, you're playing with house money.
Negotiation context
- It's been on market 69 days — a 6% lower offer ($118k) is reasonable based on typical stale-listing flexibility.
Risks & watch-outs
- Watch-outs: built in 1955 — expect roof / HVAC / electrical / plumbing capex.
Questions for the listing agent
- It's been on market 69 days. Have you received any prior offers? Is the seller open to a 6% concession, seller financing, or rate buy-down credit?
- Built in 1955 — when were the roof, HVAC, electrical panel, plumbing, and water heater last replaced?
- Why hasn't it sold? Are there any deal-killer items the seller is aware of (foundation, flood, title, zoning, code violations)?
- Is there a deadline driving the sale (1031 exchange, divorce, estate, relocation)? That informs how much negotiation room exists.
- Schools are B-rated — typically a magnet for longer-tenancy family renters. What's the average tenant stay here, and is there a school-zone premium baked into asking?
- Crime grade is F in this area — have there been break-ins, vandalism, or insurance claims at this property in the last 3 years? What carrier currently insures it and at what premium?
- What's the average days-on-market for RENTAL listings here right now (not sales)? A rising rental-DOM trend means longer vacancies and softer asking-rent achievability than the comps imply.
- What's the recent tenant-quality profile in this submarket — average credit score on applications, eviction rate, late-payment / NSF rate, and stable-employment percentage? A property-management company in the area should have these aggregated.
- How much new for-sale + rental construction is in the pipeline within 1–3 miles? Heavy new supply typically softens prices + rents 12–24 months out; constrained supply supports both.
Investment metrics
- 1% rule
- 1.72% ✓
- Cap rate
- 14.81%
- Cash-on-cash
- 30.41%
- DSCR
- 2.35
- GRM
- 4.8
CMA / ARV
- ARV (on-the-fly)
- $408,320
- Comps found
- 12
Show comp detail 12 sales within ~0.75 mi
| Address | Dist | Beds/Ba | Sqft | Sold | Price | $/sf | Match |
|---|---|---|---|---|---|---|---|
| 1515 Dorchester Dr | 0.03mi | 3/2.0 | 1,925 (+9%) | 1mo | $490,000 | $255 | 82 |
| 225 W Navajo St | 0.13mi | 4/2.0 (+1) | 1,819 (+3%) | 2mo | $419,500 | $231 | 82 |
| 1817 Strasbourg Pt | 0.38mi | 3/2.5 | 1,763 (+0%) | 2mo | $675,000 | $383 | 78 |
| 1611 Lorraine St | 0.29mi | 3/2.0 | 1,844 (+5%) | 1mo | $465,000 | $252 | 78 |
| 96 Cheyenne Blvd | 0.24mi | 2/2.0 (-1) | 1,763 (+0%) | 9mo | $399,000 | $226 | 76 |
| 306 W Ramona Ave | 0.22mi | 4/2.0 (+1) | 1,944 (+10%) | 4mo | $450,000 | $231 | 64 |
| 412 Yucca Dr | 0.17mi | 4/2.0 (+1) | 2,023 (+15%) | 7mo | $470,000 | $232 | 56 |
| 1401 Avenue A St | 0.52mi | 3/2.0 | 1,536 (-13%) | 4mo | $340,000 | $221 | 52 |
| 513 Arapahoe Dr | 0.48mi | 4/2.0 (+1) | 1,949 (+11%) | 9mo | $565,000 | $290 | 47 |
| 2113 Woodburn St | 0.69mi | 4/2.5 (+1) | 1,903 (+8%) | 7mo | $560,000 | $294 | 42 |
| 15 E Fountain Blvd | 0.73mi | 3/1.0 | 1,568 (-11%) | 6mo | $125,000 | $80 | 39 |
| 228 E Las Vegas St | 0.68mi | 3/1.0 | 1,522 (-14%) | 5mo | $270,977 | $178 | 38 |
Match score weights: distance 35% · size 25% · config 20% · recency 20%. Top-matched comps best support the ARV.
Projected returns pro-forma
-3.0% appreciation · 2.3% rent growth · sell at horizon
- IRR
- 24.3%
- Equity multiple
- 1.99×
- Total profit
- $34,722
- Equity at exit
- $18,638
- IRR
- 31.7%
- Equity multiple
- 3.77×
- Total profit
- $96,878
- Equity at exit
- $10,808
Cash invested: $35,000 (down + closing). Projections, not guarantees.
Landlord ↔ Tenant lean methodology
- Overall (STATE)
- 38 Tenant-Leaning
- State Colorado
- 38 Tenant-Leaning · D+4
- County
- — inherits STATE
- City
- — inherits STATE
ZIP-level market 80905
- Home prices YoY
- -31.1%
- Rents YoY
- 2.3%
- Active inventory
- 148
- Price-to-rent
- 4.8×
Monthly cashflow live
- Estimated rent
- $2,155 high interval (Pro) →
- Mortgage (P&I)
- −$656
- Tax from tax record
- −$108 /mo · $1,296/yr
- Insurance
- −$52
- HOA
- −$0
- Vacancy / Maint / Mgmt
- −$453
- Net cashflow
- $887
Break-even live
UW: 25.0% down · 7.5% · 30yr · 1.5% tax · 5.0% vac · 8.0% maint · 8.0% mgmt
Financing live
Cash to close
- Down payment
- $31,250
- Closing costs
- $3,750
- Reserves months
- —
- Total cash needed
- —
Loan-product check · same deal, 3 products live
Conventional
25% down · 7.5% · 30yr
- Down + closing
- —
- Monthly P&I
- —
- Monthly cashflow
- —
- DSCR
- —
- Eligible?
- —
Personal DTI + credit; lowest rate.
DSCR
20% down · 8.5% · 30yr
- Down + closing
- —
- Monthly P&I
- —
- Monthly cashflow
- —
- DSCR
- —
- Eligible?
- —
No personal income docs; deal must DSCR.
Hard money
10% down · 12.0% · 12mo
- Down + closing
- —
- Monthly P&I
- —
- Monthly cashflow
- —
- DSCR
- —
- Eligible?
- —
Short-term bridge; refi at stabilization.
Rent comps 22 comps
| Address | Beds | Baths | Sqft | Rent | $/sqft | DOM | Units | Dist |
|---|---|---|---|---|---|---|---|---|
| 38 W Navajo St Unit b Colorado Springs, CO | 3.0 | 2.0 | 1540 | $1,950 | $1.27 | 3d | 1 | 0.09mi |
| 12 W Brookside St Colorado Springs, CO | 2.0 | 2.0 | 1796 | $2,250 | $1.25 | 3d | 1 | 0.16mi |
| 78 Cheyenne Blvd Colorado Springs, CO | 2.0 | 2.5 | 1782 | $2,595 | $1.46 | 11d | 1 | 0.24mi |
| 8 E St. Elmo Ave Colorado Springs, CO | 3.0 | 3.5 | 1763 | $2,750 | $1.56 | 3d | 1 | 0.33mi |
| 202 Cheyenne Blvd Colorado Springs, CO | 3.0 | 2.0 | 1387 | $3,000 | $2.16 | 23d | 1 | 0.33mi |
| 107 W Cheyenne Rd Colorado Springs, CO | 2.0 | 1.0–2.0 | 1057 | $1,799 | $1.70 | 3d | 3 | 0.42mi |
| 1857 Lorraine St Colorado Springs, CO | 2.0 | 1.5 | 1329 | $1,900 | $1.43 | 14d | 1 | 0.45mi |
| 301 E Arvada St Colorado Springs, CO | 3.0 | 1.0 | 1248 | $1,525 | $1.22 | 23d | 1 | 0.52mi |
| 829 Sahwatch St Colorado Springs, CO | 3.0 | 2.5 | 1550 | $2,200 | $1.42 | 14d | 1 | 0.71mi |
| 2125 Broadmoor Road Cir Colorado Springs, CO | 2.0 | 3.0 | 1618 | $2,195 | $1.36 | 14d | 1 | 0.78mi |
| 239 Fountain Blvd Unit 100 Colorado Springs, CO | 2.0 | 1.0 | 1300 | $2,600 | $2.00 | 23d | 1 | 0.81mi |
| 655 S Sierra Madre St Colorado Springs, CO | 2.0 | 1.0–2.0 | 790 | $3,405 | $4.31 | 3d | 49 | 0.90mi |
| 333 E Las Animas St Colorado Springs, CO | 3.0 | 3.5 | 1850 | $2,500 | $1.35 | 3d | 1 | 0.92mi |
| 1615 Lenmar Dr Colorado Springs, CO | 4.0 | 3.0 | 2492 | $2,400 | $0.96 | 3d | 1 | 0.95mi |
| 626 S Wahsatch Ave Colorado Springs, CO | 3.0 | 1.0–3.0 | 1160 | $4,346 | $3.74 | 3d | 29 | 1.07mi |
| 225 E Cimarron St Colorado Springs, CO | 2.0 | 1.0–2.0 | 897 | $3,900 | $4.35 | 3d | 58 | 1.10mi |
| 505 S Weber St Colorado Springs, CO | 2.0 | 1.0–2.0 | 899 | $2,898 | $3.22 | 3d | 47 | 1.13mi |
| 217 S Weber St Colorado Springs, CO | 2.0 | 1.0–2.0 | 902 | $3,591 | $3.98 | 3d | 71 | 1.38mi |
| 217 S Weber St Colorado Springs, CO | 1.0–2.0 | 1.0–2.0 | 969 | $3,860 | $3.98 | 21d | 10 | 1.38mi |
| 1221 La Veta Way Colorado Springs, CO | 3.0 | 1.5 | 1666 | $2,300 | $1.38 | 3d | 1 | 1.39mi |
| 1735 Presidential Hts Colorado Springs, CO | 1.0–3.0 | 1.0–2.0 | 1025 | $2,618 | $2.55 | 3d | 20 | 1.42mi |
| 1132 Norwood Ave Colorado Springs, CO | 4.0 | 2.0 | 1580 | $1,810 | $1.15 | 23d | 1 | 1.48mi |
Listing history 18 events
-
2026-06-18days on market $125,000 Active 69 DOM
-
2026-06-17days on market $125,000 Active 68 DOM
-
2026-06-16days on market $125,000 Active 67 DOM
-
2026-06-15days on market $125,000 Active 66 DOM
-
2026-06-14days on market $125,000 Active 64 DOM
-
2026-06-10days on market $125,000 Active 61 DOM
-
2026-06-09days on market $125,000 Active 60 DOM
-
2026-06-08days on market $125,000 Active 59 DOM
-
2026-06-07days on market $125,000 Active 58 DOM
-
2026-06-05days on market $125,000 Active 55 DOM
-
2026-06-03days on market $125,000 Active 54 DOM
-
2026-06-03days on market $125,000 Active 53 DOM
-
2026-06-01days on market $125,000 Active 52 DOM
-
2026-05-31days on market $125,000 Active 51 DOM
-
2026-04-10$125,000 Active
-
2018-01-09soldstatus $222,500
-
2017-11-25price $225,000
-
2012-09-13soldstatus $130,000
ⓘ Source: listings_history table (triggers on properties + properties_extension) + one-shot
backfill from property_details.listing_events for pre-trigger history.
Tax reassessment forecast CO · Resets to sale price
- Current annual tax
- $1,296 · $108/mo
- Projected year-2 tax
- $1,296 · $108/mo
- Expected delta
- $0/yr ($0/mo · 0.0%)
ⓘ Screening estimate from a state-policy table — verify with the county assessor before closing.
Climate risk First Street
- Flood 1/10 Low FEMA zone X (unshaded) · 0% chance over 30 yrs
- Wildfire 2/10 Low
- Heat 2/10 Low 6 d/yr ≥90°F today · 16 d/yr by 30 yrs out
- Wind 2/10 Low
- Air quality 1/10 Low 0 unhealthy d/yr today · 0 by 30 yrs out
Nearby sold comps map
Loading sold comps map…
Walkable amenities ~0.75 mi
Loading nearby amenities…
Taxation est. · year 1
- Rental income
- $25,860
- − Mortgage interest
- −$7,002
- − Property taxes
- −$1,296
- − Insurance
- −$625
- − Repairs & maintenance
- −$2,069
- − Management
- −$2,069
- − Depreciation
- −$3,636
- Taxable income
- $9,163
- Est. tax owed @ 24.0%
- −$2,199
- After-tax cash flow
- $8,443/yr
For passive investors: Depreciation is non-cash, so a rental often shows a tax loss while cash-flowing — sheltering income. Rental losses are passive: they offset passive income freely, and up to $25,000/yr can offset ordinary (W-2) income if you actively participate and your MAGI is under $100k (phasing out to $0 by $150k); unused losses carry forward. On sale, claimed depreciation is recaptured at up to 25%, and gains may owe capital-gains tax (a 1031 exchange can defer both). Figures are a year-1 estimate at your 24.0% rate — not tax advice; consult a CPA.
Schools (NCES district)
- District
- Colorado Springs School District No. 11 In The County Of E
- NCES district ID
- 0803060
- Math proficiency
- 20% ▼ -8.00%
- Reading proficiency
- 37% ▼ -4.00%
- Median HH income
- $47,884
- Composite
- 24.69/100
- National rank
- #7613
- State rank
- #56 of 86 in CO
Livability — Colorado Springs
- Score
- 78/100
- State rank
- #23
- US rank
- #2639
Category grades
Schools grade is shown separately in the Schools card above.
Census & demographics
- Census place
- Colorado Springs, CO
- County
- El Paso County · 689,348 people
- City population
- 555,783
- Metro
- Colorado Springs, CO
- Population (ZIP)
- 16,672
- Household income
- $63,281
- Rent vs Own
- Severe rent burden
- 1210.0
Population outlook (El Paso County) Hauer SSP2
- Today (2025)
- 768,926 people
- By 2030
- 815,739 · +6.1%
- By 2040
- 903,489 · +17.5%
- By 2050
- 981,204 · +27.6%
- By 2075
- 1,155,542 · +50.3%
- By 2100
- 1,202,070 · +56.3%
Race, ethnicity, and origin ACS 2023
- Neighborhood character
- Majority White (65%)
- Race & ethnicity
- White 65% Hispanic / Latino 24% Two or more races 13% Black 5% Asian 1%
- Hispanic origin (detail)
- Mexican 11%
- Common ancestry
- Romanian 5% Lithuanian 4% Slovak 3%
- Foreign-born
- 7% · Canada, South Korea
- Languages at home
- 85% English-only · Spanish 11% German/W. Germanic 1% Russian/Polish/Slavic 1%
Political lean MEDSL · El Paso
- 2024 margin
- Lean R (+9.8) · D 43.8% · R 53.5% · Other 2.7%
- 2008→2024 swing
- +9.0pp toward D · 2008: -18.8pp · 2024: -9.8pp
- All cycles
- 2024: R+9.8 2020: R+10.8 2016: R+22.6 2012: R+21.4 2008: R+18.8
Not yet ingested
- Civics
- —
Market trends
- HPI YoY
- ▼ -132.83%
- Current HPI
- 294.7521
- Rent YoY
- ▲ 2.30%
- Metro
- Colorado Springs, CO
- State GDP YoY
- ▲ 1.95%
- F500 in state
- 14
Industry mix (Fortune 500 HQ in CO)
| Industry | F500 HQs | Revenue |
|---|---|---|
| Technology Distribution | 1 | $31B |
|
||
| Food / Agriculture | 1 | $18B |
|
||
| Packaging | 1 | $14B |
|
||
| Healthcare | 1 | $13B |
|
||
| Energy | 1 | $10B |
|
||
| Technology | 1 | $4B |
|
||
Price history
-3.8% since first listed4 events — show timeline
- 2026-04-10 Listed $125,000 elevateMLS
- 2018-01-09 Sold (Public Records) $222,500 Public Records
- 2017-11-25 Price Changed $225,000 elevateMLS
- 2012-09-13 Sold (Public Records) $130,000 Public Records
Property tax history
+3.5%/yrLatest (2024): $1,296 · +9.5% YoY. Source: county tax records.
Cash-flow waterfall
monthlySold comps — $/sqft
last 12 mo · ≤1 miLoading sold comps…