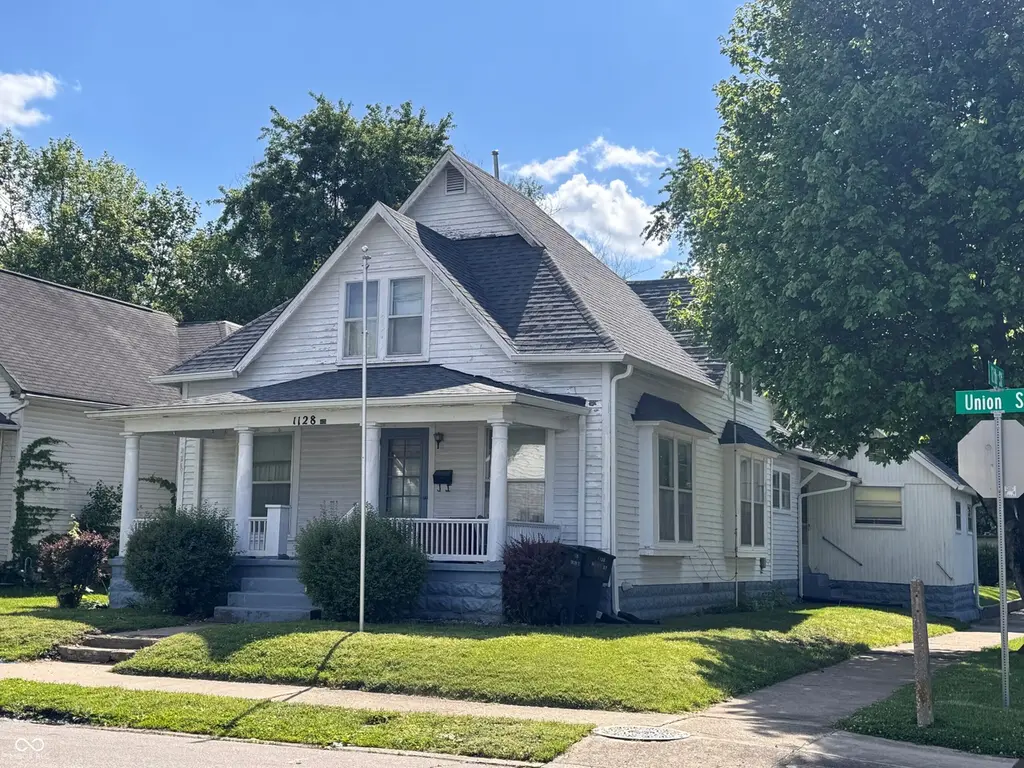
1128 Union St · Columbus, IN
Flood risk 1/10 · Minimal
- FEMA flood zone
- X (unshaded)
- Chance of flooding over 30 yrs
- 0.0%
- Est. flood insurance / yr
- $473 – $860
Fire risk 1/10 · Minimal
- Est. fire insurance / yr
- $717 – $1,331
Heat risk 4/10 · Minor
- Hot days now (above 103°F)
- 7 days/yr
- Hot days in 30 yrs
- 19 days/yr
Wind risk 2/10 · Minimal
- Chance of severe wind over 30 yrs
- 1.0%
Air-quality risk 2/10 · Minimal
- Unhealthy air days now
- 1 days/yr
- Unhealthy air days in 30 yrs
- 2 days/yr
Risk factors via First Street. Map © Google.
Why this score? — see what drove the B- grade
The composite is a weighted blend of 9 inputs, each scored 0–100. Each bar is that input's sub-score; the figure is the points it added to the 100-point composite (weight × sub-score).
- Cash flow +26.2/30.0
- ARV discount +15.0/15.0
- DSCR +8.8/10.0
- 1% rule +6.6/10.0
- Livability +4.0/5.0
- Schools +3.6/10.0
- Rent growth +3.3/5.0
- Condition / age +2.5/5.0
- Appreciation +0.0/10.0
$139,000
🖨 Deal sheet (PDF) 📄 Offer letter ✓ Due diligence
Listing remarks
Enjoy flexible living with 3 bedrooms, the third bedroom that can easily serve as a cozy family room or home office and the upper-level bedroom could be split into a 4th bedroom is ideal for investors or buyers looking for a project with potential. With the right updates, you can completely reimagine the space to fit your style and needs. This property offers a great opportunity for a flip, investment property, or owner occupied living. Notable updates include a roof (2021), gas furnace (2020), and gas water heater (2014). Being sold as-is.
Key facts
- 5,760 sq ft lot
- Garage
- Built 1920
Property features AI
Finance
- Other: Lot under 1/4 acre (approximately 0.13 acre); Property listed as residential single-family
Exterior
- Parking: Detached garage (1 car)
- Utilities: Public water; Municipal sewer connected; No solid waste service listed
- Home design: Single-family residence; One-and-one-half story
- Construction: Wood siding exterior; Block partial foundation
- Exterior features: Covered porch/patio; Corner city lot with curbs and sidewalks; No fence
Interior
- Kitchen: Gas oven; Refrigerator; Gas water heater
- Bedrooms: Three bedrooms total — two on the main level, one on the upper level (upper bedroom approx. 19x24; main-level bedrooms approx. 11x13 and 11x13)
- Bathrooms: One full bathroom
- Heating & cooling: Natural gas heating; No central air
- Interior features: Attic access; Partial, unfinished cellar basement
- Laundry & utility: No laundry facilities
Neighborhood map
What this means for you Summary
Snapshot
- This is a 3-bed/1.0-bath single-family listed at $139k.
Deal economics
- At list price, monthly cash flow is $353 ($4k/yr) — positive.
- The deal already cash-flows at list — no discount required.
- Meets the 1% rule at list price ($2k rent vs $139k).
- Cap rate 9.3% vs local median 3.5% in Columbus — top-decile yield for the area; either an underpriced asset or a hidden risk that comps aren't pricing in. Stress-test before assuming the spread holds.
Location & tenants
- Location reads 79/100 on livability (#24 in IN, #1,978 nationally) — a middle-class / working-renter tenant base. Strengths: crime A+, cost of living A+, housing A+; Watch: amenities D+, commute F.
- Bartholomew Consolidated School Corporation (urban): math 38% / reading 45% proficiency, ranked #119 of 301 in IN (top 40%) — families likely to look elsewhere, expect single-tenant / working-renter base with shorter leases.
- Market conditions: Rents rising (+3.1%/yr); 340 active listings in the ZIP; 1 comparable units currently listed for rent nearby; solid renter incomes; 195 units permitted in Bartholomew County in 2024 (0 in 5+ unit buildings).
Forward outlook
- Local home prices are declining (-3.0%/yr); year-one equity from $961 of loan paydown is wiped out by about $4k of value loss. Plan a longer hold.
- Bartholomew County population projected at +22% by 2050 — long-run rental-demand tailwind backs the buy-and-hold thesis.
- At projected returns (-3.0% appreciation + 3.1% rent growth), your $39k cash investment doubles in ~10 years — after that, you're playing with house money.
Negotiation context
- Only 9 days on market — expect competitive offers; lowballing is unlikely to land.
Risks & watch-outs
- Watch-outs: built in 1920 — expect roof / HVAC / electrical / plumbing capex.
Questions for the listing agent
- Built in 1920 — when were the roof, HVAC, electrical panel, plumbing, and water heater last replaced?
- Is there a deadline driving the sale (1031 exchange, divorce, estate, relocation)? That informs how much negotiation room exists.
- Schools are B-rated — typically a magnet for longer-tenancy family renters. What's the average tenant stay here, and is there a school-zone premium baked into asking?
- What's the average days-on-market for RENTAL listings here right now (not sales)? A rising rental-DOM trend means longer vacancies and softer asking-rent achievability than the comps imply.
- What's the recent tenant-quality profile in this submarket — average credit score on applications, eviction rate, late-payment / NSF rate, and stable-employment percentage? A property-management company in the area should have these aggregated.
- How much new for-sale + rental construction is in the pipeline within 1–3 miles? Heavy new supply typically softens prices + rents 12–24 months out; constrained supply supports both.
Investment metrics
- 1% rule
- 1.16% ✓
- Cap rate
- 9.34%
- Cash-on-cash
- 10.88%
- DSCR
- 1.48
- GRM
- 7.2
CMA / ARV
- ARV (on-the-fly)
- $238,560
- Comps found
- 12
Show comp detail 12 sales within ~0.75 mi
| Address | Dist | Beds/Ba | Sqft | Sold | Price | $/sf | Match |
|---|---|---|---|---|---|---|---|
| 1620 Lafayette Ave | 0.47mi | 3/1.5 | 1,904 (-4%) | 4mo | $237,500 | $125 | 65 |
| 1439 Pearl St | 0.32mi | 3/1.0 | 2,176 (+10%) | 7mo | $124,000 | $57 | 64 |
| 1902 14th St | 0.51mi | 2/1.0 (-1) | 1,900 (-4%) | 1mo | $189,000 | $99 | 63 |
| 2010 Stella Rock Trce | 0.25mi | 3/2.5 | 1,760 (-12%) | 1mo | $299,995 | $170 | 62 |
| 1329 Franklin St | 0.40mi | 3/3.0 | 2,066 (+4%) | 8mo | $239,900 | $116 | 60 |
| 902 18th St | 0.46mi | 3/2.5 | 2,080 (+5%) | 6mo | $250,000 | $120 | 60 |
| 1534 Lawton Ave | 0.61mi | 4/3.0 (+1) | 2,016 (+1%) | 3mo | $276,000 | $137 | 54 |
| 2003 Gilmore St | 0.59mi | 2/1.0 (-1) | 1,800 (-10%) | 2mo | $180,000 | $100 | 50 |
| 1640 Lawton Ave | 0.65mi | 3/2.5 | 2,152 (+8%) | 2mo | $258,000 | $120 | 49 |
| 620 Hutchins Ave | 0.47mi | 2/1.0 (-1) | 1,752 (-12%) | 7mo | $164,000 | $94 | 48 |
| 2103 6th St | 0.74mi | 4/1.0 (+1) | 2,197 (+10%) | 2mo | $126,000 | $57 | 41 |
| 1921 Washington St | 0.67mi | 2/2.0 (-1) | 1,720 (-14%) | 2mo | $285,500 | $166 | 35 |
Match score weights: distance 35% · size 25% · config 20% · recency 20%. Top-matched comps best support the ARV.
Projected returns pro-forma
-3.0% appreciation · 3.15% rent growth · sell at horizon
- IRR
- 0.1%
- Equity multiple
- 1.01×
- Total profit
- $198
- Equity at exit
- $20,725
- IRR
- 9.9%
- Equity multiple
- 1.77×
- Total profit
- $30,131
- Equity at exit
- $12,018
Cash invested: $38,920 (down + closing). Projections, not guarantees.
Landlord ↔ Tenant lean methodology
- Overall (STATE)
- 90 Strongly Landlord-Friendly
- State Indiana
- 90 Strongly Landlord-Friendly · R+11
- County
- — inherits STATE
- City
- — inherits STATE
ZIP-level market 47201
- Rents YoY
- 3.1%
- Active inventory
- 340
- Price-to-rent
- 7.2×
Monthly cashflow live
- Estimated rent
- $1,619 medium interval (Pro) →
- Mortgage (P&I)
- −$729
- Tax from tax record
- −$139 /mo · $1,669/yr
- Insurance
- −$58
- HOA
- −$0
- Vacancy / Maint / Mgmt
- −$340
- Net cashflow
- $353
Break-even live
Sensitivity live
| Price | -10% $432 | -5% $392 | +0% $353 | +5% $314 | +10% $274 |
|---|---|---|---|---|---|
| Rent | -10% $225 | -5% $289 | +0% $353 | +5% $417 | +10% $481 |
| Rate | -1.0pp $423 | -0.5pp $388 | base $353 | +0.5pp $317 | +1.0pp $280 |
UW: 25.0% down · 7.5% · 30yr · 1.5% tax · 5.0% vac · 8.0% maint · 8.0% mgmt
Financing live
Cash to close
- Down payment
- $34,750
- Closing costs
- $4,170
- Reserves months
- —
- Total cash needed
- —
Loan-product check · same deal, 3 products live
Conventional
25% down · 7.5% · 30yr
- Down + closing
- —
- Monthly P&I
- —
- Monthly cashflow
- —
- DSCR
- —
- Eligible?
- —
Personal DTI + credit; lowest rate.
DSCR
20% down · 8.5% · 30yr
- Down + closing
- —
- Monthly P&I
- —
- Monthly cashflow
- —
- DSCR
- —
- Eligible?
- —
No personal income docs; deal must DSCR.
Hard money
10% down · 12.0% · 12mo
- Down + closing
- —
- Monthly P&I
- —
- Monthly cashflow
- —
- DSCR
- —
- Eligible?
- —
Short-term bridge; refi at stabilization.
Rent comps 1 comps
| Address | Beds | Baths | Sqft | Rent | $/sqft | DOM | Units | Dist |
|---|---|---|---|---|---|---|---|---|
| 1182 Quail Run Dr Columbus, IN | 1.0–3.0 | 1.0–2.0 | 967 | $1,600 | $1.65 | 44d | 16 | 1.16mi |
Listing history 2 events
-
2026-05-17status Pending
-
2026-05-07$139,000 Active
ⓘ Source: listings_history table (triggers on properties + properties_extension) + one-shot
backfill from property_details.listing_events for pre-trigger history.
Tax reassessment forecast IN · Partial reset (capped growth)
- Current annual tax
- $1,669 · $139/mo
- Projected year-2 tax
- $1,669 · $139/mo
- Expected delta
- $0/yr ($0/mo · 0.0%)
ⓘ Screening estimate from a state-policy table — verify with the county assessor before closing.
Climate risk First Street
- Flood 1/10 Low FEMA zone X (unshaded) · 0% chance over 30 yrs
- Wildfire 1/10 Low
- Heat 4/10 Moderate 7 d/yr ≥103°F today · 19 d/yr by 30 yrs out
- Wind 2/10 Low 100% chance of damaging wind over 30 yrs
- Air quality 2/10 Low 1 unhealthy d/yr today · 2 by 30 yrs out
Nearby sold comps map
Loading sold comps map…
Walkable amenities ~0.75 mi
Loading nearby amenities…
Taxation est. · year 1
- Rental income
- $19,425
- − Mortgage interest
- −$7,786
- − Property taxes
- −$1,669
- − Insurance
- −$695
- − Repairs & maintenance
- −$1,554
- − Management
- −$1,554
- − Depreciation
- −$4,044
- Taxable income
- $2,123
- Est. tax owed @ 24.0%
- −$510
- After-tax cash flow
- $3,725/yr
For passive investors: Depreciation is non-cash, so a rental often shows a tax loss while cash-flowing — sheltering income. Rental losses are passive: they offset passive income freely, and up to $25,000/yr can offset ordinary (W-2) income if you actively participate and your MAGI is under $100k (phasing out to $0 by $150k); unused losses carry forward. On sale, claimed depreciation is recaptured at up to 25%, and gains may owe capital-gains tax (a 1031 exchange can defer both). Figures are a year-1 estimate at your 24.0% rate — not tax advice; consult a CPA.
Schools (NCES district)
- District
- Bartholomew Consolidated School Corporation
- NCES district ID
- 1800360
- Math proficiency
- 38% ▼ -11.00%
- Reading proficiency
- 45% ▼ -7.00%
- Median HH income
- $54,685
- Composite
- 36.16/100
- National rank
- #4736
- State rank
- #119 of 301 in IN
Livability — Columbus
- Score
- 79/100
- State rank
- #24
- US rank
- #1978
Category grades
Schools grade is shown separately in the Schools card above.
Census & demographics
- Census place
- Columbus, IN
- County
- Bartholomew County · 74,100 people
- City population
- 74,100
- Metro
- Columbus, IN
- Population (ZIP)
- 47,900
- Household income
- $83,958
- Rent vs Own
- Severe rent burden
- 1455.0
Population outlook (Bartholomew County) Hauer SSP2
- Today (2025)
- 90,162 people
- By 2030
- 94,432 · +4.7%
- By 2040
- 102,659 · +13.9%
- By 2050
- 109,794 · +21.8%
- By 2075
- 123,419 · +36.9%
- By 2100
- 121,047 · +34.3%
Race, ethnicity, and origin ACS 2023
- Neighborhood character
- Predominantly White (75%)
- Race & ethnicity
- White 75% Hispanic / Latino 10% Asian 9% Two or more races 6% Black 2%
- Hispanic origin (detail)
- Mexican 8% Puerto Rican 1%
- Common ancestry
- Italian 3% Slovak 2% Serbian 1%
- Foreign-born
- 14% · Canada, China
- Languages at home
- 83% English-only · Spanish 8% Other Indo-European 5% Other Asian/Pacific 2%
Political lean MEDSL · Bartholomew
- 2024 margin
- Strong R (+27.3) · D 35.3% · R 62.7% · Other 2.0%
- 2008→2024 swing
- -16.1pp toward R · 2008: -11.3pp · 2024: -27.3pp
- All cycles
- 2024: R+27.3 2020: R+26.2 2016: R+33.3 2012: R+25.4 2008: R+11.3
Not yet ingested
- Civics
- —
Market trends
- HPI YoY
- ▼ -204.94%
- Current HPI
- 150.2246
- Rent YoY
- ▲ 3.15%
- Metro
- Columbus, IN
- State GDP YoY
- ▲ 2.90%
- F500 in state
- 18
Industry mix (Fortune 500 HQ in IN)
| Industry | F500 HQs | Revenue |
|---|---|---|
| Industrial Machinery | 2 | $37B |
|
||
| Healthcare | 1 | $177B |
|
||
| Pharmaceuticals | 1 | $45B |
|
||
| Metals / Steel | 1 | $18B |
|
||
| Agriculture | 1 | $17B |
|
||
| Packaging | 1 | $12B |
|
||
Price history
2 events — show timeline
- 2026-05-17 Pending — MIBOR as Distributed by MLS Grid
- 2026-05-07 Listed $139,000 MIBOR as Distributed by MLS Grid
Property tax history
+6.8%/yrLatest (2024): $1,669 · +7.8% YoY. Source: county tax records.
Cash-flow waterfall
monthlySold comps — $/sqft
last 12 mo · ≤1 miLoading sold comps…