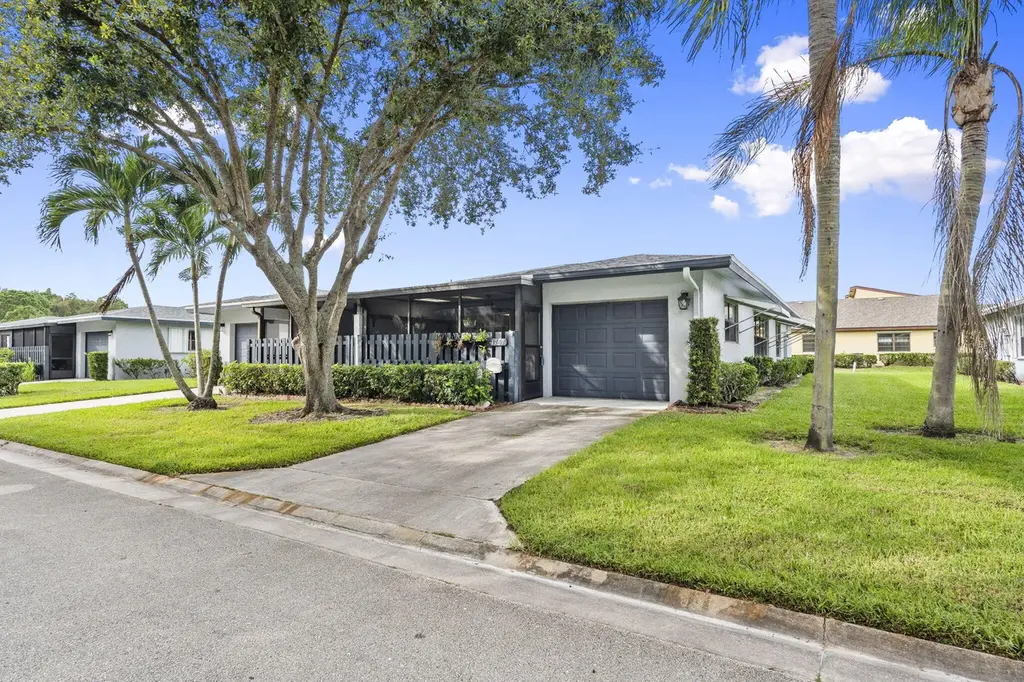
1767 S Dovetail Dr Unit R · Fort Pierce, FL
Flood risk 1/10 · Minimal
- FEMA flood zone
- X (unshaded)
- Chance of flooding over 30 yrs
- 0.0%
- Est. flood insurance / yr
- $507 – $1,088
Fire risk 3/10 · Minor
- Est. fire insurance / yr
- $947 – $1,759
Heat risk 10/10 · Severe
- Hot days now (above 106°F)
- 7 days/yr
- Hot days in 30 yrs
- 26 days/yr
Wind risk 10/10 · Severe
- Chance of severe wind over 30 yrs
- 99.0%
Air-quality risk 2/10 · Minimal
- Unhealthy air days now
- 1 days/yr
- Unhealthy air days in 30 yrs
- 1 days/yr
Risk factors via First Street. Map © Google.
Why this score? — see what drove the D grade
The composite is a weighted blend of 9 inputs, each scored 0–100. Each bar is that input's sub-score; the figure is the points it added to the 100-point composite (weight × sub-score).
- Cash flow +10.5/30.0
- ARV discount +7.5/15.0
- 1% rule +5.6/10.0
- Rent growth +4.4/5.0
- Livability +3.8/5.0
- Schools +3.7/10.0
- DSCR +3.0/10.0
- Condition / age +2.5/5.0
- Appreciation +0.0/10.0
$179,000
🖨 Deal sheet 📄 Offer letter ✓ Due diligence
Listing remarks
Welcome to easy Florida living in this charming condo located in a vibrant, amenity-filled community. Freshly painted with crown molding and plantation shutters. Enjoy spacious closets, and a remodeled master bathroom with granite vanity. Relax on your private screened porch or enjoy the active clubhouse featuring a heated pool, tennis court & shuffleboard. Savannahs is a pet friendly community with no age restrictions. 675 credit score required through Transunion.
Key facts
- Active clubhouse
- Tennis court
- Heated pool
Tags
Property features AI
Finance
- HOA & community: Community clubhouse; Community pool; Shuffleboard court; Tennis courts; Monthly HOA fee
Exterior
- Parking: Attached garage (1 garage space, 1 covered space; 2 parking spaces total)
- Utilities: Public water; Public sewer; Cable connected; Electricity connected; Water connected; Sewer available
- Home design: Condominium; One story; Resale condition; Facing south
- Construction: CBS construction
- Exterior features: Not waterfront; Shingle roof
Interior
- Kitchen: Dishwasher; Electric range; Refrigerator
- Bedrooms: 2 bedrooms on the main level
- Flooring: Carpet; Tile
- Bathrooms: 2 full bathrooms on the main level
- Heating & cooling: Central heating (electric); Central air; Ceiling fan(s)
- Interior features: Walk-in closet(s); Unfurnished
- Laundry & utility: Laundry closet; Electric water heater
Neighborhood map
What this means for you Summary
Snapshot
- This is a 2-bed/2.0-bath condo listed at $179k.
Deal economics
- At list price, monthly cash flow is $-91 ($-1k/yr) — negative.
- To cash-flow at today's rent, offer at most $163k (8.9% below list).
- Meets the 1% rule at list price ($2k rent vs $179k).
- Recommended offer: $163k (8.9% below list) — sets the bar for cash-flow.
- Cap rate 5.7% vs local median 3.7% in Fort Pierce — top-decile yield for the area; either an underpriced asset or a hidden risk that comps aren't pricing in. Stress-test before assuming the spread holds.
Location & tenants
- Location reads 76/100 on livability (#226 in FL, #3,360 nationally) — a middle-class / working-renter tenant base. Strengths: commute A+, cost of living A+, housing A+; Watch: crime D+, schools D, amenities F.
- St. Lucie (urban): math 40% / reading 48% proficiency, ranked #51 of 73 in FL (top 70%) — families likely to look elsewhere, expect single-tenant / working-renter base with shorter leases.
- Market conditions: Rents rising fast (+7.4%/yr); 336 active listings in the ZIP; 22 comparable units currently listed for rent nearby; rentals at typical pace (median 24d on market — plan ~3-4 weeks tenant-placement turnaround); 4,868 units permitted in St. Lucie County in 2024 (268 in 5+ unit buildings).
- This rent runs 42% of the median local income ($54k/yr) — at the standard rent-burdened threshold; future hikes will face affordability resistance.
Forward outlook
- Local home prices are declining (-3.0%/yr); year-one equity from $1k of loan paydown is wiped out by about $5k of value loss. Plan a longer hold.
- St. Lucie County population projected at +20% by 2050 — long-run rental-demand tailwind backs the buy-and-hold thesis.
Negotiation context
- It's been on market 56 days — a 3% lower offer ($174k) is reasonable based on typical stale-listing flexibility.
- 6 sale attempts since 3y ago; this cycle's ask has dropped $10k (5%) from the opening price — seller is motivated, your offer sets the floor, not the list.
Risks & watch-outs
- Watch-outs: HOA is 28% of rent.
- Climate carrying-cost: severe wind risk, 99% chance of damaging wind over 30y; extreme-heat days projected 7→26/yr by 2055 (HVAC capex compounding) — expect insurance premiums to compound above CPI over the hold.
Questions for the listing agent
- What do current leases actually rent for vs. the listed asking? Can we see a recent rent roll and the last 12 months of T-12 income?
- It's been on market 56 days. Have you received any prior offers? Is the seller open to a 9% concession, seller financing, or rate buy-down credit?
- What does the HOA fee cover, when was the last increase, and are there any pending special assessments or reserve-fund shortfalls?
- Any open or pending special assessments — roof, HVAC, plumbing, elevator, façade? What's the per-unit balance and payoff schedule, and is the seller paying it off at close or rolling it to the buyer?
- Is there a deadline driving the sale (1031 exchange, divorce, estate, relocation)? That informs how much negotiation room exists.
- Schools are D-rated, which usually means shorter tenancies and higher turnover. Who's the typical renter profile here, and what's been the actual vacancy rate?
- Crime grade is D in this area — have there been break-ins, vandalism, or insurance claims at this property in the last 3 years? What carrier currently insures it and at what premium?
- The area grade is low — what's the realistic commute time and amenity access for the typical tenant pool here? Any planned neighborhood developments (good or bad) we should know about?
- What's the average days-on-market for RENTAL listings here right now (not sales)? A rising rental-DOM trend means longer vacancies and softer asking-rent achievability than the comps imply.
- What's the recent tenant-quality profile in this submarket — average credit score on applications, eviction rate, late-payment / NSF rate, and stable-employment percentage? A property-management company in the area should have these aggregated.
- How much new apartment / multifamily construction is in the pipeline within 1–3 miles? Heavy new supply (>2% of stock underway) typically softens rents 12–24 months out; light construction supports rent growth.
Investment metrics
- 1% rule
- 1.06% ✓
- Cap rate
- 5.69%
- Cash-on-cash
- -2.17%
- DSCR
- 0.90
- GRM
- 7.8
CMA / ARV
No comps found within radius.
Projected returns pro-forma
-3.0% appreciation · 7.42% rent growth · sell at horizon
- IRR
- -13.5%
- Equity multiple
- 0.49×
- Total profit
- $-25,693
- Equity at exit
- $26,689
- IRR
- 2.4%
- Equity multiple
- 1.22×
- Total profit
- $10,919
- Equity at exit
- $15,477
Cash invested: $50,120 (down + closing). Projections, not guarantees.
Landlord ↔ Tenant lean methodology
- Overall (STATE)
- 87 Strongly Landlord-Friendly
- State Florida
- 87 Strongly Landlord-Friendly · R+3
- County
- — inherits STATE
- City
- — inherits STATE
ZIP-level market 34982
- Home prices YoY
- -33.4%
- Rents YoY
- 7.4%
- Active inventory
- 336
- Price-to-rent
- 7.8×
Monthly cashflow live
- Estimated rent
- $1,902 high interval (Pro) →
- Mortgage (P&I)
- −$939
- Tax from tax record
- −$50 /mo · $595/yr
- Insurance
- −$75
- HOA
- −$530
- Vacancy / Maint / Mgmt
- −$399
- Net cashflow
- $-91
Break-even live
UW: 25.0% down · 7.5% · 30yr · 1.5% tax · 5.0% vac · 8.0% maint · 8.0% mgmt
Financing live
Cash to close
- Down payment
- $44,750
- Closing costs
- $5,370
- Reserves months
- —
- Total cash needed
- —
Loan-product check · same deal, 3 products live
Conventional
25% down · 7.5% · 30yr
- Down + closing
- —
- Monthly P&I
- —
- Monthly cashflow
- —
- DSCR
- —
- Eligible?
- —
Personal DTI + credit; lowest rate.
DSCR
20% down · 8.5% · 30yr
- Down + closing
- —
- Monthly P&I
- —
- Monthly cashflow
- —
- DSCR
- —
- Eligible?
- —
No personal income docs; deal must DSCR.
Hard money
10% down · 12.0% · 12mo
- Down + closing
- —
- Monthly P&I
- —
- Monthly cashflow
- —
- DSCR
- —
- Eligible?
- —
Short-term bridge; refi at stabilization.
Rent comps 22 comps
| Address | Beds | Baths | Sqft | Rent | $/sqft | DOM | Units | Dist |
|---|---|---|---|---|---|---|---|---|
| 1829 Sandhill Crane Dr Unit B2 Fort Pierce, FL | 2.0 | 2.0 | 1334 | $2,000 | $1.50 | 23d | 1 | 0.18mi |
| 1739 N Dovetail Dr Fort Pierce, FL | 2.0 | 2.0 | 1230 | $1,750 | $1.42 | 23d | 1 | 0.24mi |
| 1747 N Dovetail Dr Unit A Fort Pierce, FL | 2.0 | 2.0 | 1286 | $2,100 | $1.63 | 23d | 1 | 0.27mi |
| 1804 Blue Heron Ln Unit C Fort Pierce, FL | 2.0 | 2.0 | 1286 | $1,900 | $1.48 | 23d | 1 | 0.33mi |
| 1772 N Dovetail Dr Unit C Fort Pierce, FL | 2.0 | 2.0 | 1230 | $2,100 | $1.71 | 23d | 1 | 0.37mi |
| 3200 S US Highway 1 Fort Pierce, FL | 2.0–3.0 | 1.0–2.0 | 1144 | $1,509 | $1.32 | 13d | 1 | 0.38mi |
| 916 Savannas Point Dr Fort Pierce, FL | 2.0 | 2.0 | 1120 | $2,100 | $1.88 | 13d | 1 | 0.42mi |
| 802 N Lake Dr Unit B Fort Pierce, FL | 2.0 | 1.0 | 1000 | $1,550 | $1.55 | 23d | 1 | 0.47mi |
| 3030 S US Highway 1 Fort Pierce, FL | 3.0 | 2.0 | 1184 | $1,774 | $1.50 | 13d | 1 | 0.51mi |
| 1219 S Lakes End Dr Unit 2 Fort Pierce, FL | 2.0 | 2.0 | 1186 | $1,500 | $1.26 | 13d | 1 | 0.55mi |
| 800 Kanner Dr Unit B Fort Pierce, FL | 2.0 | 1.0 | 900 | $1,550 | $1.72 | 13d | 1 | 0.56mi |
| 928 Fra Mar Pl Fort Pierce, FL | 3.0 | 1.0 | 1440 | $2,000 | $1.39 | 23d | 1 | 0.62mi |
| 2902 Oleander Blvd Fort Pierce, FL | 3.0 | 2.0 | 1276 | $2,700 | $2.12 | 23d | 1 | 0.90mi |
| 2625 Heathcote Dr Unit 2623 Fort Pierce, FL | 2.0 | 2.0 | 1000 | $1,700 | $1.70 | 23d | 1 | 1.07mi |
| 2625 Heathcote Dr Unit 2631 Fort Pierce, FL | 2.0 | 2.0 | 1000 | $1,700 | $1.70 | 13d | 1 | 1.07mi |
| 2625 Heathcote Dr Unit 2647 Fort Pierce, FL | 2.0 | 2.0 | 1000 | $1,700 | $1.70 | 21d | 1 | 1.07mi |
| 4166 Gator Trace Villas Cir Unit B Fort Pierce, FL | 3.0 | 2.0 | 1336 | $2,200 | $1.65 | 23d | 1 | 1.07mi |
| 115 Maple Ave Fort Pierce, FL | 3.0 | 1.0 | 1008 | $1,999 | $1.98 | 23d | 1 | 1.11mi |
| 4215 Gator Trace Ave Unit G Fort Pierce, FL | 2.0 | 2.0 | 1200 | $2,200 | $1.83 | 23d | 1 | 1.21mi |
| 3343 Liberty Square Way #104 Fort Pierce, FL | 3.0 | 2.5 | 1638 | $2,300 | $1.40 | 23d | 1 | 1.22mi |
| 4003 Oleander Ave Fort Pierce, FL | 3.0–4.0 | 2.0 | 1765 | $2,748 | $1.56 | 13d | 1 | 1.31mi |
| 2147 Sibley Ave Fort Pierce, FL | 2.0 | 1.0 | 1568 | $1,800 | $1.15 | 23d | 1 | 1.46mi |
HOA detail condo
- Monthly dues
- $530 · $6,360/yr
- Likely covers
- pool
- Assessments
- None detected in remarks — confirm with the listing agent.
Listing history 33 events
-
2026-06-18days on market $179,000 Active 56 DOM
-
2026-06-17days on market $179,000 Active 55 DOM
-
2026-06-16days on market $179,000 Active 54 DOM
-
2026-06-15days on market $179,000 Active 53 DOM
-
2026-06-14days on market $179,000 Active 51 DOM
-
2026-06-13days on market $179,000 Active 50 DOM
-
2026-06-10days on market $179,000 Active 48 DOM
-
2026-06-09days on market $179,000 Active 47 DOM
-
2026-06-08days on market $179,000 Active 46 DOM
-
2026-06-07days on market $179,000 Active 45 DOM
-
2026-06-05days on market $179,000 Active 42 DOM
-
2026-06-03days on market $179,000 Active 41 DOM
-
2026-06-02pricedays on market $179,000 Active 40 DOM
-
2026-06-01days on market $189,000 Active 39 DOM
-
2026-05-31days on market $189,000 Active 38 DOM
-
2026-05-30days on market $189,000 Active 37 DOM
-
2026-04-23$189,000 Active
-
2026-03-28status Active
-
2026-03-13status Pending
-
2026-03-01historical Active Under Contract
-
2026-03-01historical
-
2025-12-20price $189,000
-
2025-10-31$199,000 Active
-
2024-04-26soldstatus $215,000
-
2024-02-25historical
-
2023-12-09status Active
-
2023-09-28historical Active Under Contract
-
2023-08-31$219,000 Active
-
2023-08-02historical
-
2023-02-24$225,000 Active
-
2000-07-10soldstatus $67,000
-
1997-10-02soldstatus $61,000
-
1991-12-30soldstatus $77,900
ⓘ Source: listings_history table (triggers on properties + properties_extension) + one-shot
backfill from property_details.listing_events for pre-trigger history.
Tax reassessment forecast FL · Resets to sale price
- Current annual tax
- $595 · $50/mo
- Projected year-2 tax
- $1,486 · $124/mo
- Expected delta
- +$891/yr (+$74/mo · 149.8%)
ⓘ Screening estimate from a state-policy table — verify with the county assessor before closing.
Climate risk First Street
- Flood 1/10 Low FEMA zone X (unshaded) · 0% chance over 30 yrs
- Wildfire 3/10 Moderate
- Heat 10/10 Extreme 7 d/yr ≥106°F today · 26 d/yr by 30 yrs out
- Wind 10/10 Extreme 99% chance of damaging wind over 30 yrs
- Air quality 2/10 Low 1 unhealthy d/yr today · 1 by 30 yrs out
Nearby sold comps map
Loading sold comps map…
Walkable amenities ~0.75 mi
Loading nearby amenities…
Taxation est. · year 1
- Rental income
- $22,819
- − Mortgage interest
- −$10,027
- − Property taxes
- −$595
- − Insurance
- −$895
- − Repairs & maintenance
- −$1,826
- − Management
- −$1,826
- − HOA
- −$6,360
- − Depreciation
- −$5,207
- Taxable loss
- −$3,916
- Est. tax savings @ 24.0%
- +$940
- After-tax cash flow
- $-147/yr
For passive investors: Depreciation is non-cash, so a rental often shows a tax loss while cash-flowing — sheltering income. Rental losses are passive: they offset passive income freely, and up to $25,000/yr can offset ordinary (W-2) income if you actively participate and your MAGI is under $100k (phasing out to $0 by $150k); unused losses carry forward. On sale, claimed depreciation is recaptured at up to 25%, and gains may owe capital-gains tax (a 1031 exchange can defer both). Figures are a year-1 estimate at your 24.0% rate — not tax advice; consult a CPA.
Schools (NCES district)
- District
- St. Lucie
- NCES district ID
- 1201770
- Math proficiency
- 40% ▼ -11.00%
- Reading proficiency
- 48% ▼ -4.00%
- Median HH income
- $44,737
- Composite
- 37.28/100
- National rank
- #4449
- State rank
- #51 of 73 in FL
Livability — Fort Pierce
- Score
- 76/100
- State rank
- #226
- US rank
- #3360
Category grades
Schools grade is shown separately in the Schools card above.
Census & demographics
- Census place
- Fort Pierce, FL
- County
- Saint Lucie County · 337,150 people
- City population
- 78,556
- Metro
- Port St. Lucie, FL
- Population (ZIP)
- 31,143
- Household income
- $54,082
- Rent vs Own
- Severe rent burden
- 1086.0
Population outlook (St. Lucie County) Hauer SSP2
- Today (2025)
- 338,016 people
- By 2030
- 355,687 · +5.2%
- By 2040
- 385,521 · +14.1%
- By 2050
- 406,106 · +20.1%
- By 2075
- 441,054 · +30.5%
- By 2100
- 436,885 · +29.2%
Race, ethnicity, and origin ACS 2023
- Neighborhood character
- Majority White (62%)
- Race & ethnicity
- White 62% Hispanic / Latino 22% Two or more races 12% Black 12%
- Hispanic origin (detail)
- Mexican 10% Puerto Rican 3% Cuban 3%
- Common ancestry
- Italian 7% Hispanic 2% Lithuanian 1%
- Foreign-born
- 12% · Canada
- Languages at home
- 80% English-only · Spanish 16% French/Haitian/Cajun 3%
Political lean MEDSL · St. Lucie
- 2024 margin
- Lean R (+9.1) · D 45.1% · R 54.2%
- 2008→2024 swing
- -21.2pp toward R · 2008: 12.1pp · 2024: -9.1pp
- All cycles
- 2024: R+9.1 2020: R+1.6 2016: R+2.5 2012: D+7.9 2008: D+12.1
Not yet ingested
- Civics
- —
Market trends
- HPI YoY
- ▼ -199.47%
- Current HPI
- 397.2649
- Rent YoY
- ▲ 7.42%
- Metro
- Port St. Lucie, FL
- State GDP YoY
- ▲ 3.28%
- F500 in state
- 36
Industry mix (Fortune 500 HQ in FL)
| Industry | F500 HQs | Revenue |
|---|---|---|
| Industrial Technology | 2 | $29B |
|
||
| Insurance | 2 | $17B |
|
||
| Retail | 1 | $60B |
|
||
| Technology Distribution | 1 | $58B |
|
||
| Homebuilding | 1 | $35B |
|
||
| Technology Manufacturing | 1 | $35B |
|
||
Price history
+142.6% since first listed17 events — show timeline
- 2026-04-23 Listed $189,000 Beaches MLS
- 2026-03-28 Relisted — Beaches MLS
- 2026-03-13 Pending — Beaches MLS
- 2026-03-01 Contingent — Beaches MLS
- 2026-03-01 Listing Removed — Beaches MLS
- 2025-12-20 Price Changed $189,000 Beaches MLS
- 2025-10-31 Listed $199,000 Beaches MLS
- 2024-04-26 Sold (Public Records) $215,000 Public Records
- 2024-02-25 Listing Removed — Beaches MLS
- 2023-12-09 Relisted — Beaches MLS
- 2023-09-28 Contingent — Beaches MLS
- 2023-08-31 Listed $219,000 Beaches MLS
- 2023-08-02 Listing Removed — Beaches MLS
- 2023-02-24 Listed $225,000 Beaches MLS
- 2000-07-10 Sold (Public Records) $67,000 Public Records
- 1997-10-02 Sold (Public Records) $61,000 Public Records
- 1991-12-30 Sold (Public Records) $77,900 Public Records
Property tax history
+0.2%/yrLatest (2025): $595 · -84.9% YoY. Source: county tax records.
Cash-flow waterfall
monthlySold comps — $/sqft
last 12 mo · ≤1 miLoading sold comps…