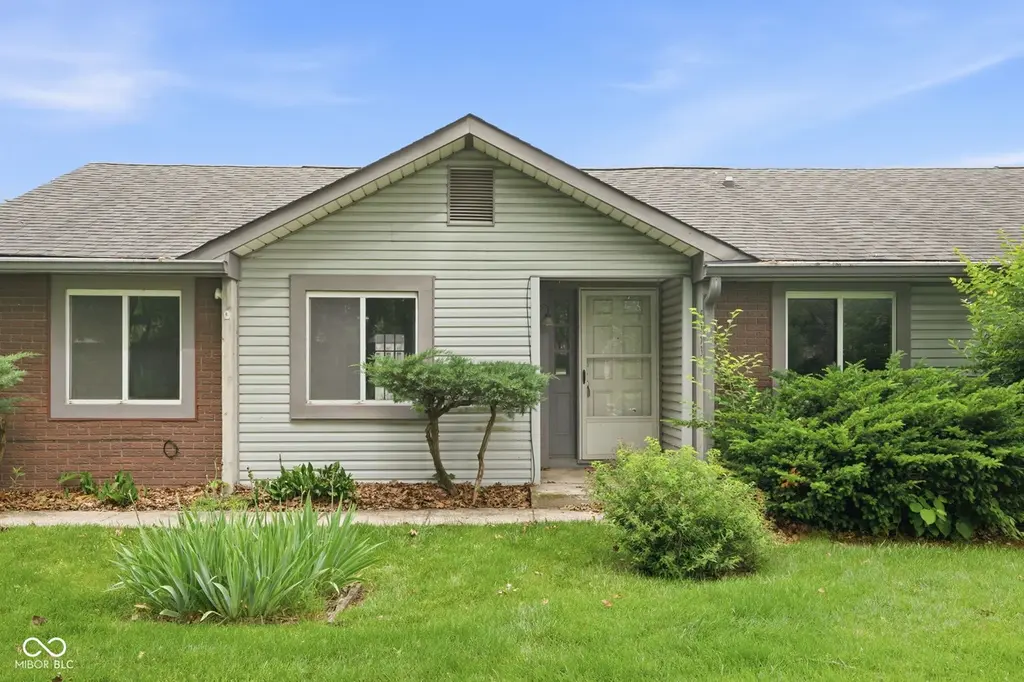
5953 Beau Jardin Dr · Indianapolis city (balance), IN
Flood risk 1/10 · Minimal
- FEMA flood zone
- X (unshaded)
- Chance of flooding over 30 yrs
- 0.0%
- Est. flood insurance / yr
- $507 – $1,088
Fire risk 1/10 · Minimal
- Est. fire insurance / yr
- $717 – $1,331
Heat risk 3/10 · Minor
- Hot days now (above 102°F)
- 7 days/yr
- Hot days in 30 yrs
- 19 days/yr
Wind risk 2/10 · Minimal
- Chance of severe wind over 30 yrs
- 1.0%
Air-quality risk 3/10 · Minor
- Unhealthy air days now
- 2 days/yr
- Unhealthy air days in 30 yrs
- 3 days/yr
Risk factors via First Street. Map © Google.
Why this score? — see what drove the C+ grade
The composite is a weighted blend of 9 inputs, each scored 0–100. Each bar is that input's sub-score; the figure is the points it added to the 100-point composite (weight × sub-score).
- Cash flow +24.4/30.0
- 1% rule +8.4/10.0
- DSCR +7.9/10.0
- ARV discount +7.5/15.0
- Schools +4.0/10.0
- Rent growth +3.4/5.0
- Livability +2.5/5.0
- Condition / age +2.5/5.0
- Appreciation +0.0/10.0
$130,000
🖨 Deal sheet 📄 Offer letter ✓ Due diligence
Listing remarks MLS
Nestled in quiet corner near shopping but view is wooded. Great condo with nice floor plan. 2 BA & walk-in closets
Key facts
- Private fenced patio
- Generous storage
- $200 HOA
Tags
Property features AI
Finance
- Other: Lot approximately 0.05 acres (< 1/4 acre); Property listed as residential condominium; Directions: GPS friendly
- HOA & community: HOA with a monthly fee of $200; HOA covers insurance, lawn care, grounds maintenance, and snow removal; Mandatory fee / association; 2+ common walls
Exterior
- Parking: Attached 2-car garage with garage door opener; Finished garage
- Utilities: Public water; Municipal sewer connected; No solid waste service listed
- Home design: Attached condominium; Ground-level (horizontal) unit; One story
- Construction: Brick and vinyl siding exterior; Slab foundation
- Exterior features: Covered patio; Privacy fencing; Sidewalks; Mature trees
Interior
- Kitchen: Electric oven; Microwave / micro-hood; Refrigerator
- Bedrooms: Primary bedroom with patio access and walk-in closet; Two main-level bedrooms (2 total)
- Bathrooms: Two full bathrooms; Primary bathroom with full shower stall
- Heating & cooling: Heat pump heating; Electric heating; Central air conditioning; Heat pump cooling
- Interior features: Vaulted ceilings; Attic with pull-down stairs; Walk-in closet(s); Smoke alarm
- Laundry & utility: Main-level laundry room; Washer; Dryer; Gas water heater
Neighborhood map
What this means for you Summary
Snapshot
- This is a 2-bed/1.0-bath condo listed at $130k.
Deal economics
- At list price, monthly cash flow is $265 ($3k/yr) — positive.
- The deal already cash-flows at list — no discount required.
- Meets the 1% rule at list price ($2k rent vs $130k).
- Recommended offer: $128k (1.5% below list) — sets the bar for market timing.
- Cap rate 8.7% vs local median 4.4% in Indianapolis city (balance) — top-decile yield for the area; either an underpriced asset or a hidden risk that comps aren't pricing in. Stress-test before assuming the spread holds.
Location & tenants
- Location reads: area grade C — affects rentability + tenant quality, not the cash-flow math above.
- Franklin Township Community School Corporation (urban): math 42% / reading 47% proficiency, ranked #87 of 301 in IN (top 29%) — families likely to look elsewhere, expect single-tenant / working-renter base with shorter leases.
- Market conditions: Rents rising (+3.8%/yr); 261 active listings in the ZIP; 9 comparable units currently listed for rent nearby; rentals leasing fast (median 8d on market — plan ~1-2 weeks tenant-placement turnaround); solid renter incomes; 1,906 units permitted in Marion County in 2024 (621 in 5+ unit buildings).
Forward outlook
- Local home prices are declining (-3.0%/yr); year-one equity from $899 of loan paydown is wiped out by about $4k of value loss. Plan a longer hold.
- Marion County population projected at +18% by 2050 — long-run rental-demand tailwind backs the buy-and-hold thesis.
Negotiation context
- It's been on market 21 days — a 2% lower offer ($128k) is reasonable based on typical stale-listing flexibility.
- 2 sale attempts since 12y ago; this cycle's ask has dropped $10k (7%) from the opening price — seller is motivated, your offer sets the floor, not the list.
- Current owner paid $61k; list at $130k implies a 113% gain — meaningful room to come down on a strong offer.
Questions for the listing agent
- Built in 1979 — when were the roof, HVAC, electrical panel, plumbing, and water heater last replaced?
- What does the HOA fee cover, when was the last increase, and are there any pending special assessments or reserve-fund shortfalls?
- Any open or pending special assessments — roof, HVAC, plumbing, elevator, façade? What's the per-unit balance and payoff schedule, and is the seller paying it off at close or rolling it to the buyer?
- Is there a deadline driving the sale (1031 exchange, divorce, estate, relocation)? That informs how much negotiation room exists.
- What's the average days-on-market for RENTAL listings here right now (not sales)? A rising rental-DOM trend means longer vacancies and softer asking-rent achievability than the comps imply.
- What's the recent tenant-quality profile in this submarket — average credit score on applications, eviction rate, late-payment / NSF rate, and stable-employment percentage? A property-management company in the area should have these aggregated.
- How much new apartment / multifamily construction is in the pipeline within 1–3 miles? Heavy new supply (>2% of stock underway) typically softens rents 12–24 months out; light construction supports rent growth.
Investment metrics
- 1% rule
- 1.34% ✓
- Cap rate
- 8.74%
- Cash-on-cash
- 8.75%
- DSCR
- 1.39
- GRM
- 6.2
CMA / ARV
No comps found within radius.
Projected returns pro-forma
-3.0% appreciation · 3.78% rent growth · sell at horizon
- IRR
- -1.9%
- Equity multiple
- 0.93×
- Total profit
- $-2,640
- Equity at exit
- $19,383
- IRR
- 8.9%
- Equity multiple
- 1.71×
- Total profit
- $25,819
- Equity at exit
- $11,240
Cash invested: $36,400 (down + closing). Projections, not guarantees.
Landlord ↔ Tenant lean methodology
- Overall (STATE)
- 90 Strongly Landlord-Friendly
- State Indiana
- 90 Strongly Landlord-Friendly · R+11
- County
- — inherits STATE
- City
- — inherits STATE
ZIP-level market 46237
- Rents YoY
- 3.8%
- Active inventory
- 261
- Price-to-rent
- 6.2×
Monthly cashflow live
- Estimated rent
- $1,739 high interval (Pro) →
- Mortgage (P&I)
- −$682
- Tax from tax record
- −$172 /mo · $2,067/yr
- Insurance
- −$54
- HOA
- −$200
- Vacancy / Maint / Mgmt
- −$365
- Net cashflow
- $265
Break-even live
UW: 25.0% down · 7.5% · 30yr · 1.5% tax · 5.0% vac · 8.0% maint · 8.0% mgmt
Financing live
Cash to close
- Down payment
- $32,500
- Closing costs
- $3,900
- Reserves months
- —
- Total cash needed
- —
Loan-product check · same deal, 3 products live
Conventional
25% down · 7.5% · 30yr
- Down + closing
- —
- Monthly P&I
- —
- Monthly cashflow
- —
- DSCR
- —
- Eligible?
- —
Personal DTI + credit; lowest rate.
DSCR
20% down · 8.5% · 30yr
- Down + closing
- —
- Monthly P&I
- —
- Monthly cashflow
- —
- DSCR
- —
- Eligible?
- —
No personal income docs; deal must DSCR.
Hard money
10% down · 12.0% · 12mo
- Down + closing
- —
- Monthly P&I
- —
- Monthly cashflow
- —
- DSCR
- —
- Eligible?
- —
Short-term bridge; refi at stabilization.
Rent comps 9 comps
| Address | Beds | Baths | Sqft | Rent | $/sqft | DOM | Units | Dist |
|---|---|---|---|---|---|---|---|---|
| 5844 Timber Lake Blvd Indianapolis, IN | 3.0 | 2.0 | 1250 | $1,856 | $1.48 | 2d | 1 | 0.11mi |
| 5717 Hacienda Ct Indianapolis, IN | 3.0 | 1.5 | 1322 | $1,631 | $1.23 | 16d | 1 | 0.30mi |
| 5309 Waterton Lakes Dr Indianapolis, IN | 3.0 | 2.0 | 1390 | $1,865 | $1.34 | 7d | 1 | 0.32mi |
| 5723 Ensenada Ave Indianapolis, IN | 3.0 | 2.0 | 1168 | $1,775 | $1.52 | 1d | 1 | 0.32mi |
| 5334 Padre Ln Indianapolis, IN | 3.0 | 1.5 | 1016 | $1,695 | $1.67 | 14d | 1 | 0.71mi |
| 5140 Emerson Village Pl Indianapolis, IN | 1.0–2.0 | 1.0–2.0 | 805 | $1,360 | $1.69 | 1d | 16 | 0.94mi |
| 4901 S Emerson Ave Indianapolis, IN | 1.0–4.0 | 1.0–2.0 | 998 | $1,417 | $1.42 | 1d | 10 | 0.94mi |
| 6543 E Hanna Ave Indianapolis, IN | 2.0–4.0 | 2.0 | 1452 | $1,299 | $0.89 | 12d | 1 | 1.28mi |
| 7260 Kidwell Dr Indianapolis, IN | 3.0 | 2.0 | 1409 | $1,899 | $1.35 | 7d | 1 | 1.35mi |
HOA detail condo
- Monthly dues
- $200 · $2,400/yr
- Assessments
- None detected in remarks — confirm with the listing agent.
Listing history 16 events
-
2026-06-18days on market $130,000 Active 21 DOM
-
2026-06-17days on market $130,000 Active 20 DOM
-
2026-06-16days on market $130,000 Active 19 DOM
-
2026-06-15days on market $130,000 Active 18 DOM
-
2026-06-13pricedays on market $130,000 Active 16 DOM
-
2026-06-09days on market $140,000 Active 12 DOM
-
2026-06-08days on market $140,000 Active 11 DOM
-
2026-06-07days on market $140,000 Active 10 DOM
-
2026-06-03days on market $140,000 Active 6 DOM
-
2026-06-02days on market $140,000 Active 5 DOM
-
2026-06-01days on market $140,000 Active 4 DOM
-
2026-05-31days on market $140,000 Active 3 DOM
-
2026-05-28$140,000 Active
-
2014-11-17historical 118-char remark
Show marketing remark (118 chars)
Nestled in quiet corner near shopping but view is wooded. Great condo with nice floor plan. 2 BA & walk-in closets
-
2014-11-14soldstatus $61,000 118-char remark
Show marketing remark (118 chars)
Nestled in quiet corner near shopping but view is wooded. Great condo with nice floor plan. 2 BA & walk-in closets
-
2014-08-29$68,900 118-char remark
Show marketing remark (118 chars)
Nestled in quiet corner near shopping but view is wooded. Great condo with nice floor plan. 2 BA & walk-in closets
ⓘ Source: listings_history table (triggers on properties + properties_extension) + one-shot
backfill from property_details.listing_events for pre-trigger history.
Tax reassessment forecast IN · Partial reset (capped growth)
- Current annual tax
- $2,067 · $172/mo
- Projected year-2 tax
- $2,067 · $172/mo
- Expected delta
- $0/yr ($0/mo · 0.0%)
ⓘ Screening estimate from a state-policy table — verify with the county assessor before closing.
Climate risk First Street
- Flood 1/10 Low FEMA zone X (unshaded) · 0% chance over 30 yrs
- Wildfire 1/10 Low
- Heat 3/10 Moderate 7 d/yr ≥102°F today · 19 d/yr by 30 yrs out
- Wind 2/10 Low 100% chance of damaging wind over 30 yrs
- Air quality 3/10 Moderate 2 unhealthy d/yr today · 3 by 30 yrs out
Nearby sold comps map
Loading sold comps map…
Walkable amenities ~0.75 mi
Loading nearby amenities…
Taxation est. · year 1
- Rental income
- $20,862
- − Mortgage interest
- −$7,282
- − Property taxes
- −$2,067
- − Insurance
- −$650
- − Repairs & maintenance
- −$1,669
- − Management
- −$1,669
- − HOA
- −$2,400
- − Depreciation
- −$3,782
- Taxable income
- $1,343
- Est. tax owed @ 24.0%
- −$322
- After-tax cash flow
- $2,861/yr
For passive investors: Depreciation is non-cash, so a rental often shows a tax loss while cash-flowing — sheltering income. Rental losses are passive: they offset passive income freely, and up to $25,000/yr can offset ordinary (W-2) income if you actively participate and your MAGI is under $100k (phasing out to $0 by $150k); unused losses carry forward. On sale, claimed depreciation is recaptured at up to 25%, and gains may owe capital-gains tax (a 1031 exchange can defer both). Figures are a year-1 estimate at your 24.0% rate — not tax advice; consult a CPA.
Schools (NCES district)
- District
- Franklin Township Community School Corporation
- NCES district ID
- 1803750
- Math proficiency
- 42% ▼ -12.00%
- Reading proficiency
- 47% ▼ -6.00%
- Median HH income
- $67,825
- Composite
- 39.91/100
- National rank
- #3852
- State rank
- #87 of 301 in IN
Livability — Indianapolis city (balance)
No livability data for this city. (Only ~50 U.S. cities are tracked.)
Census & demographics
- Census place
- Indianapolis city (balance), IN
- County
- Marion County · 998,460 people
- City population
- 881,119
- Metro
- Indianapolis-Carmel-Anderson, IN
- Population (ZIP)
- 43,473
- Household income
- $79,078
- Rent vs Own
- Severe rent burden
- 1245.0
Population outlook (Marion County) Hauer SSP2
- Today (2025)
- 1,025,572 people
- By 2030
- 1,065,727 · +3.9%
- By 2040
- 1,141,577 · +11.3%
- By 2050
- 1,208,920 · +17.9%
- By 2075
- 1,367,288 · +33.3%
- By 2100
- 1,438,201 · +40.2%
Race, ethnicity, and origin ACS 2023
- Neighborhood character
- Predominantly White (71%)
- Race & ethnicity
- White 71% Asian 13% Hispanic / Latino 7% Two or more races 6% Black 5%
- Hispanic origin (detail)
- Mexican 6%
- Common ancestry
- Italian 2% Lithuanian 2% Romanian 2%
- Foreign-born
- 12% · Canada, Philippines
- Languages at home
- 84% English-only · Other Asian/Pacific 5% Spanish 5% Other Indo-European 4%
Political lean MEDSL · Marion
- 2024 margin
- Strong D (+27.7) · D 63.0% · R 35.3% · Other 1.7%
- 2008→2024 swing
- -0.7pp no change · 2008: 28.4pp · 2024: 27.7pp
- All cycles
- 2024: D+27.7 2020: D+29.1 2016: D+22.8 2012: D+22.2 2008: D+28.4
Not yet ingested
- Civics
- —
Market trends
- HPI YoY
- ▼ -180.33%
- Current HPI
- 238.9661
- Rent YoY
- ▲ 3.78%
- Metro
- Indianapolis-Carmel-Anderson, IN
- State GDP YoY
- ▲ 2.90%
- F500 in state
- 18
Industry mix (Fortune 500 HQ in IN)
| Industry | F500 HQs | Revenue |
|---|---|---|
| Industrial Machinery | 2 | $37B |
|
||
| Healthcare | 1 | $177B |
|
||
| Pharmaceuticals | 1 | $45B |
|
||
| Metals / Steel | 1 | $18B |
|
||
| Agriculture | 1 | $17B |
|
||
| Packaging | 1 | $12B |
|
||
Price history
+103.2% since first listed4 events — show timeline
- 2026-05-28 Listed $140,000 MIBOR as Distributed by MLS Grid
- 2014-11-17 Listing Removed — MIBOR as Distributed by MLS Grid
- 2014-11-14 Sold (MLS) $61,000 MIBOR as Distributed by MLS Grid
- 2014-08-29 Listed $68,900 MIBOR as Distributed by MLS Grid
Property tax history
+9.2%/yrLatest (2025): $2,067 · +1.4% YoY. Source: county tax records.
Cash-flow waterfall
monthlySold comps — $/sqft
last 12 mo · ≤1 miLoading sold comps…