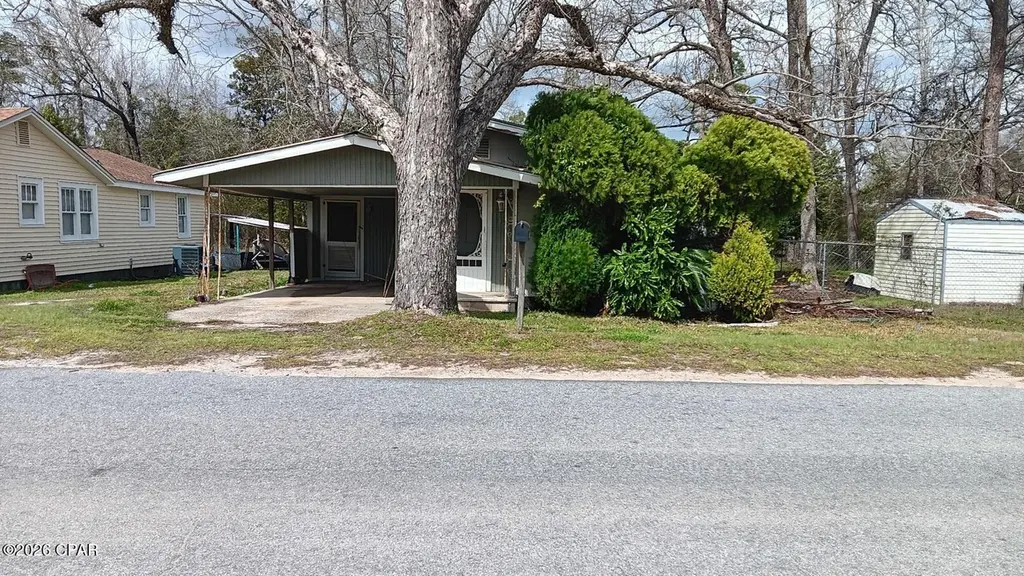
1352 Watts Ave · Chipley, FL
Flood risk 8/10 · Major
- FEMA flood zone
- X (unshaded)
- Chance of flooding over 30 yrs
- 0.99%
- Est. flood insurance / yr
- $507 – $1,088
Fire risk 5/10 · Moderate
- Est. fire insurance / yr
- $947 – $1,759
Heat risk 8/10 · Major
- Hot days now (above 107°F)
- 7 days/yr
- Hot days in 30 yrs
- 19 days/yr
Wind risk 9/10 · Severe
- Chance of severe wind over 30 yrs
- 99.0%
Air-quality risk 2/10 · Minimal
- Unhealthy air days now
- 2 days/yr
- Unhealthy air days in 30 yrs
- 2 days/yr
Risk factors via First Street. Map © Google.
Why this score? — see what drove the B- grade
The composite is a weighted blend of 9 inputs, each scored 0–100. Each bar is that input's sub-score; the figure is the points it added to the 100-point composite (weight × sub-score).
- Cash flow +30.0/30.0
- 1% rule +10.0/10.0
- DSCR +10.0/10.0
- ARV discount +7.5/15.0
- Schools +4.1/10.0
- Livability +3.3/5.0
- Rent growth +2.5/5.0
- Condition / age +2.5/5.0
- Appreciation +0.0/10.0
$49,900
🖨 Deal sheet 📄 Offer letter ✓ Due diligence
Listing remarks
Investor Special in the Heart of Chipley! Property is now priced below assessed value! This 3-bedroom, 2-bath home is ready for a complete rehab and offers a great opportunity to renovate to your vision. Located in the middle of Chipley, directly across from the Spanish Trail Playhouse and near Washington County schools. The seller plans to begin renovations soon, making this a great chance to get in early. Ideal for investors, flippers, or buyers looking for a full renovation project in a convenient location.
Key facts
- Covered front porch
- Attached carport
- Close to downtown
Tags
Property features AI
Exterior
- Parking: 1 covered parking space
- Utilities: Sewer available
- Home design: Single-story home; Facing information not provided; Property zoned: City
- Construction: Wood siding with wood frame construction; Metal roof
- Exterior features: Covered porch; Paved lot; City street frontage; Publicly maintained road
Interior
- Bedrooms: Bedroom (12 x 10)
- Bathrooms: 2 full bathrooms
- Heating & cooling: Window air conditioning units
- Interior features: Total of 3 rooms
Neighborhood map
What this means for you Summary
Snapshot
- This is a 3-bed/1.0-bath single-family listed at $50k.
Deal economics
- At list price, monthly cash flow is $476 ($6k/yr) — positive.
- The deal already cash-flows at list — no discount required.
- Meets the 1% rule at list price ($1k rent vs $50k).
- Cap rate 19.4% vs local median 3.2% in Chipley — top-decile yield for the area; either an underpriced asset or a hidden risk that comps aren't pricing in. Stress-test before assuming the spread holds.
Location & tenants
- Location reads 66/100 on livability (#614 in FL) — a middle-class / working-renter tenant base. Strengths: cost of living A+, housing A+, crime A-; Watch: health & safety D, amenities F, commute F.
- Washington (rural): math 49% / reading 50% proficiency, ranked #45 of 73 in FL (top 62%) — families likely to look elsewhere, expect single-tenant / working-renter base with shorter leases.
- Market conditions: 775 active listings in the ZIP; 217 units permitted in Washington County in 2024 (0 in 5+ unit buildings).
Forward outlook
- Local home prices are declining (-3.0%/yr); year-one equity from $345 of loan paydown is wiped out by about $1k of value loss. Plan a longer hold.
- Washington County population projected at -11% by 2050 — secular population decline; favor cash flow + early exit over multi-decade hold.
- At projected returns (-3.0% appreciation + 3.0% rent growth), your $14k cash investment doubles in ~3 years — after that, you're playing with house money.
Negotiation context
- Only 2 days on market — expect competitive offers; lowballing is unlikely to land.
- 5 sale attempts with the ask held roughly flat each time — persistent listings suggest the price (not the market) is what's stuck; bring a comps-based counter.
Risks & watch-outs
- Watch-outs: property tax is 2.9% of price; flood insurance adds $66/mo; built in 1956 — expect roof / HVAC / electrical / plumbing capex.
- Climate carrying-cost: severe flood risk; severe wind risk, 99% chance of damaging wind over 30y; moderate wildfire risk; extreme-heat days projected 7→19/yr by 2055 (HVAC capex compounding) — expect insurance premiums to compound above CPI over the hold.
Questions for the listing agent
- Built in 1956 — when were the roof, HVAC, electrical panel, plumbing, and water heater last replaced?
- Property tax is high relative to price — has the assessment been appealed recently, and will the sale trigger a re-assessment?
- What's the actual annual flood-insurance premium (NFIP or private), and is the property in a SFHA with mandatory coverage?
- Is there a deadline driving the sale (1031 exchange, divorce, estate, relocation)? That informs how much negotiation room exists.
- What's the average days-on-market for RENTAL listings here right now (not sales)? A rising rental-DOM trend means longer vacancies and softer asking-rent achievability than the comps imply.
- What's the recent tenant-quality profile in this submarket — average credit score on applications, eviction rate, late-payment / NSF rate, and stable-employment percentage? A property-management company in the area should have these aggregated.
- How much new for-sale + rental construction is in the pipeline within 1–3 miles? Heavy new supply typically softens prices + rents 12–24 months out; constrained supply supports both.
Investment metrics
- 1% rule
- 2.40% ✓
- Cap rate
- 19.35%
- Cash-on-cash
- 46.63%
- DSCR
- 3.07
- GRM
- 3.5
CMA / ARV
- ARV (median comp)
- $180,721
- List price
- $49,900
- Delta
- -70.12%
- Verdict
- UNDERPRICED
- Comps
- 20 within 1.0 mi
Show comp detail 11 sales within ~0.75 mi
| Address | Dist | Beds/Ba | Sqft | Sold | Price | $/sf | Match |
|---|---|---|---|---|---|---|---|
| 1380 Watts Ave | 0.13mi | 3/2.0 | 1,480 (+4%) | 2mo | $199,900 | $135 | 81 |
| 1331 Coggin Ave | 0.12mi | 3/1.0 | 1,316 (-7%) | 2mo | $180,000 | $137 | 81 |
| 1322 Coggin Ave | 0.18mi | 2/1.0 (-1) | 1,383 (-3%) | 6mo | $158,000 | $114 | 77 |
| 576 Martin Luther King Dr | 0.49mi | 3/1.0 | 1,343 (-5%) | 4mo | $160,000 | $119 | 65 |
| 616 3rd St | 0.21mi | 3/2.0 | 1,296 (-9%) | 16mo | $210,000 | $162 | 58 |
| 643 5th St | 0.29mi | 2/1.0 (-1) | 1,283 (-10%) | 12mo | $194,400 | $152 | 55 |
| 1311 Coggin Ave | 0.19mi | 3/2.0 | 1,533 (+8%) | 24mo | $195,000 | $127 | 54 |
| 678 3rd St | 0.20mi | 2/1.0 (-1) | 1,276 (-10%) | 20mo | $183,000 | $143 | 52 |
| 795 1st St | 0.65mi | 3/2.0 | 1,562 (+10%) | 2mo | $280,000 | $179 | 48 |
| 1275 Morris Ave | 0.73mi | 3/2.0 | 1,250 (-12%) | 7mo | $164,900 | $132 | 36 |
| 689 Deermont Cir | 0.72mi | 2/1.0 (-1) | 1,248 (-12%) | 11mo | $55,900 | $45 | 32 |
Match score weights: distance 35% · size 25% · config 20% · recency 20%. Top-matched comps best support the ARV.
Projected returns pro-forma
-3.0% appreciation · 3.0% rent growth · sell at horizon
- IRR
- 37.5%
- Equity multiple
- 2.60×
- Total profit
- $22,357
- Equity at exit
- $7,440
- IRR
- 44.1%
- Equity multiple
- 5.22×
- Total profit
- $58,929
- Equity at exit
- $4,314
Cash invested: $13,972 (down + closing). Projections, not guarantees.
Landlord ↔ Tenant lean methodology
- Overall (STATE)
- 87 Strongly Landlord-Friendly
- State Florida
- 87 Strongly Landlord-Friendly · R+3
- County
- — inherits STATE
- City
- — inherits STATE
ZIP-level market 32428
- Home prices YoY
- -9.2%
- Active inventory
- 775
- Price-to-rent
- 3.5×
Monthly cashflow live
- Estimated rent
- $1,196 medium interval (Pro) →
- Mortgage (P&I)
- −$262
- Tax from tax record
- −$120 /mo · $1,437/yr
- Insurance
- −$21
- Flood insurance flood zone
- −$66 /mo · $798/yr
- HOA
- −$0
- Vacancy / Maint / Mgmt
- −$251
- Net cashflow
- $476
Break-even live
UW: 25.0% down · 7.5% · 30yr · 1.5% tax · 5.0% vac · 8.0% maint · 8.0% mgmt
Financing live
Cash to close
- Down payment
- $12,475
- Closing costs
- $1,497
- Reserves months
- —
- Total cash needed
- —
Loan-product check · same deal, 3 products live
Conventional
25% down · 7.5% · 30yr
- Down + closing
- —
- Monthly P&I
- —
- Monthly cashflow
- —
- DSCR
- —
- Eligible?
- —
Personal DTI + credit; lowest rate.
DSCR
20% down · 8.5% · 30yr
- Down + closing
- —
- Monthly P&I
- —
- Monthly cashflow
- —
- DSCR
- —
- Eligible?
- —
No personal income docs; deal must DSCR.
Hard money
10% down · 12.0% · 12mo
- Down + closing
- —
- Monthly P&I
- —
- Monthly cashflow
- —
- DSCR
- —
- Eligible?
- —
Short-term bridge; refi at stabilization.
Listing history 23 events
-
2026-06-18days on market $49,900 Active 2 DOM
-
2026-06-17pricedays on market $49,900 Active 1 DOM
-
2026-06-15days on market $54,000 Active 49 DOM
-
2026-06-13days on market $54,000 Active 47 DOM
-
2026-06-12days on market $54,000 Active 46 DOM
-
2026-06-09days on market $54,000 Active 43 DOM
-
2026-06-08days on market $54,000 Active 42 DOM
-
2026-06-07days on market $54,000 Active 41 DOM
-
2026-06-07pricedays on market $54,000 Active 40 DOM
-
2026-06-04days on market $55,000 Active 37 DOM
-
2026-06-02days on market $55,000 Active 36 DOM
-
2026-06-01days on market $55,000 Active 35 DOM
-
2026-05-31days on market $55,000 Active 34 DOM
-
2026-05-31days on market $55,000 Active 33 DOM
-
2026-04-27$55,000 Active 516-char remark
-
2026-03-26historical
-
2026-03-17$55,000 Active
-
2026-03-17historical
-
2026-03-02price $68,000
-
2026-02-17price $74,000
-
2026-02-16status Active
-
2026-02-09status Pending
-
2026-01-28$75,000 Active
ⓘ Source: listings_history table (triggers on properties + properties_extension) + one-shot
backfill from property_details.listing_events for pre-trigger history.
Tax reassessment forecast FL · Resets to sale price
- Current annual tax
- $1,437 · $120/mo
- Projected year-2 tax
- $1,437 · $120/mo
- Expected delta
- $0/yr ($0/mo · 0.0%)
ⓘ Screening estimate from a state-policy table — verify with the county assessor before closing.
Climate risk First Street
- Flood 8/10 Severe FEMA zone X (unshaded) · 99% chance over 30 yrs
- Wildfire 5/10 Major
- Heat 8/10 Severe 7 d/yr ≥107°F today · 19 d/yr by 30 yrs out
- Wind 9/10 Extreme 99% chance of damaging wind over 30 yrs
- Air quality 2/10 Low 2 unhealthy d/yr today · 2 by 30 yrs out
Nearby sold comps map
Loading sold comps map…
Walkable amenities ~0.75 mi
Loading nearby amenities…
Taxation est. · year 1
- Rental income
- $14,358
- − Mortgage interest
- −$2,795
- − Property taxes
- −$1,437
- − Insurance
- −$1,047
- − Repairs & maintenance
- −$1,149
- − Management
- −$1,149
- − Depreciation
- −$1,452
- Taxable income
- $5,329
- Est. tax owed @ 24.0%
- −$1,279
- After-tax cash flow
- $4,439/yr
For passive investors: Depreciation is non-cash, so a rental often shows a tax loss while cash-flowing — sheltering income. Rental losses are passive: they offset passive income freely, and up to $25,000/yr can offset ordinary (W-2) income if you actively participate and your MAGI is under $100k (phasing out to $0 by $150k); unused losses carry forward. On sale, claimed depreciation is recaptured at up to 25%, and gains may owe capital-gains tax (a 1031 exchange can defer both). Figures are a year-1 estimate at your 24.0% rate — not tax advice; consult a CPA.
Schools (NCES district)
- District
- Washington
- NCES district ID
- 1202010
- Math proficiency
- 49% ▼ -7.00%
- Reading proficiency
- 50% ▼ -4.00%
- Median HH income
- $36,948
- Composite
- 41.12/100
- National rank
- #3561
- State rank
- #45 of 73 in FL
Livability — Chipley
- Score
- 66/100
- State rank
- #614
- US rank
- #11863
Category grades
Schools grade is shown separately in the Schools card above.
Census & demographics
- Census place
- Chipley, FL
- Population (ZIP)
- 18,015
Population outlook (Washington County) Hauer SSP2
- Today (2025)
- 24,087 people
- By 2030
- 23,600 · -2.0%
- By 2040
- 22,643 · -6.0%
- By 2050
- 21,524 · -10.6%
- By 2075
- 18,432 · -23.5%
- By 2100
- 13,298 · -44.8%
Race, ethnicity, and origin ACS 2023
- Neighborhood character
- Predominantly White (77%)
- Race & ethnicity
- White 77% Black 13% Two or more races 5% Hispanic / Latino 4% Asian 1%
- Common ancestry
- Slovak 2% Italian 2% Serbian 1%
- Foreign-born
- 3% · Canada
- Languages at home
- 93% English-only · Spanish 4% French/Haitian/Cajun 1%
Political lean MEDSL · Washington
- 2024 margin
- Solid R (+65.4) · D 17.0% · R 82.4%
- 2008→2024 swing
- -17.7pp toward R · 2008: -47.8pp · 2024: -65.4pp
- All cycles
- 2024: R+65.4 2020: R+61.1 2016: R+57.1 2012: R+47.4 2008: R+47.8
Not yet ingested
- Civics
- —
Market trends
- HPI YoY
- ▼ -24.96%
- Current HPI
- 247.8492
- Rent YoY
- —
- Metro
- —
- State GDP YoY
- ▲ 3.28%
- F500 in state
- 36
Industry mix (Fortune 500 HQ in FL)
| Industry | F500 HQs | Revenue |
|---|---|---|
| Industrial Technology | 2 | $29B |
|
||
| Insurance | 2 | $17B |
|
||
| Retail | 1 | $60B |
|
||
| Technology Distribution | 1 | $58B |
|
||
| Homebuilding | 1 | $35B |
|
||
| Technology Manufacturing | 1 | $35B |
|
||
Price history
-33.5% since first listed12 events — show timeline
- 2026-06-16 Listed $49,900 CPARMLS
- 2026-06-15 Listing Removed — CPARMLS
- 2026-06-05 Price Changed $54,000 CPARMLS
- 2026-04-27 Listed $55,000 CPARMLS
- 2026-03-26 Listing Removed — CPARMLS
- 2026-03-17 Listing Removed — CPARMLS
- 2026-03-17 Listed $55,000 CPARMLS
- 2026-03-02 Price Changed $68,000 CPARMLS
- 2026-02-17 Price Changed $74,000 CPARMLS
- 2026-02-16 Relisted — CPARMLS
- 2026-02-09 Pending — CPARMLS
- 2026-01-28 Listed $75,000 CPARMLS
Property tax history
+27.1%/yrLatest (2025): $1,437 · +4.2% YoY. Source: county tax records.
Cash-flow waterfall
monthlySold comps — $/sqft
last 12 mo · ≤1 miLoading sold comps…