3278 Glen Eagle Ln · Kenner, LA
Flood risk No data
- FEMA flood zone
- —
- Chance of flooding over 30 yrs
- —
- Est. flood insurance / yr
- —
Fire risk No data
- Est. fire insurance / yr
- —
Heat risk No data
- Hot days now (above threshold)
- —
- Hot days in 30 yrs
- —
Wind risk No data
- Chance of severe wind over 30 yrs
- —
Air-quality risk No data
- Unhealthy air days now
- —
- Unhealthy air days in 30 yrs
- —
Risk factors via First Street. Map © Google.
Why this score? — see what drove the D grade
The composite is a weighted blend of 9 inputs, each scored 0–100. Each bar is that input's sub-score; the figure is the points it added to the 100-point composite (weight × sub-score).
- Cash flow +17.3/30.0
- DSCR +5.4/10.0
- ARV discount +4.8/15.0
- Livability +3.9/5.0
- 1% rule +3.6/10.0
- Schools +2.5/10.0
- Condition / age +2.5/5.0
- Rent growth +1.5/5.0
- Appreciation +0.0/10.0
$209,000
🖨 Deal sheet (PDF) 📄 Offer letter ✓ Due diligence
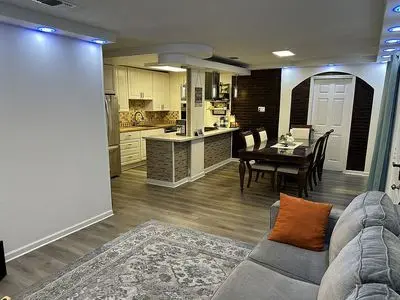
Listing remarks
Beautiful updated 3 bed / 2 bath home located in a desirable Kenner neighborhood. Features a spacious backyard, updated interior, open living space, and great potential for homeowners or investors. Convenient location near shopping, restaurants, schools Roof may need some attention and price reflects condition. Sold AS-IS.
Key facts
- Spacious backyard
- Updated interior
- Open living space
Tags
Neighborhood map
What this means for you Summary
Snapshot
- This is a 3-bed/2.0-bath single-family listed at $209k.
Deal economics
- At list price, monthly cash flow is $154 ($2k/yr) — positive.
- The deal already cash-flows at list — no discount required.
- To meet the 1% rule (rent ≥ 1% of price), the offer needs to be $179k (14.3% below list).
- Recommended offer: $179k (14.3% below list) — sets the bar for 1% rule.
- Cap rate 7.2% vs local median 5.3% in Kenner — top-decile yield for the area; either an underpriced asset or a hidden risk that comps aren't pricing in. Stress-test before assuming the spread holds.
Location & tenants
- Location reads 78/100 on livability (#6 in LA, #2,414 nationally) — a middle-class / working-renter tenant base. Strengths: cost of living A+, housing A+, health & safety A+; Watch: amenities C-, employment C-, crime D.
- Jefferson Parish (suburban): math 24% / reading 34% proficiency, ranked #44 of 98 in LA (top 45%) — low school quality limits family demand, transient renter base, plan for 1-2y turnover; 70% free/reduced lunch — lower-income household profile, screen leases tightly.
- Zoned schools: A.C. Alexander School (math 26% / reading 39%, grade F, #300 of 646 statewide, top 47%, 680 students, 59% FRL); Tom Benson School (math 11% / reading 14%, grade F, #546 of 646 statewide, top 85%, 753 students, 60% FRL); Bonnabel Magnet Academy High School (math 12% / reading 21%, grade F, #214 of 265 statewide, top 81%, 1,478 students, 52% FRL).
- Market conditions: Rents falling (-4.2%/yr); 292 active listings in the ZIP; 40 comparable units currently listed for rent nearby; rentals lingering (median 45d on market — plan ~5-8 weeks vacancy on turnover, expect pricing pressure); 52% of comp listings sitting > 30 days — soft ceiling on asking rent; 518 units permitted in Jefferson Parish in 2024 (43 in 5+ unit buildings).
- This rent runs 32% of the median local income ($67k/yr) — at the standard rent-burdened threshold; future hikes will face affordability resistance.
Forward outlook
- Local home prices are declining (-3.0%/yr); year-one equity from $1k of loan paydown is wiped out by about $6k of value loss. Plan a longer hold.
Negotiation context
- It's been on market 40 days — a 3% lower offer ($203k) is reasonable based on typical stale-listing flexibility.
- 5 sale attempts since 10y ago with the ask held roughly flat each time — persistent listings suggest the price (not the market) is what's stuck; bring a comps-based counter.
- Current owner paid $92k; list at $209k implies a 127% gain — meaningful room to come down on a strong offer.
Questions for the listing agent
- It's been on market 40 days. Have you received any prior offers? Is the seller open to a 14% concession, seller financing, or rate buy-down credit?
- Built in 1976 — when were the roof, HVAC, electrical panel, plumbing, and water heater last replaced?
- Is there a deadline driving the sale (1031 exchange, divorce, estate, relocation)? That informs how much negotiation room exists.
- Crime grade is D in this area — have there been break-ins, vandalism, or insurance claims at this property in the last 3 years? What carrier currently insures it and at what premium?
- The area grade is low — what's the realistic commute time and amenity access for the typical tenant pool here? Any planned neighborhood developments (good or bad) we should know about?
- What's the average days-on-market for RENTAL listings here right now (not sales)? A rising rental-DOM trend means longer vacancies and softer asking-rent achievability than the comps imply.
- What's the recent tenant-quality profile in this submarket — average credit score on applications, eviction rate, late-payment / NSF rate, and stable-employment percentage? A property-management company in the area should have these aggregated.
- How much new for-sale + rental construction is in the pipeline within 1–3 miles? Heavy new supply typically softens prices + rents 12–24 months out; constrained supply supports both.
Investment metrics
- 1% rule
- 0.86% ✗
- Cap rate
- 7.18%
- Cash-on-cash
- 3.16%
- DSCR
- 1.14
- GRM
- 9.7
CMA / ARV
- ARV (on-the-fly)
- $197,160
- Comps found
- 12
Show comp detail 12 sales within ~0.75 mi
| Address | Dist | Beds/Ba | Sqft | Sold | Price | $/sf | Match |
|---|---|---|---|---|---|---|---|
| 669 Spartan Ln | 0.14mi | 4/2.0 (+1) | 1,199 (-3%) | 0mo | $259,000 | $216 | 82 |
| 701 Ronson Dr | 0.19mi | 4/2.0 (+1) | 1,213 (-2%) | 2mo | $250,000 | $206 | 81 |
| 601 Lancer Ln | 0.17mi | 3/2.0 | 1,182 (-5%) | 8mo | $187,750 | $159 | 78 |
| 717 Mayfair Ln | 0.30mi | 3/2.0 | 1,303 (+5%) | 2mo | $265,000 | $203 | 76 |
| 648 Mayfair Ln | 0.31mi | 4/2.0 (+1) | 1,285 (+4%) | 3mo | $180,000 | $140 | 72 |
| 3289 Continental Dr | 0.17mi | 3/1.5 | 1,123 (-9%) | 6mo | $174,000 | $155 | 69 |
| 822 Veterans Blvd | 0.67mi | 3/1.5 | 1,275 (+3%) | 2mo | $125,000 | $98 | 61 |
| 2 Bradley Pl | 0.49mi | 3/2.0 | 1,378 (+11%) | 4mo | $275,900 | $200 | 55 |
| 361 W Louisiana State St | 0.61mi | 3/1.5 | 1,350 (+9%) | 1mo | $196,000 | $145 | 54 |
| 437 Pellerin Dr | 0.52mi | 3/2.0 | 1,397 (+13%) | 7mo | $260,000 | $186 | 49 |
| 2803 Panama St | 0.63mi | 4/1.0 (+1) | 1,151 (-7%) | 7mo | $159,000 | $138 | 44 |
| 1215 31 Street St | 0.60mi | 4/2.0 (+1) | 1,415 (+14%) | 2mo | $120,000 | $85 | 42 |
Match score weights: distance 35% · size 25% · config 20% · recency 20%. Top-matched comps best support the ARV.
Projected returns pro-forma
-3.0% appreciation · 0.0% rent growth · sell at horizon
- IRR
- -14.4%
- Equity multiple
- 0.50×
- Total profit
- $-29,376
- Equity at exit
- $31,163
- IRR
- -10.8%
- Equity multiple
- 0.43×
- Total profit
- $-33,560
- Equity at exit
- $18,071
Cash invested: $58,520 (down + closing). Projections, not guarantees.
Landlord ↔ Tenant lean methodology
- Overall (STATE)
- 90 Strongly Landlord-Friendly
- State Louisiana
- 90 Strongly Landlord-Friendly · R+12
- County
- — inherits STATE
- City
- — inherits STATE
ZIP-level market 70065
- Rents YoY
- -4.2%
- Active inventory
- 292
- Price-to-rent
- 9.7×
Monthly cashflow live
- Estimated rent
- $1,791 high interval (Pro) →
- Mortgage (P&I)
- −$1,096
- Tax from tax record
- −$77 /mo · $929/yr
- Insurance
- −$87
- HOA
- −$0
- Vacancy / Maint / Mgmt
- −$376
- Net cashflow
- $154
Break-even live
Sensitivity live
| Price | -10% $273 | -5% $213 | +0% $154 | +5% $95 | +10% $36 |
|---|---|---|---|---|---|
| Rent | -10% $13 | -5% $84 | +0% $154 | +5% $225 | +10% $296 |
| Rate | -1.0pp $260 | -0.5pp $207 | base $154 | +0.5pp $100 | +1.0pp $45 |
UW: 25.0% down · 7.5% · 30yr · 1.5% tax · 5.0% vac · 8.0% maint · 8.0% mgmt
Financing live
Cash to close
- Down payment
- $52,250
- Closing costs
- $6,270
- Reserves months
- —
- Total cash needed
- —
Loan-product check · same deal, 3 products live
Conventional
25% down · 7.5% · 30yr
- Down + closing
- —
- Monthly P&I
- —
- Monthly cashflow
- —
- DSCR
- —
- Eligible?
- —
Personal DTI + credit; lowest rate.
DSCR
20% down · 8.5% · 30yr
- Down + closing
- —
- Monthly P&I
- —
- Monthly cashflow
- —
- DSCR
- —
- Eligible?
- —
No personal income docs; deal must DSCR.
Hard money
10% down · 12.0% · 12mo
- Down + closing
- —
- Monthly P&I
- —
- Monthly cashflow
- —
- DSCR
- —
- Eligible?
- —
Short-term bridge; refi at stabilization.
Rent comps 40 comps
| Address | Beds | Baths | Sqft | Rent | $/sqft | DOM | Units | Dist |
|---|---|---|---|---|---|---|---|---|
| 3120 Phoenix St Unit D Kenner, LA | 2.0 | 1.5 | 1075 | $1,100 | $1.02 | 45d | 1 | 0.34mi |
| 215 Avant Garde Cir Kenner, LA | 2.0 | 2.0 | 1200 | $1,500 | $1.25 | 4d | 1 | 0.38mi |
| 187 Avant Garde Cir #187 Kenner, LA | 2.0 | 1.5 | 1050 | $1,500 | $1.43 | 16d | 1 | 0.39mi |
| 1201 W Esplanade Ave Kenner, LA | 1.0–2.0 | 1.0–2.0 | 746 | $1,110 | $1.49 | 45d | 1 | 0.52mi |
| 309 Emerson Dr Unit C Kenner, LA | 3.0 | 1.0 | 900 | $1,200 | $1.33 | 5d | 1 | 0.62mi |
| 300 Duke Dr Unit 4 Kenner, LA | 2.0 | 1.0 | 838 | $1,200 | $1.43 | 45d | 1 | 0.66mi |
| 300 Clemson Dr Kenner, LA | 2.0 | 1.5 | 1025 | $1,500 | $1.46 | 16d | 1 | 0.68mi |
| 2752 Jasper St Unit A Kenner, LA | 3.0 | 1.5 | 1400 | $1,450 | $1.04 | 45d | 1 | 0.71mi |
| 2759 Albany St Unit B Kenner, LA | 3.0 | 2.0 | 1250 | $1,500 | $1.20 | 45d | 1 | 0.72mi |
| 2755 Huntsville St Apt C Kenner, LA | 3.0 | 2.0 | 1216 | $1,575 | $1.30 | 5d | 1 | 0.72mi |
| 2755 Huntsville St Unit B Kenner, LA | 3.0 | 1.5 | 1500 | $1,650 | $1.10 | 45d | 1 | 0.72mi |
| 2755 Albany St Unit D Kenner, LA | 3.0 | 2.0 | 1250 | $1,500 | $1.20 | 45d | 1 | 0.73mi |
| 1400 W Esplanade Ave Kenner, LA | 2.0 | 1.0–2.5 | 801 | $1,370 | $1.71 | 45d | 1 | 0.78mi |
| 1500 W Esplanade Ave Kenner, LA | 2.0–3.0 | 2.0 | 1587 | $2,000 | $1.26 | 45d | 1 | 0.81mi |
| 1516 Mayfield St Kenner, LA | 3.0 | 2.0 | 1407 | $1,900 | $1.35 | 45d | 1 | 0.83mi |
| 1516 Mayfield St Kenner, LA | 3.0 | 2.0 | 1407 | $1,900 | $1.35 | 46d | 1 | 0.83mi |
| 2723 Tifton Ave Kenner, LA | 3.0 | 2.0 | 1200 | $1,800 | $1.50 | 25d | 1 | 0.85mi |
| 2804 Salem St Kenner, LA | 2.0 | 2.0 | 1450 | $1,400 | $0.97 | 45d | 1 | 0.86mi |
| 2710 Helena St Kenner, LA | 3.0 | 1.5 | 1400 | $1,200 | $0.86 | 16d | 1 | 0.87mi |
| 2838 Kingston St Unit A Kenner, LA | 3.0 | 1.5 | 1500 | $1,600 | $1.07 | 5d | 1 | 0.87mi |
| 2714 Tifton St Kenner, LA | 3.0 | 2.0 | 1275 | $1,800 | $1.41 | 45d | 1 | 0.88mi |
| 2700 Helena St Kenner, LA | 3.0 | 1.5 | 1355 | $1,700 | $1.25 | 45d | 1 | 0.89mi |
| 511 27th St Kenner, LA | 3.0 | 2.0 | 1200 | $1,575 | $1.31 | 5d | 1 | 0.90mi |
| 2625 Panama St Kenner, LA | 2.0 | 1.0 | 930 | $1,300 | $1.40 | 3d | 1 | 0.91mi |
| 2726 Greenwood St Kenner, LA | 2.0 | 1.5 | 980 | $1,200 | $1.22 | 45d | 1 | 0.92mi |
| 2617 Phoenix St Kenner, LA | 3.0 | 2.0 | 1350 | $1,800 | $1.33 | 45d | 1 | 0.93mi |
| 3600 Loyola Dr Unit 353 Kenner, LA | 2.0 | 2.0 | 1100 | $1,445 | $1.31 | 45d | 1 | 0.93mi |
| 2603 Panama St Kenner, LA | 3.0 | 1.5 | 1400 | $1,400 | $1.00 | 25d | 1 | 0.95mi |
| 129 Auburn Pl Kenner, LA | 3.0 | 2.0 | 1200 | $1,800 | $1.50 | 3d | 1 | 0.96mi |
| 3611 Arizona Ave Kenner, LA | 4.0 | 2.0 | 1287 | $1,900 | $1.48 | 5d | 1 | 0.96mi |
| 2800 Richland St Unit B Kenner, LA | 2.0 | 2.5 | 1000 | $1,600 | $1.60 | 22d | 1 | 0.96mi |
| 3655 Loyola Dr Unit F361 Kenner, LA | 2.0 | 2.0 | 1330 | $2,395 | $1.80 | 25d | 1 | 0.97mi |
| 2609 Dawson Ave Kenner, LA | 3.0 | 2.0 | 1300 | $1,600 | $1.23 | 45d | 1 | 0.98mi |
| 2611 Augusta St Kenner, LA | 3.0 | 2.0 | 1300 | $1,900 | $1.46 | 45d | 1 | 0.98mi |
| 3655 Loyola Dr Unit D236 Kenner, LA | 2.0 | 2.0 | 1367 | $2,320 | $1.70 | 3d | 1 | 0.98mi |
| 3655 Loyola Dr Unit C223 Kenner, LA | 2.0 | 2.0 | 1330 | $2,295 | $1.73 | 3d | 1 | 0.98mi |
| 3655 Loyola Dr Unit C229 Kenner, LA | 2.0 | 2.0 | 1349 | $2,335 | $1.73 | 45d | 1 | 0.98mi |
| 3655 Loyola Dr Unit C224 Kenner, LA | 2.0 | 2.0 | 1367 | $2,305 | $1.69 | 3d | 1 | 0.98mi |
| 3655 Loyola Dr Apt F261 Kenner, LA | 2.0 | 2.0 | 1330 | $2,425 | $1.82 | 16d | 1 | 0.98mi |
| 3655 Loyola Dr Unit C329 Kenner, LA | 2.0 | 2.0 | 1349 | $2,320 | $1.72 | 45d | 1 | 0.98mi |
Listing history 33 events
-
2026-06-21days on market $209,000 Active 40 DOM
-
2026-06-18days on market $209,000 Active 37 DOM
-
2026-06-17days on market $209,000 Active 36 DOM
-
2026-06-16days on market $209,000 Active 35 DOM
-
2026-06-15days on market $209,000 Active 34 DOM
-
2026-06-13days on market $209,000 Active 32 DOM
-
2026-06-10days on market $209,000 Active 29 DOM
-
2026-06-09days on market $209,000 Active 28 DOM
-
2026-06-08days on market $209,000 Active 27 DOM
-
2026-06-07days on market $209,000 Active 26 DOM
-
2026-06-03days on market $209,000 Active 22 DOM
-
2026-06-02days on market $209,000 Active 21 DOM
-
2026-06-01days on market $209,000 Active 20 DOM
-
2026-05-31days on market $209,000 Active 19 DOM
-
2026-05-12$209,000 Active 324-char remark
-
2025-12-04price $209,000
-
2025-12-04price $209,000
-
2025-08-31price $219,000
-
2025-08-31price $219,000
-
2025-06-07price $229,000
-
2025-06-07price $229,000
-
2025-05-11$235,000 Active
-
2022-05-12soldstatus $92,000
-
2018-10-25soldstatus $92,000
-
2018-05-04soldstatus $74,000
-
2016-06-14soldstatus $74,000
-
2016-06-13soldstatus $74,000 Sold
-
2016-05-26historical Pending Continue to Show
-
2016-05-20status Active
-
2016-05-07historical Pending Continue to Show
-
2016-04-29$75,000 Active
-
2016-04-28$75,000
-
1989-04-01soldstatus $55,000
ⓘ Source: listings_history table (triggers on properties + properties_extension) + one-shot
backfill from property_details.listing_events for pre-trigger history.
Tax reassessment forecast LA · Resets to sale price
- Current annual tax
- $929 · $77/mo
- Projected year-2 tax
- $1,150 · $96/mo
- Expected delta
- +$221/yr (+$18/mo · 23.8%)
ⓘ Screening estimate from a state-policy table — verify with the county assessor before closing.
Nearby sold comps map
Loading sold comps map…
Walkable amenities ~0.75 mi
Loading nearby amenities…
Taxation est. · year 1
- Rental income
- $21,490
- − Mortgage interest
- −$11,707
- − Property taxes
- −$929
- − Insurance
- −$1,045
- − Repairs & maintenance
- −$1,719
- − Management
- −$1,719
- − Depreciation
- −$6,080
- Taxable loss
- −$1,709
- Est. tax savings @ 24.0%
- +$410
- After-tax cash flow
- $2,261/yr
For passive investors: Depreciation is non-cash, so a rental often shows a tax loss while cash-flowing — sheltering income. Rental losses are passive: they offset passive income freely, and up to $25,000/yr can offset ordinary (W-2) income if you actively participate and your MAGI is under $100k (phasing out to $0 by $150k); unused losses carry forward. On sale, claimed depreciation is recaptured at up to 25%, and gains may owe capital-gains tax (a 1031 exchange can defer both). Figures are a year-1 estimate at your 24.0% rate — not tax advice; consult a CPA.
Schools (NCES district)
- District
- Jefferson Parish
- NCES district ID
- 2200840
- Math proficiency
- 24% ▼ -36.00%
- Reading proficiency
- 34% ▼ -30.00%
- Median HH income
- $48,421
- Composite
- 25.19/100
- National rank
- #7511
- State rank
- #44 of 98 in LA
Livability — Kenner
- Score
- 78/100
- State rank
- #6
- US rank
- #2414
Category grades
Schools grade is shown separately in the Schools card above.
Census & demographics
- Census place
- Kenner, LA
- County
- Jefferson Parish · 426,999 people
- City population
- 66,707
- Metro
- New Orleans-Metairie, LA
- Population (ZIP)
- 48,936
- Household income
- $67,285
- Rent vs Own
- Severe rent burden
- 1906.0
Population outlook (Jefferson County) Hauer SSP2
- Today (2025)
- 451,696 people
- By 2030
- 455,451 · +0.8%
- By 2040
- 458,308 · +1.5%
- By 2050
- 461,031 · +2.1%
- By 2075
- 476,351 · +5.5%
- By 2100
- 499,377 · +10.6%
Race, ethnicity, and origin ACS 2023
- Neighborhood character
- Diverse neighborhood (Simpson 0.69)
- Race & ethnicity
- White 47% Hispanic / Latino 27% Two or more races 15% Black 15% Asian 6%
- Hispanic origin (detail)
- Mexican 2% Puerto Rican 3% Cuban 2%
- Common ancestry
- Lithuanian 9% Slovak 1% Italian 1%
- Foreign-born
- 19% · Canada, China, Vietnam
- Languages at home
- 72% English-only · Spanish 21% Other Indo-European 3% Arabic 1%
Political lean MEDSL · Jefferson
- 2024 margin
- R (+12.9) · D 42.5% · R 55.5% · Other 2.1%
- 2008→2024 swing
- +13.6pp toward D · 2008: -26.6pp · 2024: -12.9pp
- All cycles
- 2024: R+12.9 2020: R+11.1 2016: R+14.8 2012: R+18.4 2008: R+26.6
Not yet ingested
- Civics
- —
Market trends
- HPI YoY
- ▼ -214.79%
- Current HPI
- 139.5115
- Rent YoY
- ▼ -4.19%
- Metro
- New Orleans-Metairie, LA
- State GDP YoY
- ▲ 3.29%
- F500 in state
- 10
Industry mix (Fortune 500 HQ in LA)
| Industry | F500 HQs | Revenue |
|---|---|---|
| Telecommunications | 2 | $23B |
|
||
| Utilities | 1 | $12B |
|
||
| Wholesale / Distribution | 1 | $5B |
|
||
| Advertising | 1 | $2B |
|
||
Price history
+280.0% since first listed19 events — show timeline
- 2026-05-12 Listed $209,000 FSBO.com
- 2025-12-04 Price Changed $209,000 AcadianaMLS
- 2025-12-04 Price Changed $209,000 GSREIN
- 2025-08-31 Price Changed $219,000 AcadianaMLS
- 2025-08-31 Price Changed $219,000 GSREIN
- 2025-06-07 Price Changed $229,000 AcadianaMLS
- 2025-06-07 Price Changed $229,000 GSREIN
- 2025-05-11 Listed $235,000 AcadianaMLS
- 2022-05-12 Sold (Public Records) $92,000 Public Records
- 2018-10-25 Sold (Public Records) $92,000 Public Records
- 2018-05-04 Sold (Public Records) $74,000 Public Records
- 2016-06-14 Sold (Public Records) $74,000 Public Records
- 2016-06-13 Sold (MLS) $74,000 GSREIN
- 2016-05-26 Contingent — GSREIN
- 2016-05-20 Relisted — GSREIN
- 2016-05-07 Contingent — GSREIN
- 2016-04-29 Listed $75,000 GSREIN
- 2016-04-28 Listed $75,000 AcadianaMLS
- 1989-04-01 Sold (Public Records) $55,000 Public Records
Property tax history
+2.4%/yrLatest (2025): $929 · -0.4% YoY. Source: county tax records.
Cash-flow waterfall
monthlySold comps — $/sqft
last 12 mo · ≤1 miLoading sold comps…