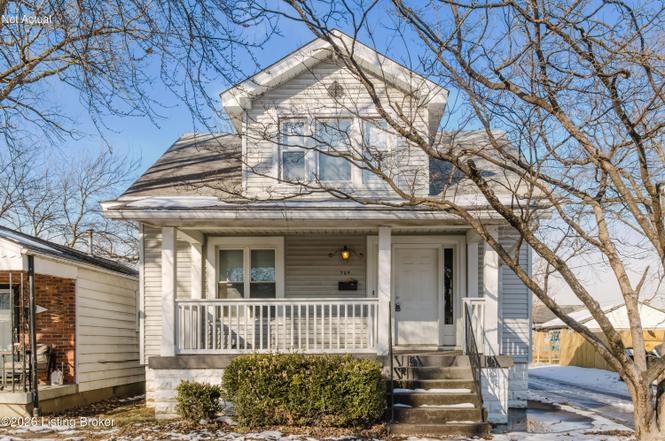
709 M St · Louisville, KY
Flood risk 7/10 · Major
- FEMA flood zone
- X (unshaded)
- Chance of flooding over 30 yrs
- 0.99%
- Est. flood insurance / yr
- $473 – $860
Fire risk 1/10 · Minimal
- Est. fire insurance / yr
- $839 – $1,559
Heat risk 5/10 · Moderate
- Hot days now (above 104°F)
- 7 days/yr
- Hot days in 30 yrs
- 20 days/yr
Wind risk 2/10 · Minimal
- Chance of severe wind over 30 yrs
- 1.0%
Air-quality risk 2/10 · Minimal
- Unhealthy air days now
- 1 days/yr
- Unhealthy air days in 30 yrs
- 3 days/yr
Risk factors via First Street. Map © Google.
Why this score? — see what drove the B- grade
The composite is a weighted blend of 9 inputs, each scored 0–100. Each bar is that input's sub-score; the figure is the points it added to the 100-point composite (weight × sub-score).
- Cash flow +26.2/30.0
- ARV discount +15.0/15.0
- DSCR +8.9/10.0
- 1% rule +6.4/10.0
- Rent growth +4.0/5.0
- Livability +3.2/5.0
- Condition / age +2.5/5.0
- Schools +2.3/10.0
- Appreciation +0.0/10.0
$139,900
🖨 Deal sheet (PDF) 📄 Offer letter ✓ Due diligence
Listing remarks MLS
Great Location! Close to U of L Campus, Baseball Stadium, Football Stadium, and Churchill Downs. This home has 3 year old roof, new HVAC system! New carpet and fresh paint make this one move in ready. Won't Last long at this price, schedule a showing today!
Key facts
- Charming front porch
- Unfinished basement
- 3,659 sq ft lot
Tags
Property features AI
Finance
- Other: Subdivision: Progress Land Co
- HOA & community: No association fee
Exterior
- Utilities: Natural gas service
- Home design: Single-family bungalow; Two stories; Built in 1920
- Construction: Vinyl siding, wood frame, and stone veneer exterior; Shingle roof; Poured concrete foundation
- Exterior features: Chain link fencing; Lot dimensions approximately 30 x 125
Interior
- Kitchen: Kitchen on the first floor
- Bedrooms: Three bedrooms total; Primary bedroom on the first floor; One bedroom on the first floor and two bedrooms on the second floor
- Bathrooms: One full bathroom on the first floor
- Heating & cooling: Forced air heating (natural gas); Central air conditioning
- Interior features: Six total rooms; Four closets; Unfinished basement
- Laundry & utility: No first-floor laundry
Neighborhood map
What this means for you Summary
Snapshot
- This is a 3-bed/1.0-bath single-family listed at $140k.
Deal economics
- At list price, monthly cash flow is $300 ($4k/yr) — positive.
- The deal already cash-flows at list — no discount required.
- Meets the 1% rule at list price ($2k rent vs $140k).
- Recommended offer: $127k (9.0% below list) — sets the bar for market timing.
- Cap rate 9.3% vs local median 5.0% in Louisville — top-decile yield for the area; either an underpriced asset or a hidden risk that comps aren't pricing in. Stress-test before assuming the spread holds.
Location & tenants
- Location reads 63/100 on livability (#333 in KY) — a middle-class / working-renter tenant base. Strengths: cost of living A+, housing A+; Watch: employment C-, health & safety D+, schools D-.
- Jefferson County (urban): math 19% / reading 35% proficiency, ranked #121 of 165 in KY (top 73%) — low school quality limits family demand, transient renter base, plan for 1-2y turnover.
- Market conditions: Rents rising fast (+6.1%/yr); 77 active listings in the ZIP; 33 comparable units currently listed for rent nearby; rentals at typical pace (median 17d on market — plan ~3-4 weeks tenant-placement turnaround); lower-income renter base — watch delinquency; 2,836 units permitted in Jefferson County in 2024 (1,558 in 5+ unit buildings).
- At $1,591/mo this rent would consume 48% of the median local household income ($40k/yr) (locally 1136% of renters already pay >50% of income on rent) — very limited rent-growth headroom before tenants either downsize or default.
Forward outlook
- Local home prices are declining (-3.0%/yr); year-one equity from $967 of loan paydown is wiped out by about $4k of value loss. Plan a longer hold.
- Jefferson County population projected at +13% by 2050 — modest demand growth; plan on rents tracking national, not racing it.
- At projected returns (-3.0% appreciation + 6.1% rent growth), your $39k cash investment doubles in ~9 years — after that, you're playing with house money.
Negotiation context
- It's been on market 119 days — a 9% lower offer ($127k) is reasonable based on typical stale-listing flexibility.
- 3 sale attempts since 17y ago; this cycle's ask has dropped $20k (13%) from the opening price — seller is motivated, your offer sets the floor, not the list.
- Current owner paid $62k; list at $140k implies a 124% gain — meaningful room to come down on a strong offer.
Risks & watch-outs
- Watch-outs: flood insurance adds $56/mo; built in 1920 — expect roof / HVAC / electrical / plumbing capex.
- Climate carrying-cost: major flood risk; extreme-heat days projected 7→20/yr by 2055 (HVAC capex compounding) — expect insurance premiums to compound above CPI over the hold.
Questions for the listing agent
- It's been on market 119 days. Have you received any prior offers? Is the seller open to a 9% concession, seller financing, or rate buy-down credit?
- Built in 1920 — when were the roof, HVAC, electrical panel, plumbing, and water heater last replaced?
- What's the actual annual flood-insurance premium (NFIP or private), and is the property in a SFHA with mandatory coverage?
- Why hasn't it sold? Are there any deal-killer items the seller is aware of (foundation, flood, title, zoning, code violations)?
- Is there a deadline driving the sale (1031 exchange, divorce, estate, relocation)? That informs how much negotiation room exists.
- Schools are D-rated, which usually means shorter tenancies and higher turnover. Who's the typical renter profile here, and what's been the actual vacancy rate?
- Crime grade is F in this area — have there been break-ins, vandalism, or insurance claims at this property in the last 3 years? What carrier currently insures it and at what premium?
- What's the average days-on-market for RENTAL listings here right now (not sales)? A rising rental-DOM trend means longer vacancies and softer asking-rent achievability than the comps imply.
- What's the recent tenant-quality profile in this submarket — average credit score on applications, eviction rate, late-payment / NSF rate, and stable-employment percentage? A property-management company in the area should have these aggregated.
- How much new for-sale + rental construction is in the pipeline within 1–3 miles? Heavy new supply typically softens prices + rents 12–24 months out; constrained supply supports both.
Investment metrics
- 1% rule
- 1.14% ✓
- Cap rate
- 9.35%
- Cash-on-cash
- 10.90%
- DSCR
- 1.49
- GRM
- 7.3
CMA / ARV
- ARV (on-the-fly)
- $175,168
- Comps found
- 12
Show comp detail 12 sales within ~0.75 mi
| Address | Dist | Beds/Ba | Sqft | Sold | Price | $/sf | Match |
|---|---|---|---|---|---|---|---|
| 708 Iowa Ave | 0.09mi | 3/2.0 | 1,550 (-1%) | 5mo | $180,000 | $116 | 86 |
| 514 Winkler Ave | 0.20mi | 3/1.0 | 1,659 (+6%) | 1mo | $142,500 | $86 | 80 |
| 513 M St | 0.17mi | 3/1.0 | 1,464 (-6%) | 2mo | $160,000 | $109 | 80 |
| 713 Creel Ave | 0.29mi | 3/1.0 | 1,385 (-11%) | 5mo | $155,000 | $112 | 63 |
| 1319 Larchmont Ave | 0.54mi | 2/1.0 (-1) | 1,492 (-5%) | 3mo | $159,900 | $107 | 60 |
| 1121 Larchmont Ave | 0.44mi | 3/2.0 | 1,426 (-9%) | 3mo | $150,000 | $105 | 58 |
| 1400 Homeview Dr | 0.63mi | 4/2.0 (+1) | 1,718 (+10%) | 2mo | $130,000 | $76 | 43 |
| 1428 Homeview Dr | 0.70mi | 2/1.0 (-1) | 1,438 (-8%) | 8mo | $177,500 | $123 | 43 |
| 1279 Weller Ave | 0.59mi | 2/1.5 (-1) | 1,381 (-12%) | 6mo | $170,000 | $123 | 41 |
| 1516 Larchmont Ave | 0.73mi | 3/2.0 | 1,396 (-11%) | 5mo | $199,000 | $143 | 40 |
| 1338 Earl Ave | 0.72mi | 3/2.0 | 1,352 (-14%) | 6mo | $185,000 | $137 | 35 |
| 1330 Phyllis Ave | 0.65mi | 4/2.0 (+1) | 1,333 (-15%) | 7mo | $80,500 | $60 | 30 |
Match score weights: distance 35% · size 25% · config 20% · recency 20%. Top-matched comps best support the ARV.
Projected returns pro-forma
-3.0% appreciation · 6.06% rent growth · sell at horizon
- IRR
- 1.0%
- Equity multiple
- 1.04×
- Total profit
- $1,528
- Equity at exit
- $20,860
- IRR
- 13.5%
- Equity multiple
- 2.23×
- Total profit
- $48,104
- Equity at exit
- $12,096
Cash invested: $39,172 (down + closing). Projections, not guarantees.
Landlord ↔ Tenant lean methodology
- Overall (STATE)
- 83 Strongly Landlord-Friendly
- State Kentucky
- 83 Strongly Landlord-Friendly · R+16
- County
- — inherits STATE
- City
- — inherits STATE
ZIP-level market 40208
- Home prices YoY
- -23.3%
- Rents YoY
- 6.1%
- Active inventory
- 77
- Price-to-rent
- 7.3×
Monthly cashflow live
- Estimated rent
- $1,591 high interval (Pro) →
- Mortgage (P&I)
- −$734
- Tax from tax record
- −$109 /mo · $1,313/yr
- Insurance
- −$58
- Flood insurance flood zone
- −$56 /mo · $666/yr
- HOA
- −$0
- Vacancy / Maint / Mgmt
- −$334
- Net cashflow
- $300
Break-even live
Sensitivity live
| Price | -10% $380 | -5% $340 | +0% $300 | +5% $261 | +10% $221 |
|---|---|---|---|---|---|
| Rent | -10% $175 | -5% $237 | +0% $300 | +5% $363 | +10% $426 |
| Rate | -1.0pp $371 | -0.5pp $336 | base $300 | +0.5pp $264 | +1.0pp $227 |
UW: 25.0% down · 7.5% · 30yr · 1.5% tax · 5.0% vac · 8.0% maint · 8.0% mgmt
Financing live
Cash to close
- Down payment
- $34,975
- Closing costs
- $4,197
- Reserves months
- —
- Total cash needed
- —
Loan-product check · same deal, 3 products live
Conventional
25% down · 7.5% · 30yr
- Down + closing
- —
- Monthly P&I
- —
- Monthly cashflow
- —
- DSCR
- —
- Eligible?
- —
Personal DTI + credit; lowest rate.
DSCR
20% down · 8.5% · 30yr
- Down + closing
- —
- Monthly P&I
- —
- Monthly cashflow
- —
- DSCR
- —
- Eligible?
- —
No personal income docs; deal must DSCR.
Hard money
10% down · 12.0% · 12mo
- Down + closing
- —
- Monthly P&I
- —
- Monthly cashflow
- —
- DSCR
- —
- Eligible?
- —
Short-term bridge; refi at stabilization.
Rent comps 33 comps
| Address | Beds | Baths | Sqft | Rent | $/sqft | DOM | Units | Dist |
|---|---|---|---|---|---|---|---|---|
| 500 Montana Ave Louisville, KY | 2.0 | 1.0 | 1191 | $1,200 | $1.01 | 15d | 1 | 0.32mi |
| 315 M St Unit 101 Louisville, KY | 3.0 | 1.5 | 1200 | $1,800 | $1.50 | 12d | 1 | 0.38mi |
| 1147 Lincoln Ave Louisville, KY | 4.0 | 1.0 | 1323 | $1,295 | $0.98 | 3d | 1 | 0.40mi |
| 2718 S 3rd St Unit 2 Louisville, KY | 4.0 | 2.0 | 2000 | $2,800 | $1.40 | 12d | 1 | 0.41mi |
| 2718 S 3rd St Unit 1 Louisville, KY | 2.0 | 1.0 | 1200 | $1,400 | $1.17 | 12d | 1 | 0.41mi |
| 516 Colorado Ave Louisville, KY | 3.0 | 2.0 | 2000 | $1,800 | $0.90 | 17d | 1 | 0.44mi |
| 510 Colorado Ave Louisville, KY | 3.0 | 2.0 | 1500 | $1,750 | $1.17 | 24d | 1 | 0.45mi |
| 1161 Lincoln Ave Louisville, KY | 2.0 | 1.5 | 1358 | $1,150 | $0.85 | 17d | 1 | 0.45mi |
| 2711 S 3rd St Unit 1 Louisville, KY | 4.0 | 2.0 | 1800 | $2,400 | $1.33 | 12d | 1 | 0.45mi |
| 1305 Larchmont Ave Louisville, KY | 2.0 | 1.0 | 1113 | $1,350 | $1.21 | 17d | 1 | 0.48mi |
| 2501 S 4th St Louisville, KY | 1.0–3.0 | 1.0–3.0 | 897 | $6,345 | $7.07 | 4d | 1 | 0.51mi |
| 2501 S 3rd St Louisville, KY | 1.0–2.0 | 1.0–2.0 | 1011 | $1,550 | $1.53 | 4d | 2 | 0.52mi |
| 3102 Grant Ave Louisville, KY | 4.0 | 2.0 | 1603 | $1,595 | $1.00 | 24d | 1 | 0.64mi |
| 3860 Southern Pkwy Louisville, KY | 3.0 | 1.0 | 1064 | $1,250 | $1.17 | 24d | 1 | 0.76mi |
| 1244 Algonquin Pkwy Louisville, KY | 3.0 | 1.5 | 1136 | $1,400 | $1.23 | 24d | 1 | 0.79mi |
| 310 W Kenton St Louisville, KY | 3.0 | 2.0 | 1295 | $1,350 | $1.04 | 24d | 1 | 0.81mi |
| 925 W Evelyn Ave Louisville, KY | 3.0 | 1.5 | 1520 | $1,650 | $1.09 | 24d | 1 | 0.89mi |
| 551 Denmark St Louisville, KY | 3.0 | 1.5 | 1160 | $1,700 | $1.47 | 24d | 1 | 0.90mi |
| 4007 Southern Pkwy Unit 1 Louisville, KY | 4.0 | 1.0 | 1500 | $1,395 | $0.93 | 4d | 1 | 0.92mi |
| 2 Eutropia Ct Louisville, KY | 3.0 | 2.0 | 1367 | $1,950 | $1.43 | 18d | 1 | 1.03mi |
| 910 W Whitney Ave Louisville, KY | 3.0 | 1.0 | 1186 | $1,450 | $1.22 | 12d | 1 | 1.09mi |
| 910 W Whitney Ave Louisville, KY | 3.0 | 1.0 | 1186 | $1,450 | $1.22 | 2d | 1 | 1.09mi |
| 1501 Bellamy Pl Louisville, KY | 2.0–4.0 | 2.0–4.0 | 1074 | $2,217 | $2.06 | 4d | 1 | 1.09mi |
| 1522 Clara Ave Louisville, KY | 3.0 | 2.0 | 1150 | $1,150 | $1.00 | 24d | 1 | 1.11mi |
| 4133 S 5th St Louisville, KY | 4.0 | 1.0 | 1200 | $1,435 | $1.20 | 17d | 1 | 1.17mi |
| 2125 Crittenden Dr Louisville, KY | 3.0 | 2.0 | 1450 | $1,800 | $1.24 | 18d | 1 | 1.24mi |
| 414 W Hill St Louisville, KY | 3.0 | 1.5 | 1150 | $1,500 | $1.30 | 24d | 1 | 1.24mi |
| 114 E Florence Ave Unit 19 Louisville, KY | 2.0 | 2.0 | 1080 | $1,295 | $1.20 | 17d | 1 | 1.35mi |
| 4406 S Brook St Apt 27 Louisville, KY | 2.0 | 2.0 | 1080 | $1,295 | $1.20 | 12d | 1 | 1.37mi |
| 2207 James Pirtle Ct Louisville, KY | 1.0–3.0 | 1.0–2.0 | 883 | $1,458 | $1.65 | 4d | 17 | 1.43mi |
| 1461 S 1st St Unit 2 Louisville, KY | 2.0 | 1.0 | 1300 | $1,300 | $1.00 | 21d | 1 | 1.43mi |
| 1445 S 2nd St Unit 3 Louisville, KY | 3.0 | 1.0 | 1290 | $1,500 | $1.16 | 15d | 1 | 1.43mi |
| 4513 S 6th St Louisville, KY | 3.0 | 2.0 | 1581 | $2,650 | $1.68 | 24d | 1 | 1.47mi |
Listing history 22 events
-
2026-06-10status $139,900 Pending 119 DOM
-
2026-06-09days on market $139,900 Active Under Contract 119 DOM
-
2026-06-08days on market $139,900 Active Under Contract 118 DOM
-
2026-06-07days on market $139,900 Active Under Contract 117 DOM
-
2026-06-03days on market $139,900 Active Under Contract 113 DOM
-
2026-06-02days on market $139,900 Active Under Contract 112 DOM
-
2026-06-01days on market $139,900 Active Under Contract 111 DOM
-
2026-05-31days on market $139,900 Active Under Contract 110 DOM
-
2026-05-20historical Active Under Contract
-
2026-04-21price $139,900
-
2026-03-14price $149,900
-
2026-02-10$159,900 Active
-
2022-02-03price $1,200
-
2019-02-27soldstatus $62,500
-
2019-02-20soldstatus $62,500 Closed 260-char remark
Show marketing remark (260 chars)
Great Location! Close to U of L Campus, Baseball Stadium, Football Stadium, and Churchill Downs. This home has 3 year old roof, new HVAC system! New carpet and fresh paint make this one move in ready. Won't Last long at this price, schedule a showing today!
-
2019-02-09status Pending 260-char remark
Show marketing remark (260 chars)
Great Location! Close to U of L Campus, Baseball Stadium, Football Stadium, and Churchill Downs. This home has 3 year old roof, new HVAC system! New carpet and fresh paint make this one move in ready. Won't Last long at this price, schedule a showing today!
-
2019-01-13price $79,000 260-char remark
Show marketing remark (260 chars)
Great Location! Close to U of L Campus, Baseball Stadium, Football Stadium, and Churchill Downs. This home has 3 year old roof, new HVAC system! New carpet and fresh paint make this one move in ready. Won't Last long at this price, schedule a showing today!
-
2019-01-13price $84,000 260-char remark
Show marketing remark (260 chars)
Great Location! Close to U of L Campus, Baseball Stadium, Football Stadium, and Churchill Downs. This home has 3 year old roof, new HVAC system! New carpet and fresh paint make this one move in ready. Won't Last long at this price, schedule a showing today!
-
2019-01-13$85,000 Active 260-char remark
Show marketing remark (260 chars)
Great Location! Close to U of L Campus, Baseball Stadium, Football Stadium, and Churchill Downs. This home has 3 year old roof, new HVAC system! New carpet and fresh paint make this one move in ready. Won't Last long at this price, schedule a showing today!
-
2010-04-29soldstatus $54,200
-
2010-04-21soldstatus $54,200 401-char remark
Show marketing remark (401 chars)
Completely renovated 3 bedroom, 1 bath Bungalow. Updates include: New furnace / central air (TRANE); water heater; replacement windows; paint; and much more. Kitchen has all new cabinets, countertop, and flooring. New stove to remain. Bathroom has been refinished with new flooring and vanity. Covered front porch. Seller to provide one year ASW Home Warranty. IMMEDIATE POSSESSION and PRICED TO SELL!
-
2009-10-05$55,000 401-char remark
Show marketing remark (401 chars)
Completely renovated 3 bedroom, 1 bath Bungalow. Updates include: New furnace / central air (TRANE); water heater; replacement windows; paint; and much more. Kitchen has all new cabinets, countertop, and flooring. New stove to remain. Bathroom has been refinished with new flooring and vanity. Covered front porch. Seller to provide one year ASW Home Warranty. IMMEDIATE POSSESSION and PRICED TO SELL!
ⓘ Source: listings_history table (triggers on properties + properties_extension) + one-shot
backfill from property_details.listing_events for pre-trigger history.
Tax reassessment forecast KY · Resets to sale price
- Current annual tax
- $1,313 · $109/mo
- Projected year-2 tax
- $1,313 · $109/mo
- Expected delta
- $0/yr ($0/mo · 0.0%)
ⓘ Screening estimate from a state-policy table — verify with the county assessor before closing.
Climate risk First Street
- Flood 7/10 Severe FEMA zone X (unshaded) · 99% chance over 30 yrs
- Wildfire 1/10 Low
- Heat 5/10 Major 7 d/yr ≥104°F today · 20 d/yr by 30 yrs out
- Wind 2/10 Low 100% chance of damaging wind over 30 yrs
- Air quality 2/10 Low 1 unhealthy d/yr today · 3 by 30 yrs out
Nearby sold comps map
Loading sold comps map…
Walkable amenities ~0.75 mi
Loading nearby amenities…
Taxation est. · year 1
- Rental income
- $19,097
- − Mortgage interest
- −$7,837
- − Property taxes
- −$1,313
- − Insurance
- −$1,366
- − Repairs & maintenance
- −$1,528
- − Management
- −$1,528
- − Depreciation
- −$4,070
- Taxable income
- $1,457
- Est. tax owed @ 24.0%
- −$350
- After-tax cash flow
- $3,255/yr
For passive investors: Depreciation is non-cash, so a rental often shows a tax loss while cash-flowing — sheltering income. Rental losses are passive: they offset passive income freely, and up to $25,000/yr can offset ordinary (W-2) income if you actively participate and your MAGI is under $100k (phasing out to $0 by $150k); unused losses carry forward. On sale, claimed depreciation is recaptured at up to 25%, and gains may owe capital-gains tax (a 1031 exchange can defer both). Figures are a year-1 estimate at your 24.0% rate — not tax advice; consult a CPA.
Schools (NCES district)
- District
- Jefferson County
- NCES district ID
- 2102990
- Math proficiency
- 19% ▼ -17.00%
- Reading proficiency
- 35% ▼ -11.00%
- Median HH income
- $47,885
- Composite
- 23.45/100
- National rank
- #7884
- State rank
- #121 of 165 in KY
Livability — Louisville
- Score
- 63/100
- State rank
- #333
- US rank
- #15887
Category grades
Schools grade is shown separately in the Schools card above.
Census & demographics
- Census place
- Louisville, KY
- County
- Jefferson County · 790,184 people
- City population
- 769,292
- Metro
- Louisville/Jefferson County, KY-IN
- Population (ZIP)
- 15,605
- Household income
- $39,560
- Rent vs Own
- Severe rent burden
- 1136.0
Population outlook (Jefferson County) Hauer SSP2
- Today (2025)
- 823,112 people
- By 2030
- 849,343 · +3.2%
- By 2040
- 895,696 · +8.8%
- By 2050
- 933,630 · +13.4%
- By 2075
- 1,028,262 · +24.9%
- By 2100
- 1,072,675 · +30.3%
Race, ethnicity, and origin ACS 2023
- Neighborhood character
- Diverse neighborhood (Simpson 0.56)
- Race & ethnicity
- White 62% Black 22% Two or more races 9% Hispanic / Latino 6% Asian 1%
- Hispanic origin (detail)
- Mexican 4%
- Common ancestry
- Italian 3% Lithuanian 2% Slovak 2%
- Foreign-born
- 5% · Canada, China, South Korea
- Languages at home
- 90% English-only · Spanish 3% French/Haitian/Cajun 1%
Political lean MEDSL · Jefferson
- 2024 margin
- D (+16.6) · D 57.4% · R 40.9% · Other 1.7%
- 2008→2024 swing
- +4.5pp toward D · 2008: 12.0pp · 2024: 16.6pp
- All cycles
- 2024: D+16.6 2020: D+20.1 2016: D+13.3 2012: D+11.1 2008: D+12.0
Not yet ingested
- Civics
- —
Market trends
- HPI YoY
- ▼ -72.97%
- Current HPI
- 240.6261
- Rent YoY
- ▲ 6.06%
- Metro
- Louisville/Jefferson County, KY-IN
- State GDP YoY
- ▲ 1.81%
- F500 in state
- 4
Industry mix (Fortune 500 HQ in KY)
| Industry | F500 HQs | Revenue |
|---|---|---|
| Healthcare | 1 | $118B |
|
||
| Food / Beverage | 1 | $7B |
|
||
Price history
+154.4% since first listed14 events — show timeline
- 2026-05-20 Contingent — Metro Search MLS
- 2026-04-21 Price Changed $139,900 Metro Search MLS
- 2026-03-14 Price Changed $149,900 Metro Search MLS
- 2026-02-10 Listed $159,900 Metro Search MLS
- 2022-02-03 Price Changed $1,200 RENT.
- 2019-02-27 Sold (Public Records) $62,500 Public Records
- 2019-02-20 Sold (MLS) $62,500 Metro Search MLS
- 2019-02-09 Pending — Metro Search MLS
- 2019-01-13 Listed $85,000 Metro Search MLS
- 2019-01-13 Price Changed $84,000 Metro Search MLS
- 2019-01-13 Price Changed $79,000 Metro Search MLS
- 2010-04-29 Sold (Public Records) $54,200 Public Records
- 2010-04-21 Sold (MLS) $54,200 Metro Search MLS
- 2009-10-05 Listed $55,000 Metro Search MLS
Property tax history
+5.2%/yrLatest (2025): $1,313 · -1.9% YoY. Source: county tax records.
Cash-flow waterfall
monthlySold comps — $/sqft
last 12 mo · ≤1 miLoading sold comps…