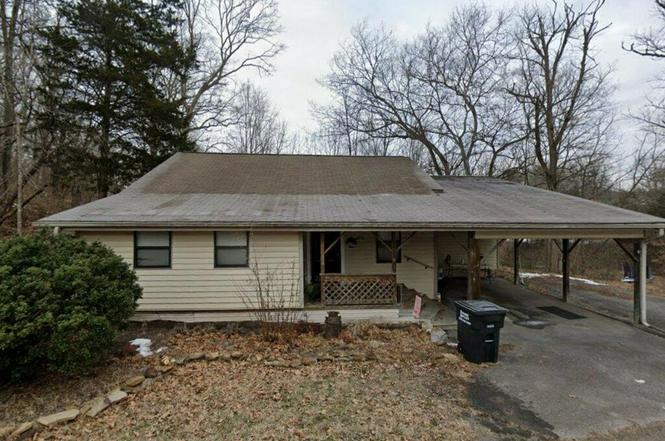
616 Thorn Grove Pike · Sevierville, TN
Flood risk 1/10 · Minimal
- FEMA flood zone
- X (unshaded)
- Chance of flooding over 30 yrs
- 0.0%
- Est. flood insurance / yr
- $507 – $1,088
Fire risk 4/10 · Minor
- Est. fire insurance / yr
- $949 – $1,763
Heat risk 5/10 · Moderate
- Hot days now (above 103°F)
- 7 days/yr
- Hot days in 30 yrs
- 20 days/yr
Wind risk 2/10 · Minimal
- Chance of severe wind over 30 yrs
- —
Air-quality risk 3/10 · Minor
- Unhealthy air days now
- 2 days/yr
- Unhealthy air days in 30 yrs
- 3 days/yr
Risk factors via First Street. Map © Google.
Why this score? — see what drove the B- grade
The composite is a weighted blend of 9 inputs, each scored 0–100. Each bar is that input's sub-score; the figure is the points it added to the 100-point composite (weight × sub-score).
- Cash flow +30.0/30.0
- DSCR +10.0/10.0
- 1% rule +8.9/10.0
- ARV discount +7.5/15.0
- Livability +2.9/5.0
- Rent growth +2.5/5.0
- Schools +2.5/10.0
- Condition / age +2.5/5.0
- Appreciation +0.0/10.0
$149,000
🖨 Deal sheet (PDF) 📄 Offer letter ✓ Due diligence
Listing remarks
Great investment opportunity with 1.3 acres. Minutes from Sevierville and Pigeon Forge, Gatlinburg Tennessee. Selling as is.
Key facts
- Pigeon forge
- 1.3 acres
- Gatlinburg tennessee
Tags
Property features AI
Exterior
- Home design: House
- Exterior features: Property sits on a 1.32-acre lot
Neighborhood map
What this means for you Summary
Snapshot
- This is a 2-bed/1.0-bath single-family listed at $149k.
Deal economics
- At list price, monthly cash flow is $768 ($9k/yr) — positive.
- The deal already cash-flows at list — no discount required.
- Meets the 1% rule at list price ($2k rent vs $149k).
- Recommended offer: $147k (1.5% below list) — sets the bar for market timing.
- Cap rate 12.5% vs local median 1.6% in Sevierville — top-decile yield for the area; either an underpriced asset or a hidden risk that comps aren't pricing in. Stress-test before assuming the spread holds.
Location & tenants
- Location reads 57/100 on livability (#323 in TN) — a working-class tenant base; expect higher turnover. Strengths: cost of living A+, housing A-; Watch: employment C-, crime F, amenities F.
- Sevier County (rural): math 31% / reading 28% proficiency, ranked #62 of 139 in TN (top 45%) — low school quality limits family demand, transient renter base, plan for 1-2y turnover.
- Zoned schools: New Center Elementary (math 32% / reading 28%, grade F, #415 of 952 statewide, top 44%, 855 students, 0% FRL); Seymour Junior High (math 40% / reading 30%, grade F, #65 of 333 statewide, top 20%, 766 students, 0% FRL); Sevier County High School (math 20% / reading 38%, grade F, #92 of 332 statewide, top 28%, 1,248 students, 0% FRL) — zoned schools average 0% FRL vs 52% district-wide (52 pts lower); this property's tenant base skews higher-income than the district average.
- Market conditions: 21 active listings in the ZIP; 1 comparable units currently listed for rent nearby; 1,594 units permitted in Sevier County in 2024 (456 in 5+ unit buildings).
Forward outlook
- Local home prices are declining (-3.0%/yr); year-one equity from $1k of loan paydown is wiped out by about $4k of value loss. Plan a longer hold.
- Sevier County population projected at +22% by 2050 — long-run rental-demand tailwind backs the buy-and-hold thesis.
- At projected returns (-3.0% appreciation + 3.0% rent growth), your $42k cash investment doubles in ~6 years — after that, you're playing with house money.
Negotiation context
- It's been on market 18 days — a 2% lower offer ($147k) is reasonable based on typical stale-listing flexibility.
- 2 sale attempts since 14y ago with the ask held roughly flat each time — persistent listings suggest the price (not the market) is what's stuck; bring a comps-based counter.
Risks & watch-outs
- Watch-outs: built in 1900 — expect roof / HVAC / electrical / plumbing capex.
- Climate carrying-cost: extreme-heat days projected 7→20/yr by 2055 (HVAC capex compounding) — expect insurance premiums to compound above CPI over the hold.
Questions for the listing agent
- Built in 1900 — when were the roof, HVAC, electrical panel, plumbing, and water heater last replaced?
- Is there a deadline driving the sale (1031 exchange, divorce, estate, relocation)? That informs how much negotiation room exists.
- Schools are F-rated, which usually means shorter tenancies and higher turnover. Who's the typical renter profile here, and what's been the actual vacancy rate?
- Crime grade is F in this area — have there been break-ins, vandalism, or insurance claims at this property in the last 3 years? What carrier currently insures it and at what premium?
- What's the average days-on-market for RENTAL listings here right now (not sales)? A rising rental-DOM trend means longer vacancies and softer asking-rent achievability than the comps imply.
- What's the recent tenant-quality profile in this submarket — average credit score on applications, eviction rate, late-payment / NSF rate, and stable-employment percentage? A property-management company in the area should have these aggregated.
- How much new for-sale + rental construction is in the pipeline within 1–3 miles? Heavy new supply typically softens prices + rents 12–24 months out; constrained supply supports both.
Investment metrics
- 1% rule
- 1.39% ✓
- Cap rate
- 12.48%
- Cash-on-cash
- 22.09%
- DSCR
- 1.98
- GRM
- 6.0
CMA / ARV
- ARV (on-the-fly)
- $339,000
- Comps found
- 6
Show comp detail 6 sales within ~0.75 mi
| Address | Dist | Beds/Ba | Sqft | Sold | Price | $/sf | Match |
|---|---|---|---|---|---|---|---|
| 617 Hollow Dr | 0.05mi | 2/2.0 | 1,288 (-14%) | 5mo | $263,000 | $204 | 66 |
| 4507 Douglas Dam Rd | 0.06mi | 3/2.0 (+1) | 1,638 (+9%) | 20mo | $370,000 | $226 | 56 |
| 805 Farnsworth Ct | 0.67mi | 2/2.0 | 1,300 (-13%) | 4mo | $325,000 | $250 | 39 |
| 4543 Winslow Dr | 0.63mi | 3/2.0 (+1) | 1,288 (-14%) | 6mo | $275,000 | $214 | 33 |
| 4543 Winslow Dr | 0.63mi | 3/2.0 (+1) | 1,288 (-14%) | 6mo | $275,000 | $214 | 33 |
| 620 Asheville Hwy | 0.75mi | 2/2.0 | 1,334 (-11%) | 22mo | $386,500 | $290 | 25 |
Match score weights: distance 35% · size 25% · config 20% · recency 20%. Top-matched comps best support the ARV.
Projected returns pro-forma
-3.0% appreciation · 3.0% rent growth · sell at horizon
- IRR
- 14.8%
- Equity multiple
- 1.59×
- Total profit
- $24,701
- Equity at exit
- $22,216
- IRR
- 23.5%
- Equity multiple
- 3.02×
- Total profit
- $84,223
- Equity at exit
- $12,883
Cash invested: $41,720 (down + closing). Projections, not guarantees.
Landlord ↔ Tenant lean methodology
- Overall (STATE)
- 87 Strongly Landlord-Friendly
- State Tennessee
- 87 Strongly Landlord-Friendly · R+13
- County
- — inherits STATE
- City
- — inherits STATE
ZIP-level market 37871
- Home prices YoY
- -9.1%
- Active inventory
- 21
- Price-to-rent
- 6.0×
Monthly cashflow live
- Estimated rent
- $2,075 medium interval (Pro) →
- Mortgage (P&I)
- −$781
- Tax from tax record
- −$28 /mo · $334/yr
- Insurance
- −$62
- HOA
- −$0
- Vacancy / Maint / Mgmt
- −$436
- Net cashflow
- $768
Break-even live
Sensitivity live
| Price | -10% $852 | -5% $810 | +0% $768 | +5% $726 | +10% $684 |
|---|---|---|---|---|---|
| Rent | -10% $604 | -5% $686 | +0% $768 | +5% $850 | +10% $932 |
| Rate | -1.0pp $843 | -0.5pp $806 | base $768 | +0.5pp $729 | +1.0pp $690 |
UW: 25.0% down · 7.5% · 30yr · 1.5% tax · 5.0% vac · 8.0% maint · 8.0% mgmt
Financing live
Cash to close
- Down payment
- $37,250
- Closing costs
- $4,470
- Reserves months
- —
- Total cash needed
- —
Loan-product check · same deal, 3 products live
Conventional
25% down · 7.5% · 30yr
- Down + closing
- —
- Monthly P&I
- —
- Monthly cashflow
- —
- DSCR
- —
- Eligible?
- —
Personal DTI + credit; lowest rate.
DSCR
20% down · 8.5% · 30yr
- Down + closing
- —
- Monthly P&I
- —
- Monthly cashflow
- —
- DSCR
- —
- Eligible?
- —
No personal income docs; deal must DSCR.
Hard money
10% down · 12.0% · 12mo
- Down + closing
- —
- Monthly P&I
- —
- Monthly cashflow
- —
- DSCR
- —
- Eligible?
- —
Short-term bridge; refi at stabilization.
Rent comps 1 comps
| Address | Beds | Baths | Sqft | Rent | $/sqft | DOM | Units | Dist |
|---|---|---|---|---|---|---|---|---|
| 4116 Briggs Loop Kodak, TN | 3.0 | 2.0 | 1314 | $2,075 | $1.58 | 45d | 1 | 0.92mi |
Listing history 3 events
-
2025-11-04historical Under Contract
-
2025-10-17$149,000 Active
-
2012-09-10$29,500
ⓘ Source: listings_history table (triggers on properties + properties_extension) + one-shot
backfill from property_details.listing_events for pre-trigger history.
Tax reassessment forecast TN · Resets to sale price
- Current annual tax
- $334 · $28/mo
- Projected year-2 tax
- $1,058 · $88/mo
- Expected delta
- +$724/yr (+$60/mo · 216.7%)
ⓘ Screening estimate from a state-policy table — verify with the county assessor before closing.
Climate risk First Street
- Flood 1/10 Low FEMA zone X (unshaded) · 0% chance over 30 yrs
- Wildfire 4/10 Moderate
- Heat 5/10 Major 7 d/yr ≥103°F today · 20 d/yr by 30 yrs out
- Wind 2/10 Low
- Air quality 3/10 Moderate 2 unhealthy d/yr today · 3 by 30 yrs out
Nearby sold comps map
Loading sold comps map…
Walkable amenities ~0.75 mi
Loading nearby amenities…
Taxation est. · year 1
- Rental income
- $24,900
- − Mortgage interest
- −$8,346
- − Property taxes
- −$334
- − Insurance
- −$745
- − Repairs & maintenance
- −$1,992
- − Management
- −$1,992
- − Depreciation
- −$4,335
- Taxable income
- $7,156
- Est. tax owed @ 24.0%
- −$1,717
- After-tax cash flow
- $7,498/yr
For passive investors: Depreciation is non-cash, so a rental often shows a tax loss while cash-flowing — sheltering income. Rental losses are passive: they offset passive income freely, and up to $25,000/yr can offset ordinary (W-2) income if you actively participate and your MAGI is under $100k (phasing out to $0 by $150k); unused losses carry forward. On sale, claimed depreciation is recaptured at up to 25%, and gains may owe capital-gains tax (a 1031 exchange can defer both). Figures are a year-1 estimate at your 24.0% rate — not tax advice; consult a CPA.
Schools (NCES district)
- District
- Sevier County
- NCES district ID
- 4703780
- Math proficiency
- 31% ▼ -6.00%
- Reading proficiency
- 28% ▼ -4.00%
- Median HH income
- $42,730
- Composite
- 25.12/100
- National rank
- #7527
- State rank
- #62 of 139 in TN
Livability — Sevierville
- Score
- 57/100
- State rank
- #323
- US rank
- #21663
Category grades
Schools grade is shown separately in the Schools card above.
Census & demographics
- Population (ZIP)
- 8,548
Population outlook (Sevier County) Hauer SSP2
- Today (2025)
- 107,903 people
- By 2030
- 113,633 · +5.3%
- By 2040
- 123,969 · +14.9%
- By 2050
- 132,123 · +22.4%
- By 2075
- 148,524 · +37.6%
- By 2100
- 153,436 · +42.2%
Race, ethnicity, and origin ACS 2023
- Neighborhood character
- Predominantly White (94%)
- Race & ethnicity
- White 94% Two or more races 5% Hispanic / Latino 3%
- Common ancestry
- Slovak 5% Lithuanian 3% Serbian 2%
- Foreign-born
- 0%
Political lean MEDSL · Sevier
- 2024 margin
- Solid R (+61.1) · D 18.9% · R 80.1% · Other 1.0%
- 2008→2024 swing
- -13.1pp toward R · 2008: -48.1pp · 2024: -61.1pp
- All cycles
- 2024: R+61.1 2020: R+57.6 2016: R+61.7 2012: R+54.8 2008: R+48.1
Not yet ingested
- Civics
- —
Market trends
- HPI YoY
- ▼ -36.24%
- Current HPI
- 362.5754
- Rent YoY
- —
- Metro
- —
- State GDP YoY
- ▲ 2.78%
- F500 in state
- 22
Industry mix (Fortune 500 HQ in TN)
| Industry | F500 HQs | Revenue |
|---|---|---|
| Healthcare | 3 | $91B |
|
||
| Retail | 3 | $72B |
|
||
| Transportation / Logistics | 1 | $88B |
|
||
| Paper / Packaging | 1 | $19B |
|
||
| Insurance | 1 | $13B |
|
||
| Energy | 1 | $12B |
|
||
Price history
+405.1% since first listed3 events — show timeline
- 2025-11-04 Contingent — ForSaleByOwner.com
- 2025-10-17 Listed $149,000 ForSaleByOwner.com
- 2012-09-10 Listed $29,500 Knoxville MLS
Property tax history
+0.7%/yrLatest (2025): $334 · +0.0% YoY. Source: county tax records.
Cash-flow waterfall
monthlySold comps — $/sqft
last 12 mo · ≤1 miLoading sold comps…