2700 Lawrence Crossley Rd #96 · Palm Springs, CA
Flood risk 1/10 · Minimal
- FEMA flood zone
- X
- Chance of flooding over 30 yrs
- 0.0%
- Est. flood insurance / yr
- $507 – $1,088
Fire risk 4/10 · Minor
- Est. fire insurance / yr
- $659 – $1,223
Heat risk 9/10 · Severe
- Hot days now (above 112°F)
- 7 days/yr
- Hot days in 30 yrs
- 21 days/yr
Wind risk 1/10 · Minimal
- Chance of severe wind over 30 yrs
- —
Air-quality risk 5/10 · Moderate
- Unhealthy air days now
- 6 days/yr
- Unhealthy air days in 30 yrs
- 8 days/yr
Risk factors via First Street. Map © Google.
Why this score? — see what drove the D grade
The composite is a weighted blend of 9 inputs, each scored 0–100. Each bar is that input's sub-score; the figure is the points it added to the 100-point composite (weight × sub-score).
- Cash flow +13.8/30.0
- ARV discount +7.5/15.0
- 1% rule +5.8/10.0
- DSCR +4.2/10.0
- Livability +3.3/5.0
- Schools +2.7/10.0
- Condition / age +2.5/5.0
- Rent growth +2.4/5.0
- Appreciation +0.0/10.0
$199,900
🖨 Deal sheet (PDF) 📄 Offer letter ✓ Due diligence
Listing remarks
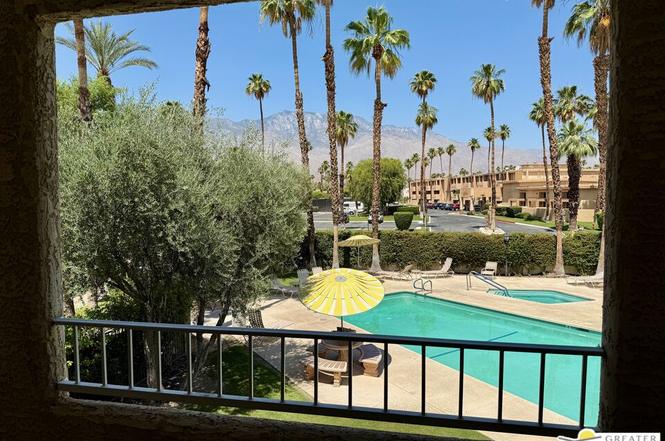
RESORT LIVING WITH BREATHTAKING MOUNTAIN VIEWS IN BEAUTIFUL SOUTH PALM SPRINGS. Discover an exceptional real estate opportunity in South Palm Springs. This bright and airy corner unit on the second floor offers unobstructed views of the stunning San Jacinto Mountains from every living space -- bringing the natural beauty of the desert into your everyday life. Whether you're relaxing in the spacious great room or enjoying the oversized balcony, the scenery is simply unforgettable. AN IDEAL CANVAS PRICED TO PERSONALIZE. Ready to be reimagined, this two-bedroom, two-bath condo features a highly desirable dual-primary layout, perfect for full-time living, vacationing, or rental income potential
Key facts
- Oversized balcony
- Ensuite bath
- Original cabinetry
Tags
Property features AI
Finance
- Other: Complex has about 120 units; Management companies: Desert Resort Management and CAFS
- HOA & community: Monthly HOA fee of $395; HOA covers water, trash, building & grounds, and insurance; Association amenities include pool, spa, pickleball, gated community, tennis, and guest parking; Association allows pets
Exterior
- Parking: Detached carport; 1 covered parking space; 1 additional open parking space; Guest parking available in community
- Security: Gated community; Card/code access; Exterior security lights; Fire sprinklers; Smoke detectors; Carbon monoxide detectors
- Utilities: Public water; Sewer in street; Cable TV available
- Home design: Residential condominium, attached; Two total floors in building; this unit is on the second floor; Faces west; Entry floor number: 2
- Construction: Stucco exterior; Part of planned urban development (Esprit tract)
- Exterior features: Covered balcony/patio off living room; Two balconies; End unit; Community pool and spa (association); Community pickleball and tennis courts; Gated community with automatic gate and exterior security lights; Community mailbox; Has mountain and pool views
Interior
- Kitchen: Electric cooktop; Free-standing electric range/oven; Built-in microwave; Hood fan; Garbage disposal; Tile countertops
- Bedrooms: Walk-in closet
- Flooring: Carpeted floors
- Bathrooms: 2 full bathrooms; Shower and tub; Double vanity sinks
- Heating & cooling: Central air conditioning; Central electric heat; Gas water heater
- Interior features: Cathedral/vaulted ceilings; High ceilings (9+ feet); Open floor plan; Living room balcony; Common walls (attached unit); Double-pane windows with screens; Sliding glass doors; Laundry located in closet (stacked hookup); Ceiling fan
- Laundry & utility: Stacked laundry in closet (electric dryer hookup, 220V in laundry); Dryer included
Neighborhood map
What this means for you Summary
Snapshot
- This is a 2-bed/2.0-bath condo listed at $200k.
Deal economics
- At list price, monthly cash flow is $18 ($222/yr) — positive.
- The deal already cash-flows at list — no discount required.
- Meets the 1% rule at list price ($2k rent vs $200k).
- Recommended offer: $176k (12.0% below list) — sets the bar for market timing.
- Cap rate 6.4% vs local median 2.7% in Palm Springs — top-decile yield for the area; either an underpriced asset or a hidden risk that comps aren't pricing in. Stress-test before assuming the spread holds.
Location & tenants
- Location reads 66/100 on livability (#348 in CA) — a middle-class / working-renter tenant base. Strengths: amenities A+, commute A+; Watch: crime F, cost of living F, health & safety F.
- Palm Springs Unified (suburban): math 21% / reading 42% proficiency, ranked #328 of 517 in CA (top 63%) — families likely to look elsewhere, expect single-tenant / working-renter base with shorter leases; 73% free/reduced lunch — lower-income household profile, screen leases tightly.
- Zoned schools: Cathedral City Elementary (math 12% / reading 24%, grade F, #1,322 of 1,571 statewide, top 85%, 653 students, 98% FRL); Nellie N. Coffman Middle (953 students, 98% FRL); Cathedral City High (math 25% / reading 61%, grade F, #460 of 1,170 statewide, top 40%, 1,395 students, 98% FRL) — zoned schools average 98% FRL vs 73% district-wide (25 pts higher); higher-poverty schools than district average — tighter screening recommended.
- Market conditions: Rents soft (-0.4%/yr); 498 active listings in the ZIP; 36 comparable units currently listed for rent nearby; rentals at typical pace (median 24d on market — plan ~3-4 weeks tenant-placement turnaround); solid renter incomes; 9,195 units permitted in Riverside County in 2024 (1,512 in 5+ unit buildings).
- This rent runs 33% of the median local income ($78k/yr) — at the standard rent-burdened threshold; future hikes will face affordability resistance.
Forward outlook
- Local home prices are declining (-3.0%/yr); year-one equity from $1k of loan paydown is wiped out by about $6k of value loss. Plan a longer hold.
- Riverside County population projected at +22% by 2050 — long-run rental-demand tailwind backs the buy-and-hold thesis.
Negotiation context
- It's been on market 355 days — a 12% lower offer ($176k) is reasonable based on typical stale-listing flexibility.
Risks & watch-outs
- Climate carrying-cost: extreme-heat days projected 7→21/yr by 2055 (HVAC capex compounding) — expect insurance premiums to compound above CPI over the hold.
Questions for the listing agent
- It's been on market 355 days. Have you received any prior offers? Is the seller open to a 12% concession, seller financing, or rate buy-down credit?
- What does the HOA fee cover, when was the last increase, and are there any pending special assessments or reserve-fund shortfalls?
- Any open or pending special assessments — roof, HVAC, plumbing, elevator, façade? What's the per-unit balance and payoff schedule, and is the seller paying it off at close or rolling it to the buyer?
- Why hasn't it sold? Are there any deal-killer items the seller is aware of (foundation, flood, title, zoning, code violations)?
- Is there a deadline driving the sale (1031 exchange, divorce, estate, relocation)? That informs how much negotiation room exists.
- Crime grade is F in this area — have there been break-ins, vandalism, or insurance claims at this property in the last 3 years? What carrier currently insures it and at what premium?
- The area grade is low — what's the realistic commute time and amenity access for the typical tenant pool here? Any planned neighborhood developments (good or bad) we should know about?
- What's the average days-on-market for RENTAL listings here right now (not sales)? A rising rental-DOM trend means longer vacancies and softer asking-rent achievability than the comps imply.
- What's the recent tenant-quality profile in this submarket — average credit score on applications, eviction rate, late-payment / NSF rate, and stable-employment percentage? A property-management company in the area should have these aggregated.
- How much new apartment / multifamily construction is in the pipeline within 1–3 miles? Heavy new supply (>2% of stock underway) typically softens rents 12–24 months out; light construction supports rent growth.
Investment metrics
- 1% rule
- 1.08% ✓
- Cap rate
- 6.40%
- Cash-on-cash
- 0.40%
- DSCR
- 1.02
- GRM
- 7.7
CMA / ARV
No comps found within radius.
Projected returns pro-forma
-3.0% appreciation · 0.0% rent growth · sell at horizon
- IRR
- -19.7%
- Equity multiple
- 0.33×
- Total profit
- $-37,298
- Equity at exit
- $29,806
- IRR
- -23.2%
- Equity multiple
- 0.03×
- Total profit
- $-54,431
- Equity at exit
- $17,284
Cash invested: $55,972 (down + closing). Projections, not guarantees.
Landlord ↔ Tenant lean methodology
- Overall (STATE)
- 18 Strongly Tenant-Friendly
- State California
- 18 Strongly Tenant-Friendly · D+13
- County
- — inherits STATE
- City
- — inherits STATE
ZIP-level market 92264
- Rents YoY
- -0.4%
- Active inventory
- 498
- Price-to-rent
- 7.7×
Monthly cashflow live
- Estimated rent
- $2,150 high interval (Pro) →
- Mortgage (P&I)
- −$1,048
- Tax from tax record
- −$153 /mo · $1,837/yr
- Insurance
- −$83
- HOA
- −$395
- Vacancy / Maint / Mgmt
- −$451
- Net cashflow
- $18
Break-even live
Sensitivity live
| Price | -10% $132 | -5% $75 | +0% $18 | +5% $-38 | +10% $-95 |
|---|---|---|---|---|---|
| Rent | -10% $-151 | -5% $-66 | +0% $18 | +5% $103 | +10% $188 |
| Rate | -1.0pp $119 | -0.5pp $69 | base $18 | +0.5pp $-33 | +1.0pp $-86 |
UW: 25.0% down · 7.5% · 30yr · 1.5% tax · 5.0% vac · 8.0% maint · 8.0% mgmt
Financing live
Cash to close
- Down payment
- $49,975
- Closing costs
- $5,997
- Reserves months
- —
- Total cash needed
- —
Loan-product check · same deal, 3 products live
Conventional
25% down · 7.5% · 30yr
- Down + closing
- —
- Monthly P&I
- —
- Monthly cashflow
- —
- DSCR
- —
- Eligible?
- —
Personal DTI + credit; lowest rate.
DSCR
20% down · 8.5% · 30yr
- Down + closing
- —
- Monthly P&I
- —
- Monthly cashflow
- —
- DSCR
- —
- Eligible?
- —
No personal income docs; deal must DSCR.
Hard money
10% down · 12.0% · 12mo
- Down + closing
- —
- Monthly P&I
- —
- Monthly cashflow
- —
- DSCR
- —
- Eligible?
- —
Short-term bridge; refi at stabilization.
Rent comps 36 comps
| Address | Beds | Baths | Sqft | Rent | $/sqft | DOM | Units | Dist |
|---|---|---|---|---|---|---|---|---|
| 2700 Lawrence Crossley Rd Unit B15 Palm Springs, CA | 2.0 | 2.0 | 885 | $1,950 | $2.20 | 45d | 1 | 0.02mi |
| 2700 Lawrence Crossley Rd #18 Palm Springs, CA | 2.0 | 2.0 | 885 | $2,050 | $2.32 | 20d | 1 | 0.02mi |
| 2800 Lawrence Crossley Rd Palm Springs, CA | 2.0 | 2.0 | 905 | $2,022 | $2.23 | 45d | 1 | 0.06mi |
| 5301 E Waverly Dr Palm Springs, CA | 1.0–2.0 | 2.0 | 933 | $2,300 | $2.47 | 20d | 2 | 0.11mi |
| 5301 E Waverly Dr Palm Springs, CA | 1.0–2.0 | 2.0 | 933 | $2,300 | $2.47 | 16d | 2 | 0.11mi |
| 5300 E Waverly Dr Palm Springs, CA | 1.0–2.0 | 1.5–2.0 | 768 | $1,900 | $2.47 | 26d | 2 | 0.17mi |
| 5301 E Waverly Dr #192 Palm Springs, CA | 2.0 | 2.0 | 979 | $2,300 | $2.35 | 26d | 1 | 0.18mi |
| 5301 E Waverly Dr #120 Palm Springs, CA | 1.0 | 2.0 | 887 | $2,800 | $3.16 | 45d | 1 | 0.18mi |
| 5300 E Waverly Dr Unit C4 Palm Springs, CA | 2.0 | 1.5 | 768 | $1,900 | $2.47 | 4d | 1 | 0.26mi |
| 5225 E Waverly Dr #66 Palm Springs, CA | 1.0 | 2.0 | 887 | $3,600 | $4.06 | 45d | 1 | 0.31mi |
| 2010 Lawrence Crossley Rd Unit 8 Palm Springs, CA | 2.0 | 1.5 | 993 | $1,895 | $1.91 | 15d | 1 | 0.52mi |
| Lawrence Crossley Rd Unit 62 Palm Springs, CA | 2.0 | 2.0 | 885 | $2,100 | $2.37 | 45d | 1 | 1.14mi |
| 36953 Bankside Dr Unit 10 Cathedral City, CA | 1.0 | 1.0 | 700 | $1,495 | $2.14 | 23d | 1 | 1.15mi |
| 36953 Bankside Dr Unit 5 Cathedral City, CA | 1.0 | 1.0 | 700 | $1,595 | $2.28 | 3d | 1 | 1.15mi |
| 36953 Bankside Dr Unit A Cathedral City, CA | 1.0 | 1.0 | 700 | $1,495 | $2.14 | 26d | 1 | 1.15mi |
| 36957 Melrose Dr Unit 7 Cathedral City, CA | 1.0 | 1.0 | 700 | $1,495 | $2.14 | 23d | 1 | 1.19mi |
| 36957 Melrose Dr Unit C Cathedral City, CA | 1.0 | 1.0 | 700 | $1,495 | $2.14 | 26d | 1 | 1.19mi |
| 36947 Melrose Dr Unit 4 Cathedral City, CA | 1.0 | 1.0 | 700 | $1,595 | $2.28 | 4d | 1 | 1.20mi |
| 36947 Melrose Dr Unit 4 Cathedral City, CA | 1.0 | 1.0 | 700 | $1,595 | $2.28 | 26d | 1 | 1.20mi |
| 36947 Melrose Dr Unit D Cathedral City, CA | 1.0 | 1.0 | 700 | $1,595 | $2.28 | 23d | 1 | 1.20mi |
| 68365 Tahquitz Rd Unit 8 Cathedral City, CA | 1.0 | 1.0 | 600 | $1,695 | $2.83 | 4d | 1 | 1.29mi |
| 68365 Tahquitz Rd Unit 6 Cathedral City, CA | 1.0 | 1.0 | 600 | $1,695 | $2.83 | 23d | 1 | 1.29mi |
| 37112 Palo Verde Dr Unit 4 Cathedral City, CA | 1.0 | 1.0 | 600 | $1,595 | $2.66 | 26d | 1 | 1.34mi |
| 37112 Palo Verde Dr Unit 3 Cathedral City, CA | 1.0 | 1.0 | 600 | $1,595 | $2.66 | 23d | 1 | 1.34mi |
| 37112 Palo Verde Dr Unit 4 Cathedral City, CA | 1.0 | 1.0 | 600 | $1,595 | $2.66 | 4d | 1 | 1.34mi |
| 37156 Palo Verde Dr Unit D Cathedral City, CA | 1.0 | 1.0 | 600 | $1,595 | $2.66 | 26d | 1 | 1.35mi |
| 37156 Palo Verde Dr Unit 5 Cathedral City, CA | 1.0 | 1.0 | 600 | $1,595 | $2.66 | 23d | 1 | 1.35mi |
| 37156 Palo Verde Dr Cathedral City, CA | 1.0 | 1.0 | 600 | $1,595 | $2.66 | 4d | 1 | 1.35mi |
| 33030 Shifting Sands Trl Apt 4 Cathedral City, CA | 2.0 | 1.0 | 821 | $1,599 | $1.95 | 26d | 1 | 1.36mi |
| 68460 Kings Rd Unit 3 Cathedral City, CA | 1.0 | 1.0 | 600 | $1,695 | $2.83 | 4d | 1 | 1.36mi |
| 68460 Kings Rd Unit C Cathedral City, CA | 1.0 | 1.0 | 600 | $1,695 | $2.83 | 23d | 1 | 1.36mi |
| 37111 Cathedral Canyon Dr Unit B Cathedral City, CA | 1.0 | 1.0 | 600 | $1,595 | $2.66 | 3d | 1 | 1.37mi |
| 37111 Cathedral Canyon Dr Unit 2 Cathedral City, CA | 1.0 | 1.0 | 600 | $1,595 | $2.66 | 23d | 1 | 1.37mi |
| 37111 Cathedral Canyon Dr Unit A Cathedral City, CA | 1.0 | 1.0 | 600 | $1,595 | $2.66 | 26d | 1 | 1.37mi |
| 33495 Cathedral Canyon Dr Unit B Cathedral City, CA | 2.0 | 1.0 | 1100 | $2,100 | $1.91 | 45d | 1 | 1.38mi |
| 33495 Cathedral Canyon Dr Cathedral City, CA | 2.0 | 1.0 | 1100 | $2,200 | $2.00 | 45d | 1 | 1.38mi |
HOA detail condo
- Monthly dues
- $395 · $4,740/yr
- Assessments
- None detected in remarks — confirm with the listing agent.
Listing history 3 events
-
2026-05-21status Pending
-
2025-06-05historical Backup Offers Accepted
-
2025-05-30$199,900 Active
ⓘ Source: listings_history table (triggers on properties + properties_extension) + one-shot
backfill from property_details.listing_events for pre-trigger history.
Tax reassessment forecast CA · Resets to sale price
- Current annual tax
- $1,837 · $153/mo
- Projected year-2 tax
- $1,837 · $153/mo
- Expected delta
- $0/yr ($0/mo · -0.0%)
ⓘ Screening estimate from a state-policy table — verify with the county assessor before closing.
Climate risk First Street
- Flood 1/10 Low FEMA zone X · 0% chance over 30 yrs
- Wildfire 4/10 Moderate
- Heat 9/10 Extreme 7 d/yr ≥112°F today · 21 d/yr by 30 yrs out
- Wind 1/10 Low
- Air quality 5/10 Major 6 unhealthy d/yr today · 8 by 30 yrs out
Nearby sold comps map
Loading sold comps map…
Walkable amenities ~0.75 mi
Loading nearby amenities…
Taxation est. · year 1
- Rental income
- $25,795
- − Mortgage interest
- −$11,198
- − Property taxes
- −$1,837
- − Insurance
- −$1,000
- − Repairs & maintenance
- −$2,064
- − Management
- −$2,064
- − HOA
- −$4,740
- − Depreciation
- −$5,815
- Taxable loss
- −$2,922
- Est. tax savings @ 24.0%
- +$701
- After-tax cash flow
- $923/yr
For passive investors: Depreciation is non-cash, so a rental often shows a tax loss while cash-flowing — sheltering income. Rental losses are passive: they offset passive income freely, and up to $25,000/yr can offset ordinary (W-2) income if you actively participate and your MAGI is under $100k (phasing out to $0 by $150k); unused losses carry forward. On sale, claimed depreciation is recaptured at up to 25%, and gains may owe capital-gains tax (a 1031 exchange can defer both). Figures are a year-1 estimate at your 24.0% rate — not tax advice; consult a CPA.
Schools (NCES district)
- District
- Palm Springs Unified
- NCES district ID
- 0629550
- Math proficiency
- 21% ▼ -7.00%
- Reading proficiency
- 42% ▬ 0.00%
- Median HH income
- $43,638
- Composite
- 26.76/100
- National rank
- #7131
- State rank
- #328 of 517 in CA
Livability — Palm Springs
- Score
- 66/100
- State rank
- #348
- US rank
- #11850
Category grades
Schools grade is shown separately in the Schools card above.
Census & demographics
- Census place
- Palm Springs, CA
- County
- Riverside County · 2,287,001 people
- City population
- 46,786
- Metro
- Riverside-San Bernardino-Ontario, CA
- Population (ZIP)
- 19,899
- Household income
- $77,688
- Rent vs Own
- Severe rent burden
- 1215.0
Population outlook (Riverside County) Hauer SSP2
- Today (2025)
- 2,664,475 people
- By 2030
- 2,802,692 · +5.2%
- By 2040
- 3,050,904 · +14.5%
- By 2050
- 3,256,783 · +22.2%
- By 2075
- 3,655,058 · +37.2%
- By 2100
- 3,766,594 · +41.4%
Race, ethnicity, and origin ACS 2023
- Neighborhood character
- Predominantly White (68%)
- Race & ethnicity
- White 68% Hispanic / Latino 20% Two or more races 12% Asian 6% Black 2% Native American 1%
- Hispanic origin (detail)
- Mexican 16%
- Common ancestry
- Lithuanian 4% Romanian 3% Slovak 3%
- Foreign-born
- 16% · Canada, China, South Korea
- Languages at home
- 81% English-only · Spanish 13% Tagalog/Filipino 2% Other Asian/Pacific 1%
Political lean MEDSL · Riverside
- 2024 margin
- Toss-up / Even · D 48.0% · R 49.3% · Other 2.6%
- 2008→2024 swing
- -3.6pp toward R · 2008: 2.3pp · 2024: -1.3pp
- All cycles
- 2024: R+1.3 2020: D+8.0 2016: D+4.3 2012: R+0.4 2008: D+2.3
Not yet ingested
- Civics
- —
Market trends
- HPI YoY
- ▼ -489.04%
- Current HPI
- 357.0969
- Rent YoY
- ▼ -0.43%
- Metro
- Riverside-San Bernardino-Ontario, CA
- State GDP YoY
- ▲ 3.21%
- F500 in state
- 116
Industry mix (Fortune 500 HQ in CA)
| Industry | F500 HQs | Revenue |
|---|---|---|
| Technology | 27 | $1,492B |
|
||
| Financial Services | 3 | $174B |
|
||
| Retail | 3 | $44B |
|
||
| Insurance | 3 | $26B |
|
||
| Media / Entertainment | 2 | $115B |
|
||
| Pharmaceuticals / Biotech | 2 | $62B |
|
||
Price history
3 events — show timeline
- 2026-05-21 Pending — TheMLS
- 2025-06-05 Contingent — TheMLS
- 2025-05-30 Listed $199,900 TheMLS
Property tax history
+1.9%/yrLatest (2025): $1,837 · -2.3% YoY. Source: county tax records.
Cash-flow waterfall
monthlySold comps — $/sqft
last 12 mo · ≤1 miLoading sold comps…