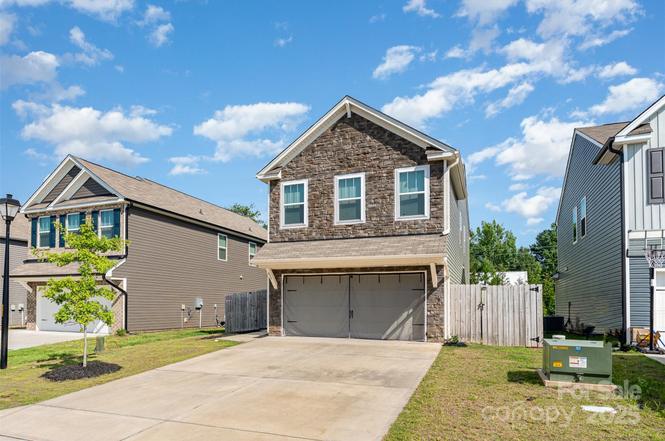
839 Foxglove Ln · York, SC
Flood risk 1/10 · Minimal
- FEMA flood zone
- X (unshaded)
- Chance of flooding over 30 yrs
- 0.0%
- Est. flood insurance / yr
- $507 – $1,088
Fire risk 3/10 · Minor
- Est. fire insurance / yr
- $783 – $1,453
Heat risk 6/10 · Moderate
- Hot days now (above 104°F)
- 7 days/yr
- Hot days in 30 yrs
- 16 days/yr
Wind risk 5/10 · Moderate
- Chance of severe wind over 30 yrs
- 25.0%
Air-quality risk 3/10 · Minor
- Unhealthy air days now
- 2 days/yr
- Unhealthy air days in 30 yrs
- 3 days/yr
Risk factors via First Street. Map © Google.
Why this score? — see what drove the D- grade
The composite is a weighted blend of 9 inputs, each scored 0–100. Each bar is that input's sub-score; the figure is the points it added to the 100-point composite (weight × sub-score).
- Cash flow +11.7/30.0
- ARV discount +7.8/15.0
- DSCR +3.4/10.0
- Livability +3.2/5.0
- 1% rule +3.1/10.0
- Schools +3.0/10.0
- Rent growth +2.5/5.0
- Condition / age +2.5/5.0
- Appreciation +0.0/10.0
$340,000
🖨 Deal sheet (PDF) 📄 Offer letter ✓ Due diligence
Listing remarks
This nearly new 4-bedroom, 2.5-bathroom home was built in 2023 and offers the perfect blend of modern design, comfort, and space. With a 2-car garage, an open and functional layout, and thoughtful upgrades throughout, this home is ready for its next chapter. The kitchen opens into the main living space, creating an ideal setup for hosting guests. Upstairs, you’ll find four generously sized bedrooms, including a private primary suite with a walk-in closet and en-suite bath. Outside, enjoy the fully fenced backyard—perfect for pets, play, or simply relaxing in your own space. Located in the peaceful Austen Lakes neighborhood, you’re just minutes from charming downtown York,
Key facts
- 3,920 sq ft lot
- 2 garage spots
- Built 2023
Property features AI
Finance
- HOA & community: Mandatory HOA with annual fee of $330
Exterior
- Parking: Attached 2-car garage (main level, approximately 398 sq ft); Driveway parking
- Utilities: City water; Public sewer
- Home design: Single-family residence; Site-built construction; Two levels; Entry and living areas on main and upper floors
- Construction: Vinyl exterior; Slab foundation; Builder: True Homes
- Exterior features: Wood privacy fence in backyard; Concrete and paved public road access
Interior
- Kitchen: Dishwasher; Disposal; Electric oven and electric range; Exhaust hood; Microwave; Refrigerator
- Bedrooms: 4 bedrooms (all on upper level)
- Bathrooms: 2 full bathrooms; 1 half bathroom
- Heating & cooling: Forced air heating; Central air conditioning; Ceiling fans
- Interior features: 11 total rooms; Ceiling fans; Forced air heating; Central air conditioning
- Laundry & utility: Dedicated laundry room
Neighborhood map
What this means for you Summary
Snapshot
- This is a 4-bed/2.5-bath single-family listed at $340k.
Deal economics
- At list price, monthly cash flow is $-99 ($-1k/yr) — negative.
- To cash-flow at today's rent, offer at most $323k (5.1% below list).
- To meet the 1% rule (rent ≥ 1% of price), the offer needs to be $275k (19.1% below list).
- Recommended offer: $275k (19.1% below list) — sets the bar for 1% rule.
- Cap rate 5.9% vs local median 4.6% in York — meaningfully above typical; check what's discounted (condition, days-on-market, listing class) to confirm the premium yield is real.
Location & tenants
- Location reads 65/100 on livability (#139 in SC) — a middle-class / working-renter tenant base. Strengths: cost of living A+, housing A+, health & safety A+; Watch: crime F, amenities F, commute F.
- York 01 (rural): math 31% / reading 40% proficiency, ranked #41 of 80 in SC (top 51%) — families likely to look elsewhere, expect single-tenant / working-renter base with shorter leases.
- Zoned schools: Cotton Belt Elementary (math 42% / reading 37%, grade F, #295 of 597 statewide, top 50%, 437 students, 80% FRL); York Middle (math 21% / reading 33%, grade F, #153 of 229 statewide, top 68%, 814 students, 72% FRL); York Comprehensive High (math 39% / reading 82%, grade C+, #108 of 196 statewide, top 55%, 1,493 students, 68% FRL) — zoned schools average 74% FRL vs 54% district-wide (20 pts higher); higher-poverty schools than district average — tighter screening recommended.
- Market conditions: 545 active listings in the ZIP; 4 comparable units currently listed for rent nearby; rentals leasing fast (median 4d on market — plan ~1-2 weeks tenant-placement turnaround); solid renter incomes; 2,550 units permitted in York County in 2024 (350 in 5+ unit buildings).
- This rent runs 42% of the median local income ($79k/yr) — at the standard rent-burdened threshold; future hikes will face affordability resistance.
Forward outlook
- Local home prices are declining (-3.0%/yr); year-one equity from $2k of loan paydown is wiped out by about $10k of value loss. Plan a longer hold.
- York County population projected at +44% by 2050 — long-run rental-demand tailwind backs the buy-and-hold thesis.
Negotiation context
- It's been on market 346 days — a 12% lower offer ($299k) is reasonable based on typical stale-listing flexibility.
Risks & watch-outs
- Climate carrying-cost: moderate wind risk, 25% chance of damaging wind over 30y; extreme-heat days projected 7→16/yr by 2055 (HVAC capex compounding) — expect insurance premiums to compound above CPI over the hold.
Questions for the listing agent
- What do current leases actually rent for vs. the listed asking? Can we see a recent rent roll and the last 12 months of T-12 income?
- It's been on market 346 days. Have you received any prior offers? Is the seller open to a 19% concession, seller financing, or rate buy-down credit?
- What does the HOA fee cover, when was the last increase, and are there any pending special assessments or reserve-fund shortfalls?
- Why hasn't it sold? Are there any deal-killer items the seller is aware of (foundation, flood, title, zoning, code violations)?
- Is there a deadline driving the sale (1031 exchange, divorce, estate, relocation)? That informs how much negotiation room exists.
- Schools are D-rated, which usually means shorter tenancies and higher turnover. Who's the typical renter profile here, and what's been the actual vacancy rate?
- Crime grade is F in this area — have there been break-ins, vandalism, or insurance claims at this property in the last 3 years? What carrier currently insures it and at what premium?
- The area grade is low — what's the realistic commute time and amenity access for the typical tenant pool here? Any planned neighborhood developments (good or bad) we should know about?
- What's the average days-on-market for RENTAL listings here right now (not sales)? A rising rental-DOM trend means longer vacancies and softer asking-rent achievability than the comps imply.
- What's the recent tenant-quality profile in this submarket — average credit score on applications, eviction rate, late-payment / NSF rate, and stable-employment percentage? A property-management company in the area should have these aggregated.
- How much new for-sale + rental construction is in the pipeline within 1–3 miles? Heavy new supply typically softens prices + rents 12–24 months out; constrained supply supports both.
Investment metrics
- 1% rule
- 0.81% ✗
- Cap rate
- 5.95%
- Cash-on-cash
- -1.24%
- DSCR
- 0.94
- GRM
- 10.3
CMA / ARV
- ARV (on-the-fly)
- $342,645
- Comps found
- 12
Show comp detail 12 sales within ~0.75 mi
| Address | Dist | Beds/Ba | Sqft | Sold | Price | $/sf | Match |
|---|---|---|---|---|---|---|---|
| 1211 Whitehall Hill Rd | 0.30mi | 3/2.5 (-1) | 2,117 (-2%) | 3mo | $315,000 | $149 | 76 |
| 767 Gants Rd | 0.27mi | 3/2.5 (-1) | 2,107 (-2%) | 4mo | $310,000 | $147 | 76 |
| 373 Brannon Meadows Dr | 0.14mi | 3/2.5 (-1) | 2,001 (-7%) | 3mo | $335,000 | $167 | 74 |
| 404 Vidette Dr | 0.58mi | 4/3.0 | 2,156 (0%) | 1mo | $328,990 | $153 | 70 |
| 408 Vidette Dr | 0.58mi | 4/2.5 | 2,097 (-3%) | 3mo | $333,990 | $159 | 66 |
| 145 Pheasant Ridge Cir | 0.35mi | 4/2.0 | 1,943 (-10%) | 1mo | $300,000 | $154 | 65 |
| 244 Bezelle Ave | 0.75mi | 4/3.0 | 2,156 (0%) | 4mo | $345,990 | $160 | 60 |
| 247 Bezelle Ave | 0.75mi | 4/2.5 | 2,097 (-3%) | 3mo | $349,970 | $167 | 58 |
| 412 Vidette Dr | 0.59mi | 4/2.5 | 1,889 (-12%) | 3mo | $304,990 | $161 | 50 |
| 416 Vidette Dr | 0.59mi | 3/2.5 (-1) | 1,939 (-10%) | 4mo | $303,990 | $157 | 47 |
| 681 Cashion Rd | 0.62mi | 3/2.5 (-1) | 1,939 (-10%) | 3mo | $328,990 | $170 | 47 |
| 255 Bezelle Ave | 0.74mi | 3/2.5 (-1) | 1,939 (-10%) | 3mo | $306,990 | $158 | 42 |
Match score weights: distance 35% · size 25% · config 20% · recency 20%. Top-matched comps best support the ARV.
Projected returns pro-forma
-3.0% appreciation · 3.0% rent growth · sell at horizon
- IRR
- -18.3%
- Equity multiple
- 0.36×
- Total profit
- $-61,378
- Equity at exit
- $50,695
- IRR
- -10.7%
- Equity multiple
- 0.35×
- Total profit
- $-61,556
- Equity at exit
- $29,397
Cash invested: $95,200 (down + closing). Projections, not guarantees.
Landlord ↔ Tenant lean methodology
- Overall (STATE)
- 90 Strongly Landlord-Friendly
- State South Carolina
- 90 Strongly Landlord-Friendly · R+6
- County
- — inherits STATE
- City
- — inherits STATE
ZIP-level market 29745
- Home prices YoY
- -30.3%
- Active inventory
- 545
- Price-to-rent
- 10.3×
Monthly cashflow live
- Estimated rent
- $2,751 medium interval (Pro) →
- Mortgage (P&I)
- −$1,783
- Tax from tax record
- −$319 /mo · $3,829/yr
- Insurance
- −$142
- HOA
- −$28
- Vacancy / Maint / Mgmt
- −$578
- Net cashflow
- $-99
Break-even live
Sensitivity live
| Price | -10% $94 | -5% $-2 | +0% $-99 | +5% $-195 | +10% $-291 |
|---|---|---|---|---|---|
| Rent | -10% $-316 | -5% $-207 | +0% $-99 | +5% $10 | +10% $119 |
| Rate | -1.0pp $73 | -0.5pp $-12 | base $-99 | +0.5pp $-187 | +1.0pp $-276 |
UW: 25.0% down · 7.5% · 30yr · 1.5% tax · 5.0% vac · 8.0% maint · 8.0% mgmt
Financing live
Cash to close
- Down payment
- $85,000
- Closing costs
- $10,200
- Reserves months
- —
- Total cash needed
- —
Loan-product check · same deal, 3 products live
Conventional
25% down · 7.5% · 30yr
- Down + closing
- —
- Monthly P&I
- —
- Monthly cashflow
- —
- DSCR
- —
- Eligible?
- —
Personal DTI + credit; lowest rate.
DSCR
20% down · 8.5% · 30yr
- Down + closing
- —
- Monthly P&I
- —
- Monthly cashflow
- —
- DSCR
- —
- Eligible?
- —
No personal income docs; deal must DSCR.
Hard money
10% down · 12.0% · 12mo
- Down + closing
- —
- Monthly P&I
- —
- Monthly cashflow
- —
- DSCR
- —
- Eligible?
- —
Short-term bridge; refi at stabilization.
Rent comps 4 comps
| Address | Beds | Baths | Sqft | Rent | $/sqft | DOM | Units | Dist |
|---|---|---|---|---|---|---|---|---|
| 372 Brannon Meadows Dr York, SC | 3.0 | 2.5 | 2265 | $2,500 | $1.10 | 24d | 1 | 0.13mi |
| 730 Gants Rd York, SC | 4.0 | 2.5 | 2369 | $2,450 | $1.03 | 0d | 1 | 0.34mi |
| 208 Washington St York, SC | 5.0 | 3.0 | 3000 | $1,995 | $0.67 | 3d | 1 | 0.62mi |
| 195 Bezelle Ave York, SC | 5.0 | 3.0 | 2570 | $2,700 | $1.05 | 0d | 1 | 0.81mi |
HOA detail
- Monthly dues
- $28 · $336/yr
Listing history 18 events
-
2026-06-21days on market $340,000 Active 346 DOM
-
2026-06-18days on market $340,000 Active 343 DOM
-
2026-06-17days on market $340,000 Active 342 DOM
-
2026-06-16days on market $340,000 Active 341 DOM
-
2026-06-15days on market $340,000 Active 340 DOM
-
2026-06-13days on market $340,000 Active 338 DOM
-
2026-06-09days on market $340,000 Active 334 DOM
-
2026-06-08days on market $340,000 Active 333 DOM
-
2026-06-07days on market $340,000 Active 332 DOM
-
2026-06-04days on market $340,000 Active 329 DOM
-
2026-06-03days on market $340,000 Active 328 DOM
-
2026-06-02days on market $340,000 Active 327 DOM
-
2026-06-01days on market $340,000 Active 326 DOM
-
2026-05-31days on market $340,000 Active 325 DOM
-
2026-01-02price $340,000
-
2025-07-31price $355,000
-
2025-07-11$360,000 Active
-
2025-07-09historical $360,000
ⓘ Source: listings_history table (triggers on properties + properties_extension) + one-shot
backfill from property_details.listing_events for pre-trigger history.
Tax reassessment forecast SC · Resets to sale price
- Current annual tax
- $3,829 · $319/mo
- Projected year-2 tax
- $3,829 · $319/mo
- Expected delta
- $0/yr ($0/mo · 0.0%)
ⓘ Screening estimate from a state-policy table — verify with the county assessor before closing.
Climate risk First Street
- Flood 1/10 Low FEMA zone X (unshaded) · 0% chance over 30 yrs
- Wildfire 3/10 Moderate
- Heat 6/10 Major 7 d/yr ≥104°F today · 16 d/yr by 30 yrs out
- Wind 5/10 Major 25% chance of damaging wind over 30 yrs
- Air quality 3/10 Moderate 2 unhealthy d/yr today · 3 by 30 yrs out
Nearby sold comps map
Loading sold comps map…
Walkable amenities ~0.75 mi
Loading nearby amenities…
Taxation est. · year 1
- Rental income
- $33,011
- − Mortgage interest
- −$19,045
- − Property taxes
- −$3,829
- − Insurance
- −$1,700
- − Repairs & maintenance
- −$2,641
- − Management
- −$2,641
- − HOA
- −$336
- − Depreciation
- −$9,891
- Taxable loss
- −$7,072
- Est. tax savings @ 24.0%
- +$1,697
- After-tax cash flow
- $515/yr
For passive investors: Depreciation is non-cash, so a rental often shows a tax loss while cash-flowing — sheltering income. Rental losses are passive: they offset passive income freely, and up to $25,000/yr can offset ordinary (W-2) income if you actively participate and your MAGI is under $100k (phasing out to $0 by $150k); unused losses carry forward. On sale, claimed depreciation is recaptured at up to 25%, and gains may owe capital-gains tax (a 1031 exchange can defer both). Figures are a year-1 estimate at your 24.0% rate — not tax advice; consult a CPA.
Schools (NCES district)
- District
- York 01
- NCES district ID
- 4503810
- Math proficiency
- 31% ▼ -16.00%
- Reading proficiency
- 40% ▬ 0.00%
- Median HH income
- $44,491
- Composite
- 30.21/100
- National rank
- #6305
- State rank
- #41 of 80 in SC
Livability — York
- Score
- 65/100
- State rank
- #139
- US rank
- #13425
Category grades
Schools grade is shown separately in the Schools card above.
Census & demographics
- County
- York County · 281,758 people
- City population
- 34,909
- Metro
- Charlotte-Concord-Gastonia, NC-SC
- Population (ZIP)
- 34,909
- Household income
- $79,117
- Rent vs Own
- Severe rent burden
- 321.0
Population outlook (York County) Hauer SSP2
- Today (2025)
- 307,757 people
- By 2030
- 335,979 · +9.2%
- By 2040
- 391,378 · +27.2%
- By 2050
- 443,234 · +44.0%
- By 2075
- 557,102 · +81.0%
- By 2100
- 625,837 · +103.4%
Race, ethnicity, and origin ACS 2023
- Neighborhood character
- Predominantly White (75%)
- Race & ethnicity
- White 75% Black 12% Two or more races 6% Hispanic / Latino 6% Asian 1%
- Hispanic origin (detail)
- Mexican 4%
- Common ancestry
- Romanian 3% Serbian 3% Italian 2%
- Foreign-born
- 4% · Canada
- Languages at home
- 94% English-only · Spanish 4%
Political lean MEDSL · York
- 2024 margin
- R (+19.1) · D 39.7% · R 58.8% · Other 1.5%
- 2008→2024 swing
- -1.4pp toward R · 2008: -17.7pp · 2024: -19.1pp
- All cycles
- 2024: R+19.1 2020: R+16.5 2016: R+22.1 2012: R+20.5 2008: R+17.7
Not yet ingested
- Civics
- —
Market trends
- HPI YoY
- ▼ -109.42%
- Current HPI
- 251.6848
- Rent YoY
- —
- Metro
- Charlotte-Concord-Gastonia, NC-SC
- State GDP YoY
- ▲ 4.51%
- F500 in state
- 2
Industry mix (Fortune 500 HQ in SC)
| Industry | F500 HQs | Revenue |
|---|---|---|
| Packaging | 1 | $7B |
|
||
Price history
-5.6% since first listed4 events — show timeline
- 2026-01-02 Price Changed $340,000 CANOPYMLS as Distributed by MLS Grid
- 2025-07-31 Price Changed $355,000 CANOPYMLS as Distributed by MLS Grid
- 2025-07-11 Listed $360,000 CANOPYMLS as Distributed by MLS Grid
- 2025-07-09 Coming Soon $360,000 CANOPYMLS as Distributed by MLS Grid
Property tax history
+259.0%/yrLatest (2025): $3,829 · +0.7% YoY. Source: county tax records.
Cash-flow waterfall
monthlySold comps — $/sqft
last 12 mo · ≤1 miLoading sold comps…