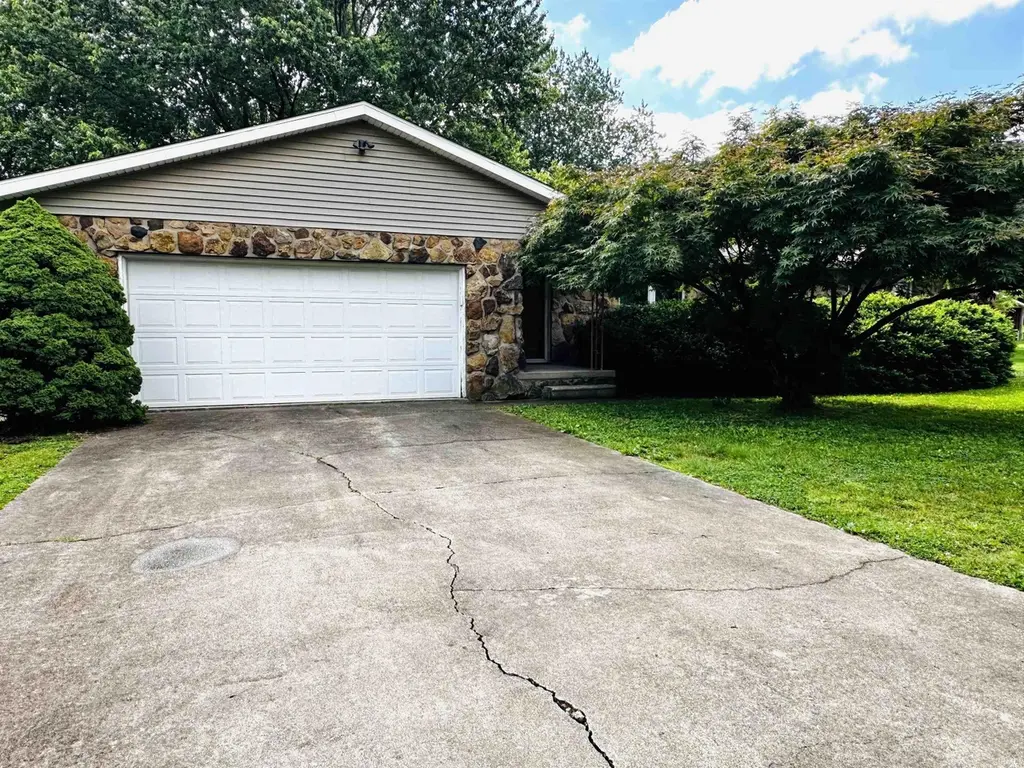
12 Cindy Kay Dr · Washington, IN
Flood risk 1/10 · Minimal
- FEMA flood zone
- —
- Chance of flooding over 30 yrs
- 0.0%
- Est. flood insurance / yr
- —
Fire risk 3/10 · Minor
- Est. fire insurance / yr
- $717 – $1,331
Heat risk 5/10 · Moderate
- Hot days now (above 107°F)
- 7 days/yr
- Hot days in 30 yrs
- 19 days/yr
Wind risk 2/10 · Minimal
- Chance of severe wind over 30 yrs
- 2.0%
Air-quality risk 4/10 · Minor
- Unhealthy air days now
- 3 days/yr
- Unhealthy air days in 30 yrs
- 5 days/yr
Risk factors via First Street. Map © Google.
Why this score? — see what drove the D grade
The composite is a weighted blend of 9 inputs, each scored 0–100. Each bar is that input's sub-score; the figure is the points it added to the 100-point composite (weight × sub-score).
- Cash flow +18.8/30.0
- DSCR +5.9/10.0
- 1% rule +3.7/10.0
- Livability +3.6/5.0
- Schools +3.2/10.0
- Rent growth +2.5/5.0
- Condition / age +2.5/5.0
- ARV discount +0.8/15.0
- Appreciation +0.0/10.0
$185,000
🖨 Deal sheet 📄 Offer letter ✓ Due diligence
Listing remarks
Excellent edge of town location for this 2 bedroom 1.5 bath home with two spacious living areas-perfect for relaxing or entertaining-along with a bright eat-in kitchen designed for everyday ease. Recent updates to include new roof and new HVAC system allowing you to move in with confidence. Step outside to unwind on the updated covered back patio where you can enjoy peaceful views of the generous backyard. The outdoor space is complete with a 12x20 utility shed proving ample room for storage or hobbies. An attached 2-car garage adds even more practicality to this well-rounded home.
Key facts
- Peaceful views
- Covered back patio
- Generous backyard
Tags
Property features AI
Finance
- Other: Property listed by RE/MAX Elite
- Financial info: Financial details not provided
- HOA & community: Subdivision: Rolling Acres
Exterior
- Parking: Attached 2-car garage
- Security: Security details not provided
- Utilities: Public water; Public sewer
- Home design: Single-family residence, site-built; One story
- Construction: Stone and vinyl siding exterior
- Exterior features: Level lot; Shed on property; Lot dimensions approximately 96 x 207
Interior
- Kitchen: Kitchen details not provided
- Bedrooms: Details not provided
- Flooring: Flooring details not provided
- Bathrooms: 1 full bathroom; 1 half bathroom; 2 bathrooms on the main level
- Heating & cooling: Natural gas heating with forced air; Central air conditioning
- Interior features: 6 total rooms; Crawl space basement
- Laundry & utility: Main-level laundry
Neighborhood map
What this means for you Summary
Snapshot
- This is a 3-bed/1.5-bath single-family listed at $185k.
Deal economics
- At list price, monthly cash flow is $187 ($2k/yr) — positive.
- The deal already cash-flows at list — no discount required.
- To meet the 1% rule (rent ≥ 1% of price), the offer needs to be $161k (12.9% below list).
- Recommended offer: $161k (12.9% below list) — sets the bar for 1% rule.
- Cap rate 7.5% vs local median 4.9% in Washington — top-decile yield for the area; either an underpriced asset or a hidden risk that comps aren't pricing in. Stress-test before assuming the spread holds.
Location & tenants
- Location reads 72/100 on livability (#110 in IN) — a middle-class / working-renter tenant base. Strengths: cost of living A+, housing A+, health & safety A+; Watch: amenities F, commute F, employment F.
- Washington Community Schools (town): math 36% / reading 38% proficiency, ranked #174 of 301 in IN (top 58%) — families likely to look elsewhere, expect single-tenant / working-renter base with shorter leases.
- Zoned schools: Washington Upper Elementary (math 44% / reading 43%, grade D, #90 of 330 statewide, top 27%, 361 students, 62% FRL); Washington High School (math 27% / reading 57%, grade F, #197 of 369 statewide, top 57%, 780 students, 58% FRL) — zoned schools at 60% FRL track the district average.
- Market conditions: 112 active listings in the ZIP; 71 units permitted in Daviess County in 2024 (0 in 5+ unit buildings).
Forward outlook
- Local home prices are declining (-3.0%/yr); year-one equity from $1k of loan paydown is wiped out by about $6k of value loss. Plan a longer hold.
- Daviess County population projected at +6% by 2050 — modest demand growth; plan on rents tracking national, not racing it.
Negotiation context
- It's been on market 38 days — a 3% lower offer ($179k) is reasonable based on typical stale-listing flexibility.
Risks & watch-outs
- Climate carrying-cost: extreme-heat days projected 7→19/yr by 2055 (HVAC capex compounding) — expect insurance premiums to compound above CPI over the hold.
Questions for the listing agent
- It's been on market 38 days. Have you received any prior offers? Is the seller open to a 13% concession, seller financing, or rate buy-down credit?
- Built in 1979 — when were the roof, HVAC, electrical panel, plumbing, and water heater last replaced?
- Is there a deadline driving the sale (1031 exchange, divorce, estate, relocation)? That informs how much negotiation room exists.
- The area grade is low — what's the realistic commute time and amenity access for the typical tenant pool here? Any planned neighborhood developments (good or bad) we should know about?
- What's the average days-on-market for RENTAL listings here right now (not sales)? A rising rental-DOM trend means longer vacancies and softer asking-rent achievability than the comps imply.
- What's the recent tenant-quality profile in this submarket — average credit score on applications, eviction rate, late-payment / NSF rate, and stable-employment percentage? A property-management company in the area should have these aggregated.
- How much new for-sale + rental construction is in the pipeline within 1–3 miles? Heavy new supply typically softens prices + rents 12–24 months out; constrained supply supports both.
Investment metrics
- 1% rule
- 0.87% ✗
- Cap rate
- 7.51%
- Cash-on-cash
- 4.34%
- DSCR
- 1.19
- GRM
- 9.6
CMA / ARV
- ARV (median comp)
- $160,973
- List price
- $185,000
- Delta
- 14.93%
- Verdict
- OVERPRICED
- Comps
- 20 within 1.0 mi
Show comp detail 8 sales within ~0.75 mi
| Address | Dist | Beds/Ba | Sqft | Sold | Price | $/sf | Match |
|---|---|---|---|---|---|---|---|
| 144 S 150 W | 0.17mi | 3/3.0 | 1,520 (-0%) | 14mo | $295,000 | $194 | 74 |
| 505 W Van Trees St | 0.68mi | 3/2.0 | 1,520 (-0%) | 5mo | $195,000 | $128 | 62 |
| 13 Cindy Kay Dr | 0.04mi | 3/1.5 | 1,312 (-14%) | 24mo | $193,000 | $147 | 55 |
| 600 W National Hwy | 0.54mi | 2/1.0 (-1) | 1,466 (-4%) | 19mo | $139,000 | $95 | 46 |
| 701 W Walnut St | 0.60mi | 3/1.0 | 1,328 (-13%) | 10mo | $178,500 | $134 | 40 |
| 1205 & 1207 W Walnut St | 0.44mi | 3/2.0 | 1,350 (-12%) | 24mo | $130,000 | $96 | 38 |
| 603 SW 6th St | 0.54mi | 4/1.0 (+1) | 1,428 (-6%) | 23mo | $150,000 | $105 | 38 |
| 1209 Mccormick Ave | 0.50mi | 2/2.0 (-1) | 1,336 (-12%) | 16mo | $156,000 | $117 | 35 |
Match score weights: distance 35% · size 25% · config 20% · recency 20%. Top-matched comps best support the ARV.
Projected returns pro-forma
-3.0% appreciation · 3.0% rent growth · sell at horizon
- IRR
- -9.6%
- Equity multiple
- 0.65×
- Total profit
- $-18,133
- Equity at exit
- $27,584
- IRR
- -0.2%
- Equity multiple
- 0.98×
- Total profit
- $-799
- Equity at exit
- $15,995
Cash invested: $51,800 (down + closing). Projections, not guarantees.
Landlord ↔ Tenant lean methodology
- Overall (STATE)
- 90 Strongly Landlord-Friendly
- State Indiana
- 90 Strongly Landlord-Friendly · R+11
- County
- — inherits STATE
- City
- — inherits STATE
ZIP-level market 47501
- Home prices YoY
- -23.2%
- Active inventory
- 112
- Price-to-rent
- 9.6×
Monthly cashflow live
- Estimated rent
- $1,611 medium interval (Pro) →
- Mortgage (P&I)
- −$970
- Tax from tax record
- −$38 /mo · $453/yr
- Insurance
- −$77
- HOA
- −$0
- Vacancy / Maint / Mgmt
- −$338
- Net cashflow
- $187
Break-even live
UW: 25.0% down · 7.5% · 30yr · 1.5% tax · 5.0% vac · 8.0% maint · 8.0% mgmt
Financing live
Cash to close
- Down payment
- $46,250
- Closing costs
- $5,550
- Reserves months
- —
- Total cash needed
- —
Loan-product check · same deal, 3 products live
Conventional
25% down · 7.5% · 30yr
- Down + closing
- —
- Monthly P&I
- —
- Monthly cashflow
- —
- DSCR
- —
- Eligible?
- —
Personal DTI + credit; lowest rate.
DSCR
20% down · 8.5% · 30yr
- Down + closing
- —
- Monthly P&I
- —
- Monthly cashflow
- —
- DSCR
- —
- Eligible?
- —
No personal income docs; deal must DSCR.
Hard money
10% down · 12.0% · 12mo
- Down + closing
- —
- Monthly P&I
- —
- Monthly cashflow
- —
- DSCR
- —
- Eligible?
- —
Short-term bridge; refi at stabilization.
Listing history 17 events
-
2026-06-17status $185,000 Pending 38 DOM
-
2026-06-16days on market $185,000 Active 38 DOM
-
2026-06-15days on market $185,000 Active 37 DOM
-
2026-06-13days on market $185,000 Active 35 DOM
-
2026-06-12remarks 588-char remark
-
2026-06-12days on market $185,000 Active 34 DOM
-
2026-06-09days on market $185,000 Active 31 DOM
-
2026-06-09remarks 492-char remark
-
2026-06-08days on market $185,000 Active 30 DOM
-
2026-06-07days on market $185,000 Active 29 DOM
-
2026-06-07days on market $185,000 Active 28 DOM
-
2026-06-04days on market $185,000 Active 25 DOM
-
2026-06-02days on market $185,000 Active 24 DOM
-
2026-06-01days on market $185,000 Active 23 DOM
-
2026-05-31days on market $185,000 Active 22 DOM
-
2026-05-31days on market $185,000 Active 21 DOM
-
2026-05-09$185,000 Active 484-char remark
ⓘ Source: listings_history table (triggers on properties + properties_extension) + one-shot
backfill from property_details.listing_events for pre-trigger history.
Tax reassessment forecast IN · Partial reset (capped growth)
- Current annual tax
- $453 · $38/mo
- Projected year-2 tax
- $1,013 · $84/mo
- Expected delta
- +$560/yr (+$47/mo · 123.5%)
ⓘ Screening estimate from a state-policy table — verify with the county assessor before closing.
Climate risk First Street
- Flood 1/10 Low 0% chance over 30 yrs
- Wildfire 3/10 Moderate
- Heat 5/10 Major 7 d/yr ≥107°F today · 19 d/yr by 30 yrs out
- Wind 2/10 Low 2% chance of damaging wind over 30 yrs
- Air quality 4/10 Moderate 3 unhealthy d/yr today · 5 by 30 yrs out
Nearby sold comps map
Loading sold comps map…
Walkable amenities ~0.75 mi
Loading nearby amenities…
Taxation est. · year 1
- Rental income
- $19,329
- − Mortgage interest
- −$10,363
- − Property taxes
- −$453
- − Insurance
- −$925
- − Repairs & maintenance
- −$1,546
- − Management
- −$1,546
- − Depreciation
- −$5,382
- Taxable loss
- −$887
- Est. tax savings @ 24.0%
- +$213
- After-tax cash flow
- $2,462/yr
For passive investors: Depreciation is non-cash, so a rental often shows a tax loss while cash-flowing — sheltering income. Rental losses are passive: they offset passive income freely, and up to $25,000/yr can offset ordinary (W-2) income if you actively participate and your MAGI is under $100k (phasing out to $0 by $150k); unused losses carry forward. On sale, claimed depreciation is recaptured at up to 25%, and gains may owe capital-gains tax (a 1031 exchange can defer both). Figures are a year-1 estimate at your 24.0% rate — not tax advice; consult a CPA.
Schools (NCES district)
- District
- Washington Community Schools
- NCES district ID
- 1812450
- Math proficiency
- 36% ▼ -1.00%
- Reading proficiency
- 38% ▼ -3.00%
- Median HH income
- $45,422
- Composite
- 31.57/100
- National rank
- #5952
- State rank
- #174 of 301 in IN
Livability — Washington
- Score
- 72/100
- State rank
- #110
- US rank
- #5706
Category grades
Schools grade is shown separately in the Schools card above.
Census & demographics
- City population
- 18,335
- Population (ZIP)
- 18,335
Population outlook (Daviess County) Hauer SSP2
- Today (2025)
- 33,940 people
- By 2030
- 34,457 · +1.5%
- By 2040
- 35,412 · +4.3%
- By 2050
- 35,803 · +5.5%
- By 2075
- 35,173 · +3.6%
- By 2100
- 29,799 · -12.2%
Race, ethnicity, and origin ACS 2023
- Neighborhood character
- Predominantly White (81%)
- Race & ethnicity
- White 81% Hispanic / Latino 11% Two or more races 8% Black 3%
- Hispanic origin (detail)
- Mexican 9%
- Common ancestry
- Hispanic 4% Lithuanian 2% Slovak 1%
- Foreign-born
- 7% · Canada
- Languages at home
- 89% English-only · Spanish 5% French/Haitian/Cajun 3% German/W. Germanic 1%
Political lean MEDSL · Daviess
- 2024 margin
- Solid R (+64.3) · D 17.1% · R 81.5% · Other 1.4%
- 2008→2024 swing
- -29.1pp toward R · 2008: -35.2pp · 2024: -64.3pp
- All cycles
- 2024: R+64.3 2020: R+62.0 2016: R+62.8 2012: R+50.8 2008: R+35.2
Not yet ingested
- Civics
- —
Market trends
- HPI YoY
- ▼ -64.30%
- Current HPI
- 213.3049
- Rent YoY
- —
- Metro
- —
- State GDP YoY
- ▲ 2.90%
- F500 in state
- 18
Industry mix (Fortune 500 HQ in IN)
| Industry | F500 HQs | Revenue |
|---|---|---|
| Industrial Machinery | 2 | $37B |
|
||
| Healthcare | 1 | $177B |
|
||
| Pharmaceuticals | 1 | $45B |
|
||
| Metals / Steel | 1 | $18B |
|
||
| Agriculture | 1 | $17B |
|
||
| Packaging | 1 | $12B |
|
||
Price history
2 events — show timeline
- 2026-06-16 Pending — IRMLS
- 2026-05-09 Listed $185,000 IRMLS
Property tax history
-1.0%/yrLatest (2024): $453 · +8.4% YoY. Source: county tax records.
Cash-flow waterfall
monthlySold comps — $/sqft
last 12 mo · ≤1 miLoading sold comps…