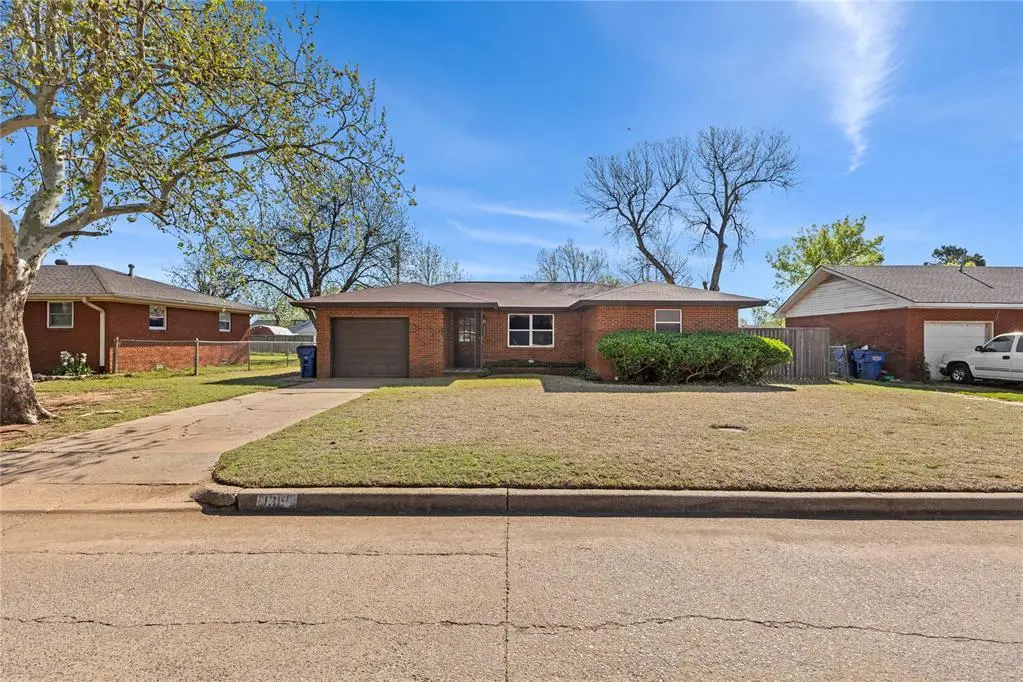
1319 S 11th St · Kingfisher, OK
Flood risk 1/10 · Minimal
- FEMA flood zone
- X (unshaded)
- Chance of flooding over 30 yrs
- 0.0%
- Est. flood insurance / yr
- $507 – $1,088
Fire risk 2/10 · Minimal
- Est. fire insurance / yr
- $2,463 – $4,575
Heat risk 6/10 · Moderate
- Hot days now (above 108°F)
- 7 days/yr
- Hot days in 30 yrs
- 19 days/yr
Wind risk 2/10 · Minimal
- Chance of severe wind over 30 yrs
- 2.0%
Air-quality risk 1/10 · Minimal
- Unhealthy air days now
- 0 days/yr
- Unhealthy air days in 30 yrs
- 0 days/yr
Risk factors via First Street. Map © Google.
Why this score? — see what drove the D+ grade
The composite is a weighted blend of 9 inputs, each scored 0–100. Each bar is that input's sub-score; the figure is the points it added to the 100-point composite (weight × sub-score).
- Cash flow +16.3/30.0
- ARV discount +9.7/15.0
- DSCR +5.1/10.0
- 1% rule +3.4/10.0
- Schools +3.3/10.0
- Livability +3.2/5.0
- Rent growth +2.5/5.0
- Condition / age +2.5/5.0
- Appreciation +0.0/10.0
$155,000
🖨 Deal sheet (PDF) 📄 Offer letter ✓ Due diligence
Listing remarks
# Welcome Home to 1319 S 11th St, Kingfisher, OK 73750 Looking for a charming little place that won't break the bank? This charming 3-bedroom, 1-bathroom home is ready and waiting for you. With beautiful hardwood floors running throughout, this house has that warm, classic feel you can't fake. It's the kind of place that makes you smile the moment you come through the door. Outside, you'll love the pergola-covered patio — perfect for morning coffee, evening hangouts, or just relaxing in the fenced backyard. There's plenty of room to spread out, garden, or let the dog run around without a worry. Plus, the attached one-car garage keeps things convenient for everyday life. Here's where
Key facts
- 8,398 sq ft lot
- Garage
- Built 1961
Property features AI
Finance
- Other: Occupied by owner; No conditions affecting sale
- Financial info: Financing options accepted: Cash, Conventional, FHA/VA, Rural Housing Services; Assumable loans: No; Loan qualification possible
- HOA & community: No mandatory association dues
Exterior
- Parking: Concrete parking; 1-car garage with garage door lift
- Utilities: Electricity available; Natural gas available; High-speed internet available; Public utilities
- Home design: Single-family residence; One story; Facing west; Residential property
- Construction: Brick construction; Composition roof; Conventional foundation; Existing property (not new construction); Homestead eligible
- Exterior features: Covered porch; Rain gutters; Interior lot
Interior
- Bedrooms: 3 bedrooms
- Flooring: Vinyl flooring; Wood flooring
- Bathrooms: 1 full bathroom
- Interior features: Ceiling fans; Window treatments; Inside utility
- Laundry & utility: Inside utility
Neighborhood map
What this means for you Summary
Snapshot
- This is a 3-bed/1.0-bath single-family listed at $155k.
Deal economics
- At list price, monthly cash flow is $86 ($1k/yr) — positive.
- The deal already cash-flows at list — no discount required.
- To meet the 1% rule (rent ≥ 1% of price), the offer needs to be $130k (16.1% below list).
- Recommended offer: $130k (16.1% below list) — sets the bar for 1% rule.
- Cap rate 7.0% vs local median 3.1% in Kingfisher — top-decile yield for the area; either an underpriced asset or a hidden risk that comps aren't pricing in. Stress-test before assuming the spread holds.
Location & tenants
- Location reads 63/100 on livability (#194 in OK) — a middle-class / working-renter tenant base. Strengths: cost of living A+, housing A+; Watch: employment D+, crime F, amenities F.
- Kingfisher (town): math 34% / reading 41% proficiency, ranked #23 of 270 in OK (top 8%) — families likely to look elsewhere, expect single-tenant / working-renter base with shorter leases.
- Zoned schools: Gilmour Es (267 students, 0% FRL); Kingfisher Ms (math 30% / reading 42%); Kingfisher Hs (math 27% / reading 27%, grade F, #125 of 447 statewide, top 31%, 386 students, 0% FRL) — zoned schools average 0% FRL vs 43% district-wide (43 pts lower); this property's tenant base skews higher-income than the district average.
- Market conditions: 83 active listings in the ZIP; 1 comparable units currently listed for rent nearby; 39 units permitted in Kingfisher County in 2024 (0 in 5+ unit buildings).
Forward outlook
- Local home prices are declining (-3.0%/yr); year-one equity from $1k of loan paydown is wiped out by about $5k of value loss. Plan a longer hold.
- Kingfisher County population projected at +17% by 2050 — long-run rental-demand tailwind backs the buy-and-hold thesis.
Negotiation context
- Only 7 days on market — expect competitive offers; lowballing is unlikely to land.
- Current owner paid $52k; list at $155k implies a 201% gain — meaningful room to come down on a strong offer.
Risks & watch-outs
- Climate carrying-cost: extreme-heat days projected 7→19/yr by 2055 (HVAC capex compounding) — expect insurance premiums to compound above CPI over the hold.
Questions for the listing agent
- Built in 1961 — when were the roof, HVAC, electrical panel, plumbing, and water heater last replaced?
- Is there a deadline driving the sale (1031 exchange, divorce, estate, relocation)? That informs how much negotiation room exists.
- Crime grade is F in this area — have there been break-ins, vandalism, or insurance claims at this property in the last 3 years? What carrier currently insures it and at what premium?
- The area grade is low — what's the realistic commute time and amenity access for the typical tenant pool here? Any planned neighborhood developments (good or bad) we should know about?
- What's the average days-on-market for RENTAL listings here right now (not sales)? A rising rental-DOM trend means longer vacancies and softer asking-rent achievability than the comps imply.
- What's the recent tenant-quality profile in this submarket — average credit score on applications, eviction rate, late-payment / NSF rate, and stable-employment percentage? A property-management company in the area should have these aggregated.
- How much new for-sale + rental construction is in the pipeline within 1–3 miles? Heavy new supply typically softens prices + rents 12–24 months out; constrained supply supports both.
Investment metrics
- 1% rule
- 0.84% ✗
- Cap rate
- 6.96%
- Cash-on-cash
- 2.38%
- DSCR
- 1.11
- GRM
- 9.9
CMA / ARV
- ARV (on-the-fly)
- $162,964
- Comps found
- 12
Show comp detail 12 sales within ~0.75 mi
| Address | Dist | Beds/Ba | Sqft | Sold | Price | $/sf | Match |
|---|---|---|---|---|---|---|---|
| 1308 S 11th St | 0.05mi | 3/1.0 | 1,225 (-2%) | 15mo | $140,000 | $114 | 83 |
| 1207 Regency Ct | 0.19mi | 2/2.0 (-1) | 1,273 (+2%) | 10mo | $190,000 | $149 | 70 |
| 1102 S 9th St | 0.26mi | 4/1.0 (+1) | 1,340 (+8%) | 1mo | $163,000 | $122 | 69 |
| 1303 S 10th St | 0.07mi | 3/2.0 | 1,419 (+14%) | 5mo | $205,000 | $144 | 65 |
| 910 S 10th St | 0.38mi | 3/2.0 | 1,152 (-7%) | 2mo | $161,500 | $140 | 64 |
| 1302 S 12th St | 0.09mi | 3/1.5 | 1,065 (-14%) | 11mo | $141,500 | $133 | 61 |
| 1105 S 9th St | 0.26mi | 3/1.0 | 1,380 (+11%) | 12mo | $159,990 | $116 | 60 |
| 723 S 9th St | 0.51mi | 2/1.0 (-1) | 1,147 (-8%) | 7mo | $135,000 | $118 | 53 |
| 702 W Fay Ave | 0.44mi | 3/1.0 | 1,107 (-11%) | 13mo | $160,000 | $145 | 51 |
| 115 W Thompson Dr | 0.31mi | 3/2.0 | 1,412 (+14%) | 12mo | $178,000 | $126 | 50 |
| 1123 S 7th St | 0.34mi | 3/2.5 | 1,372 (+10%) | 17mo | $180,000 | $131 | 47 |
| 602 W Oklahoma Ave | 0.50mi | 3/2.0 | 1,419 (+14%) | 4mo | $185,000 | $130 | 46 |
Match score weights: distance 35% · size 25% · config 20% · recency 20%. Top-matched comps best support the ARV.
Projected returns pro-forma
-3.0% appreciation · 3.0% rent growth · sell at horizon
- IRR
- -12.6%
- Equity multiple
- 0.55×
- Total profit
- $-19,705
- Equity at exit
- $23,111
- IRR
- -3.6%
- Equity multiple
- 0.76×
- Total profit
- $-10,358
- Equity at exit
- $13,402
Cash invested: $43,400 (down + closing). Projections, not guarantees.
Landlord ↔ Tenant lean methodology
- Overall (STATE)
- 83 Strongly Landlord-Friendly
- State Oklahoma
- 83 Strongly Landlord-Friendly · R+20
- County
- — inherits STATE
- City
- — inherits STATE
ZIP-level market 73750
- Home prices YoY
- -8.3%
- Active inventory
- 83
- Price-to-rent
- 9.9×
Monthly cashflow live
- Estimated rent
- $1,300 medium interval (Pro) →
- Mortgage (P&I)
- −$813
- Tax from tax record
- −$64 /mo · $764/yr
- Insurance
- −$65
- HOA
- −$0
- Vacancy / Maint / Mgmt
- −$273
- Net cashflow
- $86
Break-even live
Sensitivity live
| Price | -10% $174 | -5% $130 | +0% $86 | +5% $42 | +10% $-2 |
|---|---|---|---|---|---|
| Rent | -10% $-17 | -5% $35 | +0% $86 | +5% $137 | +10% $189 |
| Rate | -1.0pp $164 | -0.5pp $125 | base $86 | +0.5pp $46 | +1.0pp $5 |
UW: 25.0% down · 7.5% · 30yr · 1.5% tax · 5.0% vac · 8.0% maint · 8.0% mgmt
Financing live
Cash to close
- Down payment
- $38,750
- Closing costs
- $4,650
- Reserves months
- —
- Total cash needed
- —
Loan-product check · same deal, 3 products live
Conventional
25% down · 7.5% · 30yr
- Down + closing
- —
- Monthly P&I
- —
- Monthly cashflow
- —
- DSCR
- —
- Eligible?
- —
Personal DTI + credit; lowest rate.
DSCR
20% down · 8.5% · 30yr
- Down + closing
- —
- Monthly P&I
- —
- Monthly cashflow
- —
- DSCR
- —
- Eligible?
- —
No personal income docs; deal must DSCR.
Hard money
10% down · 12.0% · 12mo
- Down + closing
- —
- Monthly P&I
- —
- Monthly cashflow
- —
- DSCR
- —
- Eligible?
- —
Short-term bridge; refi at stabilization.
Rent comps 1 comps
| Address | Beds | Baths | Sqft | Rent | $/sqft | DOM | Units | Dist |
|---|---|---|---|---|---|---|---|---|
| 904 S 13th St Kingfisher, OK | 3.0 | 2.0 | 1427 | $1,300 | $0.91 | 21d | 1 | 0.40mi |
Listing history 4 events
-
2026-04-14status Pending
-
2026-04-06$155,000 Active
-
2000-05-19soldstatus $51,500
-
1993-05-14soldstatus $21,500
ⓘ Source: listings_history table (triggers on properties + properties_extension) + one-shot
backfill from property_details.listing_events for pre-trigger history.
Tax reassessment forecast OK · Resets to sale price
- Current annual tax
- $764 · $64/mo
- Projected year-2 tax
- $1,395 · $116/mo
- Expected delta
- +$631/yr (+$53/mo · 82.6%)
ⓘ Screening estimate from a state-policy table — verify with the county assessor before closing.
Climate risk First Street
- Flood 1/10 Low FEMA zone X (unshaded) · 0% chance over 30 yrs
- Wildfire 2/10 Low
- Heat 6/10 Major 7 d/yr ≥108°F today · 19 d/yr by 30 yrs out
- Wind 2/10 Low 2% chance of damaging wind over 30 yrs
- Air quality 1/10 Low 0 unhealthy d/yr today · 0 by 30 yrs out
Nearby sold comps map
Loading sold comps map…
Walkable amenities ~0.75 mi
Loading nearby amenities…
Taxation est. · year 1
- Rental income
- $15,600
- − Mortgage interest
- −$8,682
- − Property taxes
- −$764
- − Insurance
- −$775
- − Repairs & maintenance
- −$1,248
- − Management
- −$1,248
- − Depreciation
- −$4,509
- Taxable loss
- −$1,627
- Est. tax savings @ 24.0%
- +$390
- After-tax cash flow
- $1,421/yr
For passive investors: Depreciation is non-cash, so a rental often shows a tax loss while cash-flowing — sheltering income. Rental losses are passive: they offset passive income freely, and up to $25,000/yr can offset ordinary (W-2) income if you actively participate and your MAGI is under $100k (phasing out to $0 by $150k); unused losses carry forward. On sale, claimed depreciation is recaptured at up to 25%, and gains may owe capital-gains tax (a 1031 exchange can defer both). Figures are a year-1 estimate at your 24.0% rate — not tax advice; consult a CPA.
Schools (NCES district)
- District
- Kingfisher
- NCES district ID
- 4016560
- Math proficiency
- 34% ▼ -8.00%
- Reading proficiency
- 41% ▼ -6.00%
- Median HH income
- $55,259
- Composite
- 32.9/100
- National rank
- #5605
- State rank
- #23 of 270 in OK
Livability — Kingfisher
- Score
- 63/100
- State rank
- #194
- US rank
- #14896
Category grades
Schools grade is shown separately in the Schools card above.
Census & demographics
- Census place
- Kingfisher, OK
- City population
- 7,078
- Population (ZIP)
- 7,078
Population outlook (Kingfisher County) Hauer SSP2
- Today (2025)
- 16,635 people
- By 2030
- 17,167 · +3.2%
- By 2040
- 18,317 · +10.1%
- By 2050
- 19,454 · +16.9%
- By 2075
- 23,115 · +39.0%
- By 2100
- 25,758 · +54.8%
Race, ethnicity, and origin ACS 2023
- Neighborhood character
- Predominantly White (75%)
- Race & ethnicity
- White 75% Hispanic / Latino 14% Two or more races 10% Native American 2% Asian 1%
- Hispanic origin (detail)
- Mexican 13%
- Common ancestry
- Lithuanian 2% Serbian 2% Slovak 1%
- Foreign-born
- 6% · Canada, China
- Languages at home
- 88% English-only · Spanish 9% Other Indo-European 1% Chinese 1%
Political lean MEDSL · Kingfisher
- 2024 margin
- Solid R (+71.4) · D 13.7% · R 85.1% · Other 1.3%
- 2008→2024 swing
- -3.0pp toward R · 2008: -68.4pp · 2024: -71.4pp
- All cycles
- 2024: R+71.4 2020: R+72.2 2016: R+71.3 2012: R+68.5 2008: R+68.4
Not yet ingested
- Civics
- —
Market trends
- HPI YoY
- ▼ -26.01%
- Current HPI
- 286.0195
- Rent YoY
- —
- Metro
- —
- State GDP YoY
- ▲ 1.55%
- F500 in state
- 6
Industry mix (Fortune 500 HQ in OK)
| Industry | F500 HQs | Revenue |
|---|---|---|
| Energy | 3 | $48B |
|
||
Price history
+620.9% since first listed4 events — show timeline
- 2026-04-14 Pending — MLSOK
- 2026-04-06 Listed $155,000 MLSOK
- 2000-05-19 Sold (Public Records) $51,500 Public Records
- 1993-05-14 Sold (Public Records) $21,500 Public Records
Property tax history
+4.3%/yrLatest (2025): $764 · +20.5% YoY. Source: county tax records.
Cash-flow waterfall
monthlySold comps — $/sqft
last 12 mo · ≤1 miLoading sold comps…