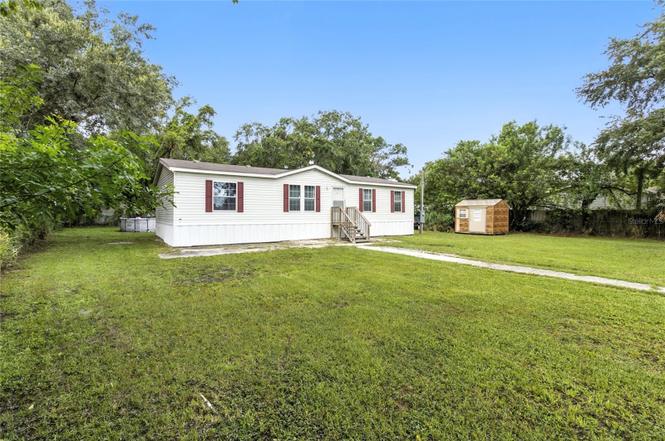
41 Norman Ln · Auburndale, FL
Flood risk 1/10 · Minimal
- FEMA flood zone
- X (unshaded)
- Chance of flooding over 30 yrs
- 0.0%
- Est. flood insurance / yr
- $507 – $1,088
Fire risk 3/10 · Minor
- Est. fire insurance / yr
- $947 – $1,759
Heat risk 8/10 · Major
- Hot days now (above 107°F)
- 7 days/yr
- Hot days in 30 yrs
- 22 days/yr
Wind risk 9/10 · Severe
- Chance of severe wind over 30 yrs
- 99.0%
Air-quality risk 2/10 · Minimal
- Unhealthy air days now
- 0 days/yr
- Unhealthy air days in 30 yrs
- 1 days/yr
Risk factors via First Street. Map © Google.
Why this score? — see what drove the D grade
The composite is a weighted blend of 9 inputs, each scored 0–100. Each bar is that input's sub-score; the figure is the points it added to the 100-point composite (weight × sub-score).
- Cash flow +12.5/30.0
- ARV discount +7.5/15.0
- Livability +4.2/5.0
- DSCR +3.7/10.0
- Schools +3.5/10.0
- 1% rule +3.3/10.0
- Rent growth +3.3/5.0
- Condition / age +2.5/5.0
- Appreciation +0.0/10.0
$240,000
🖨 Deal sheet (PDF) 📄 Offer letter ✓ Due diligence
Listing remarks MLS
No Restrictions, No Outlet County Road and READY for your mobile home. This lot has been occupied with a mobile home and a travel trailer. Close to downtown and less than 2 miles to the Super Walmart and multiple restaurants. A great income potential lot. Fenced with improvements.
Key facts
- 0.39 acre lot
- Pool
- Built 2022
Tags
Property features AI
Finance
- Other: Total living area approximately 1,404 square feet; Lot size about 0.39 acres (0.25–0.5 acre range)
Exterior
- Parking: Directions: HWY 92 West to Norman Lane, home on the right near end of road
- Utilities: Public water; Septic tank sewer; Cable available; Electricity connected; Water connected
- Home design: Manufactured double-wide home; One story; Faces east
- Construction: Metal frame construction; Shingle roof; Built on a crawlspace
- Exterior features: French doors; Sliding doors; Chain link fencing; Above-ground private pool; Asphalt road access
Interior
- Kitchen: Dishwasher; Garbage disposal; Microwave; Range; Refrigerator; Electric water heater
- Bedrooms: 3 bedrooms
- Flooring: Laminate; Crawlspace foundation
- Bathrooms: 2 full bathrooms
- Heating & cooling: Central heat; Electric heat; Heat pump; Central air conditioning
- Interior features: High ceilings; Open floorplan; Living room and dining room combo; Split bedroom layout; Den / library / office
- Laundry & utility: Laundry inside in a closet
Neighborhood map
What this means for you Summary
Snapshot
- This is a 3-bed/2.0-bath manufactured listed at $240k.
Deal economics
- At list price, monthly cash flow is $-37 ($-441/yr) — negative.
- To cash-flow at today's rent, offer at most $234k (2.7% below list).
- To meet the 1% rule (rent ≥ 1% of price), the offer needs to be $198k (17.3% below list).
- Recommended offer: $198k (17.3% below list) — sets the bar for 1% rule.
Location & tenants
- Location reads 83/100 on livability (#48 in FL, #905 nationally) — a professional / high-income tenant draw. Strengths: cost of living A+, housing A+, health & safety A+; Watch: amenities C-, commute C-.
- Polk (suburban): math 39% / reading 43% proficiency, ranked #62 of 73 in FL (top 85%) — families likely to look elsewhere, expect single-tenant / working-renter base with shorter leases.
- Zoned schools: Jewett School of The Arts (math 43% / reading 47%, grade D-, #1,271 of 2,144 statewide, top 60%, 679 students, 48% FRL); Jere L. Stambaugh Middle (math 23% / reading 26%, grade F, #522 of 571 statewide, top 93%, 1,127 students, 65% FRL); Auburndale Senior High School (math 25% / reading 31%, grade F, #464 of 667 statewide, top 70%, 1,716 students, 53% FRL) — zoned schools at 55% FRL track the district average.
- Market conditions: Rents rising (+3.2%/yr); 483 active listings in the ZIP; 2 comparable units currently listed for rent nearby; 10,384 units permitted in Polk County in 2024 (1,716 in 5+ unit buildings).
- This rent runs 33% of the median local income ($71k/yr) — at the standard rent-burdened threshold; future hikes will face affordability resistance.
Forward outlook
- Local home prices are declining (-3.0%/yr); year-one equity from $2k of loan paydown is wiped out by about $7k of value loss. Plan a longer hold.
- Polk County population projected at +33% by 2050 — long-run rental-demand tailwind backs the buy-and-hold thesis.
Negotiation context
- It's been on market 318 days — a 12% lower offer ($211k) is reasonable based on typical stale-listing flexibility.
- 8 sale attempts since 26y ago; this cycle's ask has dropped $30k (11%) from the opening price — seller is motivated, your offer sets the floor, not the list.
- Current owner paid $35k; list at $240k implies a 586% gain — meaningful room to come down on a strong offer.
Risks & watch-outs
- Climate carrying-cost: severe wind risk, 99% chance of damaging wind over 30y; extreme-heat days projected 7→22/yr by 2055 (HVAC capex compounding) — expect insurance premiums to compound above CPI over the hold.
Questions for the listing agent
- What do current leases actually rent for vs. the listed asking? Can we see a recent rent roll and the last 12 months of T-12 income?
- It's been on market 318 days. Have you received any prior offers? Is the seller open to a 17% concession, seller financing, or rate buy-down credit?
- Why hasn't it sold? Are there any deal-killer items the seller is aware of (foundation, flood, title, zoning, code violations)?
- Is there a deadline driving the sale (1031 exchange, divorce, estate, relocation)? That informs how much negotiation room exists.
- The area grade is low — what's the realistic commute time and amenity access for the typical tenant pool here? Any planned neighborhood developments (good or bad) we should know about?
- What's the average days-on-market for RENTAL listings here right now (not sales)? A rising rental-DOM trend means longer vacancies and softer asking-rent achievability than the comps imply.
- What's the recent tenant-quality profile in this submarket — average credit score on applications, eviction rate, late-payment / NSF rate, and stable-employment percentage? A property-management company in the area should have these aggregated.
- How much new for-sale + rental construction is in the pipeline within 1–3 miles? Heavy new supply typically softens prices + rents 12–24 months out; constrained supply supports both.
Investment metrics
- 1% rule
- 0.83% ✗
- Cap rate
- 6.11%
- Cash-on-cash
- -0.66%
- DSCR
- 0.97
- GRM
- 10.1
CMA / ARV
No comps found within radius.
Projected returns pro-forma
-3.0% appreciation · 3.18% rent growth · sell at horizon
- IRR
- -17.2%
- Equity multiple
- 0.39×
- Total profit
- $-40,875
- Equity at exit
- $35,785
- IRR
- -8.8%
- Equity multiple
- 0.45×
- Total profit
- $-37,140
- Equity at exit
- $20,751
Cash invested: $67,200 (down + closing). Projections, not guarantees.
Landlord ↔ Tenant lean methodology
- Overall (STATE)
- 87 Strongly Landlord-Friendly
- State Florida
- 87 Strongly Landlord-Friendly · R+3
- County
- — inherits STATE
- City
- — inherits STATE
ZIP-level market 33823
- Home prices YoY
- -24.5%
- Rents YoY
- 3.2%
- Active inventory
- 483
- Price-to-rent
- 10.1×
Monthly cashflow live
- Estimated rent
- $1,984 medium interval (Pro) →
- Mortgage (P&I)
- −$1,259
- Tax from tax record
- −$246 /mo · $2,948/yr
- Insurance
- −$100
- HOA
- −$0
- Vacancy / Maint / Mgmt
- −$417
- Net cashflow
- $-37
Break-even live
Sensitivity live
| Price | -10% $99 | -5% $31 | +0% $-37 | +5% $-105 | +10% $-173 |
|---|---|---|---|---|---|
| Rent | -10% $-194 | -5% $-115 | +0% $-37 | +5% $42 | +10% $120 |
| Rate | -1.0pp $84 | -0.5pp $24 | base $-37 | +0.5pp $-99 | +1.0pp $-162 |
UW: 25.0% down · 7.5% · 30yr · 1.5% tax · 5.0% vac · 8.0% maint · 8.0% mgmt
Financing live
Cash to close
- Down payment
- $60,000
- Closing costs
- $7,200
- Reserves months
- —
- Total cash needed
- —
Loan-product check · same deal, 3 products live
Conventional
25% down · 7.5% · 30yr
- Down + closing
- —
- Monthly P&I
- —
- Monthly cashflow
- —
- DSCR
- —
- Eligible?
- —
Personal DTI + credit; lowest rate.
DSCR
20% down · 8.5% · 30yr
- Down + closing
- —
- Monthly P&I
- —
- Monthly cashflow
- —
- DSCR
- —
- Eligible?
- —
No personal income docs; deal must DSCR.
Hard money
10% down · 12.0% · 12mo
- Down + closing
- —
- Monthly P&I
- —
- Monthly cashflow
- —
- DSCR
- —
- Eligible?
- —
Short-term bridge; refi at stabilization.
Rent comps 2 comps
| Address | Beds | Baths | Sqft | Rent | $/sqft | DOM | Units | Dist |
|---|---|---|---|---|---|---|---|---|
| 4 Sandy Ln Auburndale, FL | 3.0 | 2.0 | 954 | $1,620 | $1.70 | 25d | 1 | 0.52mi |
| 651 Duncan Cir W Auburndale, FL | 3.0 | 1.0 | 1130 | $1,595 | $1.41 | 25d | 1 | 0.96mi |
Listing history 32 events
-
2026-06-22days on market $240,000 Active 318 DOM
-
2026-06-18days on market $240,000 Active 315 DOM
-
2026-06-17days on market $240,000 Active 314 DOM
-
2026-06-16days on market $240,000 Active 313 DOM
-
2026-06-15days on market $240,000 Active 312 DOM
-
2026-06-13days on market $240,000 Active 310 DOM
-
2026-06-10days on market $240,000 Active 307 DOM
-
2026-06-09days on market $240,000 Active 306 DOM
-
2026-06-08days on market $240,000 Active 305 DOM
-
2026-06-07days on market $240,000 Active 304 DOM
-
2026-06-05days on market $240,000 Active 301 DOM
-
2026-06-03days on market $240,000 Active 299 DOM
-
2026-06-01days on market $240,000 Active 298 DOM
-
2026-05-31days on market $240,000 Active 297 DOM
-
2026-02-26price $240,000
-
2025-10-26price $250,000
-
2025-08-07$270,000 Active
-
2025-03-01historical
-
2024-08-03$350,000 Active
-
2021-03-31soldstatus $35,000
-
2021-03-26soldstatus $35,000 Closed 281-char remark
Show marketing remark (281 chars)
No Restrictions, No Outlet County Road and READY for your mobile home. This lot has been occupied with a mobile home and a travel trailer. Close to downtown and less than 2 miles to the Super Walmart and multiple restaurants. A great income potential lot. Fenced with improvements.
-
2021-03-08status Pending 281-char remark
Show marketing remark (281 chars)
No Restrictions, No Outlet County Road and READY for your mobile home. This lot has been occupied with a mobile home and a travel trailer. Close to downtown and less than 2 miles to the Super Walmart and multiple restaurants. A great income potential lot. Fenced with improvements.
-
2021-02-13$37,500 Active 281-char remark
Show marketing remark (281 chars)
No Restrictions, No Outlet County Road and READY for your mobile home. This lot has been occupied with a mobile home and a travel trailer. Close to downtown and less than 2 miles to the Super Walmart and multiple restaurants. A great income potential lot. Fenced with improvements.
-
2018-11-29historical
-
2018-11-07price $13,900
-
2018-09-28$19,900 Active
-
2007-02-15historical
-
2003-10-07$50,000
-
2000-11-16$15,000
-
2000-08-29$12,500
-
2000-08-29$12,500
-
1990-01-01soldstatus $12,500
ⓘ Source: listings_history table (triggers on properties + properties_extension) + one-shot
backfill from property_details.listing_events for pre-trigger history.
Tax reassessment forecast FL · Resets to sale price
- Current annual tax
- $2,948 · $246/mo
- Projected year-2 tax
- $2,948 · $246/mo
- Expected delta
- $0/yr ($0/mo · 0.0%)
ⓘ Screening estimate from a state-policy table — verify with the county assessor before closing.
Climate risk First Street
- Flood 1/10 Low FEMA zone X (unshaded) · 0% chance over 30 yrs
- Wildfire 3/10 Moderate
- Heat 8/10 Severe 7 d/yr ≥107°F today · 22 d/yr by 30 yrs out
- Wind 9/10 Extreme 99% chance of damaging wind over 30 yrs
- Air quality 2/10 Low 0 unhealthy d/yr today · 1 by 30 yrs out
Nearby sold comps map
Loading sold comps map…
Walkable amenities ~0.75 mi
Loading nearby amenities…
Taxation est. · year 1
- Rental income
- $23,810
- − Mortgage interest
- −$13,444
- − Property taxes
- −$2,948
- − Insurance
- −$1,200
- − Repairs & maintenance
- −$1,905
- − Management
- −$1,905
- − Depreciation
- −$6,982
- Taxable loss
- −$4,573
- Est. tax savings @ 24.0%
- +$1,098
- After-tax cash flow
- $656/yr
For passive investors: Depreciation is non-cash, so a rental often shows a tax loss while cash-flowing — sheltering income. Rental losses are passive: they offset passive income freely, and up to $25,000/yr can offset ordinary (W-2) income if you actively participate and your MAGI is under $100k (phasing out to $0 by $150k); unused losses carry forward. On sale, claimed depreciation is recaptured at up to 25%, and gains may owe capital-gains tax (a 1031 exchange can defer both). Figures are a year-1 estimate at your 24.0% rate — not tax advice; consult a CPA.
Schools (NCES district)
- District
- Polk
- NCES district ID
- 1201590
- Math proficiency
- 39% ▼ -11.00%
- Reading proficiency
- 43% ▼ -4.00%
- Median HH income
- $43,979
- Composite
- 34.74/100
- National rank
- #5132
- State rank
- #62 of 73 in FL
Livability — Auburndale
- Score
- 83/100
- State rank
- #48
- US rank
- #905
Category grades
Schools grade is shown separately in the Schools card above.
Census & demographics
- County
- Polk County · 740,051 people
- City population
- 41,779
- Metro
- Lakeland-Winter Haven, FL
- Population (ZIP)
- 41,779
- Household income
- $71,485
- Rent vs Own
- Severe rent burden
- 821.0
Population outlook (Polk County) Hauer SSP2
- Today (2025)
- 752,975 people
- By 2030
- 804,621 · +6.9%
- By 2040
- 906,117 · +20.3%
- By 2050
- 1,000,476 · +32.9%
- By 2075
- 1,197,520 · +59.0%
- By 2100
- 1,271,518 · +68.9%
Race, ethnicity, and origin ACS 2023
- Neighborhood character
- Predominantly White (65%)
- Race & ethnicity
- White 65% Hispanic / Latino 19% Black 13% Two or more races 6% Asian 2%
- Hispanic origin (detail)
- Mexican 7% Puerto Rican 7% Cuban 1%
- Common ancestry
- Hispanic 3% Lithuanian 2% Romanian 1%
- Foreign-born
- 10% · Canada, Jamaica, Philippines
- Languages at home
- 79% English-only · Spanish 15% French/Haitian/Cajun 3% Other Indo-European 2%
Political lean MEDSL · Polk
- 2024 margin
- Strong R (+20.7) · D 39.2% · R 59.9%
- 2008→2024 swing
- -14.6pp toward R · 2008: -6.1pp · 2024: -20.7pp
- All cycles
- 2024: R+20.7 2020: R+14.4 2016: R+14.1 2012: R+6.8 2008: R+6.1
Not yet ingested
- Civics
- —
Market trends
- HPI YoY
- ▼ -102.70%
- Current HPI
- 316.9436
- Rent YoY
- ▲ 3.18%
- Metro
- Lakeland-Winter Haven, FL
- State GDP YoY
- ▲ 3.28%
- F500 in state
- 36
Industry mix (Fortune 500 HQ in FL)
| Industry | F500 HQs | Revenue |
|---|---|---|
| Industrial Technology | 2 | $29B |
|
||
| Insurance | 2 | $17B |
|
||
| Retail | 1 | $60B |
|
||
| Technology Distribution | 1 | $58B |
|
||
| Homebuilding | 1 | $35B |
|
||
| Technology Manufacturing | 1 | $35B |
|
||
Price history
+1820.0% since first listed18 events — show timeline
- 2026-02-26 Price Changed $240,000 Stellar MLS as Distributed by MLS Grid
- 2025-10-26 Price Changed $250,000 Stellar MLS as Distributed by MLS Grid
- 2025-08-07 Listed $270,000 Stellar MLS as Distributed by MLS Grid
- 2025-03-01 Listing Removed — Stellar MLS as Distributed by MLS Grid
- 2024-08-03 Listed $350,000 Stellar MLS as Distributed by MLS Grid
- 2021-03-31 Sold (Public Records) $35,000 Public Records
- 2021-03-26 Sold (MLS) $35,000 Stellar MLS as Distributed by MLS Grid
- 2021-03-08 Pending — Stellar MLS as Distributed by MLS Grid
- 2021-02-13 Listed $37,500 Stellar MLS as Distributed by MLS Grid
- 2018-11-29 Listing Removed — Stellar MLS as Distributed by MLS Grid
- 2018-11-07 Price Changed $13,900 Stellar MLS as Distributed by MLS Grid
- 2018-09-28 Listed $19,900 Stellar MLS as Distributed by MLS Grid
- 2007-02-15 Listing Removed — Stellar MLS as Distributed by MLS Grid
- 2003-10-07 Listed $50,000 Stellar MLS as Distributed by MLS Grid
- 2000-11-16 Listed $15,000 Stellar MLS as Distributed by MLS Grid
- 2000-08-29 Listed $12,500 Stellar MLS as Distributed by MLS Grid
- 2000-08-29 Listed $12,500 Stellar MLS as Distributed by MLS Grid
- 1990-01-01 Sold (Public Records) $12,500 Public Records
Property tax history
+44.5%/yrLatest (2025): $2,948 · +7.1% YoY. Source: county tax records.
Cash-flow waterfall
monthlySold comps — $/sqft
last 12 mo · ≤1 miLoading sold comps…