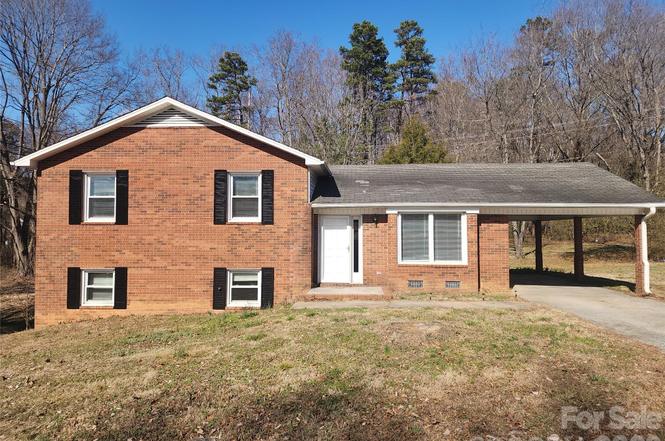
150 Autumn Leaf Rd · Troutman, NC
Flood risk 1/10 · Minimal
- FEMA flood zone
- X (unshaded)
- Chance of flooding over 30 yrs
- 0.0%
- Est. flood insurance / yr
- $507 – $1,088
Fire risk 3/10 · Minor
- Est. fire insurance / yr
- $906 – $1,684
Heat risk 5/10 · Moderate
- Hot days now (above 103°F)
- 7 days/yr
- Hot days in 30 yrs
- 17 days/yr
Wind risk 3/10 · Minor
- Chance of severe wind over 30 yrs
- 6.0%
Air-quality risk 3/10 · Minor
- Unhealthy air days now
- 3 days/yr
- Unhealthy air days in 30 yrs
- 5 days/yr
Risk factors via First Street. Map © Google.
Why this score? — see what drove the C grade
The composite is a weighted blend of 9 inputs, each scored 0–100. Each bar is that input's sub-score; the figure is the points it added to the 100-point composite (weight × sub-score).
- Cash flow +20.7/30.0
- ARV discount +15.0/15.0
- DSCR +6.6/10.0
- Schools +4.5/10.0
- 1% rule +4.4/10.0
- Livability +3.2/5.0
- Rent growth +3.0/5.0
- Condition / age +2.5/5.0
- Appreciation +0.0/10.0
$225,000
🖨 Deal sheet 📄 Offer letter ✓ Due diligence
Listing remarks
You won't want to miss out on this charming home, located on a Large Lot in Troutman, NC. This home sits on a generous 0.72-acre city lot offering 3-bedrooms, 2.5-baths. The home offers the perfect blend of privacy and accessibility. Key Features include Split-Level Floor Plan displaying a great flow and separation of living space. The lower level invites you with a wonderful wood burning fireplace and a side entrance. Updated Flooring & recent Paint make this home move-in ready with a clean, modern feel. There is plenty of room for outdoor living, gardening, pets, or future additions. The layout and lot size make hosting gatherings effortless. With the convenient location. This is th
Key facts
- Large lot
- Updated flooring
- Convenient location
Tags
Property features AI
Finance
- HOA & community: No HOA
Exterior
- Parking: Attached carport (1 space); Driveway
- Utilities: Well water; Septic system
- Home design: Single-family residential property; Site-built construction; Split-level home
- Construction: Brick partial exterior; Composition roof; Slab and other foundation
- Exterior features: Walk-out basement access; Publicly maintained roads with concrete, dirt and paved surfaces
Interior
- Kitchen: Dishwasher; Refrigerator
- Bedrooms: Three bedrooms on the upper level
- Bathrooms: Two full bathrooms; One half bathroom on the lower level
- Heating & cooling: Forced air heating (natural gas); Central air conditioning
- Interior features: Fireplace in the family room; Split-level floor plan; One additional room (room count: 1)
- Laundry & utility: Washer hookup; Electric dryer hookup; Laundry located on the third level
Neighborhood map
What this means for you Summary
Snapshot
- This is a 3-bed/2.0-bath single-family listed at $225k.
Deal economics
- At list price, monthly cash flow is $303 ($4k/yr) — positive.
- The deal already cash-flows at list — no discount required.
- To meet the 1% rule (rent ≥ 1% of price), the offer needs to be $212k (5.8% below list).
- Recommended offer: $212k (5.8% below list) — sets the bar for 1% rule.
- Cap rate 7.9% vs local median 3.2% in Troutman — top-decile yield for the area; either an underpriced asset or a hidden risk that comps aren't pricing in. Stress-test before assuming the spread holds.
Location & tenants
- Location reads 64/100 on livability (#342 in NC) — a middle-class / working-renter tenant base. Strengths: housing A+, cost of living A-; Watch: schools F, amenities F, commute F.
- Iredell-Statesville Schools (rural): math 53% / reading 52% proficiency, ranked #51 of 178 in NC (top 29%) — acceptable for families but not a draw, mixed tenant base, ~2y average lease.
- Market conditions: Rents rising (+2.1%/yr); 249 active listings in the ZIP; 6 comparable units currently listed for rent nearby; rentals at typical pace (median 24d on market — plan ~3-4 weeks tenant-placement turnaround); solid renter incomes; 1,955 units permitted in Iredell County in 2024 (128 in 5+ unit buildings).
Forward outlook
- Local home prices are declining (-3.0%/yr); year-one equity from $2k of loan paydown is wiped out by about $7k of value loss. Plan a longer hold.
- Iredell County population projected at +26% by 2050 — long-run rental-demand tailwind backs the buy-and-hold thesis.
Negotiation context
- It's been on market 36 days — a 3% lower offer ($218k) is reasonable based on typical stale-listing flexibility.
- 3 sale attempts; this cycle's ask has dropped $58k (20%) from the opening price — seller is motivated, your offer sets the floor, not the list.
- Current owner paid $70k; list at $225k implies a 221% gain — meaningful room to come down on a strong offer.
Risks & watch-outs
- Climate carrying-cost: extreme-heat days projected 7→17/yr by 2055 (HVAC capex compounding) — expect insurance premiums to compound above CPI over the hold.
Questions for the listing agent
- It's been on market 36 days. Have you received any prior offers? Is the seller open to a 6% concession, seller financing, or rate buy-down credit?
- Built in 1979 — when were the roof, HVAC, electrical panel, plumbing, and water heater last replaced?
- Is there a deadline driving the sale (1031 exchange, divorce, estate, relocation)? That informs how much negotiation room exists.
- Schools are F-rated, which usually means shorter tenancies and higher turnover. Who's the typical renter profile here, and what's been the actual vacancy rate?
- What's the average days-on-market for RENTAL listings here right now (not sales)? A rising rental-DOM trend means longer vacancies and softer asking-rent achievability than the comps imply.
- What's the recent tenant-quality profile in this submarket — average credit score on applications, eviction rate, late-payment / NSF rate, and stable-employment percentage? A property-management company in the area should have these aggregated.
- How much new for-sale + rental construction is in the pipeline within 1–3 miles? Heavy new supply typically softens prices + rents 12–24 months out; constrained supply supports both.
Investment metrics
- 1% rule
- 0.94% ✗
- Cap rate
- 7.91%
- Cash-on-cash
- 5.78%
- DSCR
- 1.26
- GRM
- 8.8
CMA / ARV
- ARV (on-the-fly)
- $341,760
- Comps found
- 12
Show comp detail 12 sales within ~0.75 mi
| Address | Dist | Beds/Ba | Sqft | Sold | Price | $/sf | Match |
|---|---|---|---|---|---|---|---|
| 104 Trellis Ln | 0.25mi | 3/2.5 | 2,100 (+9%) | 0mo | $395,000 | $188 | 70 |
| 521 Cedar St | 0.35mi | 3/2.0 | 1,714 (-11%) | 1mo | $365,000 | $213 | 65 |
| 157 Byers Rd | 0.46mi | 3/2.0 | 1,733 (-10%) | 3mo | $375,000 | $216 | 60 |
| 220 Astor St | 0.67mi | 4/2.5 (+1) | 1,955 (+2%) | 2mo | $345,000 | $176 | 57 |
| 218 Astor St | 0.68mi | 4/2.5 (+1) | 1,956 (+2%) | 2mo | $349,999 | $179 | 57 |
| 234 Cassius Dr #82 | 0.66mi | 4/2.5 (+1) | 1,956 (+2%) | 4mo | $320,000 | $164 | 56 |
| 228 Cassius Dr | 0.67mi | 4/2.5 (+1) | 1,956 (+2%) | 3mo | $307,000 | $157 | 56 |
| 165 Astor St | 0.74mi | 4/2.5 (+1) | 1,955 (+2%) | 1mo | $348,000 | $178 | 55 |
| 203 Cassius Dr | 0.73mi | 4/2.5 (+1) | 1,956 (+2%) | 2mo | $339,999 | $174 | 54 |
| 208 Cassius Dr | 0.72mi | 4/2.5 (+1) | 1,956 (+2%) | 5mo | $341,000 | $174 | 52 |
| 109 Dorian Pl | 0.71mi | 3/2.5 | 1,665 (-13%) | 1mo | $300,000 | $180 | 42 |
| 206 Calvin Creek Dr | 0.69mi | 4/2.5 (+1) | 2,175 (+13%) | 3mo | $344,000 | $158 | 36 |
Match score weights: distance 35% · size 25% · config 20% · recency 20%. Top-matched comps best support the ARV.
Projected returns pro-forma
-3.0% appreciation · 2.13% rent growth · sell at horizon
- IRR
- -8.3%
- Equity multiple
- 0.70×
- Total profit
- $-19,061
- Equity at exit
- $33,548
- IRR
- 0.1%
- Equity multiple
- 1.01×
- Total profit
- $532
- Equity at exit
- $19,454
Cash invested: $63,000 (down + closing). Projections, not guarantees.
Landlord ↔ Tenant lean methodology
- Overall (STATE)
- 85 Strongly Landlord-Friendly
- State North Carolina
- 85 Strongly Landlord-Friendly · R+3
- County
- — inherits STATE
- City
- — inherits STATE
ZIP-level market 28166
- Home prices YoY
- -23.7%
- Rents YoY
- 2.1%
- Active inventory
- 249
- Price-to-rent
- 8.8×
Monthly cashflow live
- Estimated rent
- $2,119 high interval (Pro) →
- Mortgage (P&I)
- −$1,180
- Tax from tax record
- −$97 /mo · $1,165/yr
- Insurance
- −$94
- HOA
- −$0
- Vacancy / Maint / Mgmt
- −$445
- Net cashflow
- $303
Break-even live
UW: 25.0% down · 7.5% · 30yr · 1.5% tax · 5.0% vac · 8.0% maint · 8.0% mgmt
Financing live
Cash to close
- Down payment
- $56,250
- Closing costs
- $6,750
- Reserves months
- —
- Total cash needed
- —
Loan-product check · same deal, 3 products live
Conventional
25% down · 7.5% · 30yr
- Down + closing
- —
- Monthly P&I
- —
- Monthly cashflow
- —
- DSCR
- —
- Eligible?
- —
Personal DTI + credit; lowest rate.
DSCR
20% down · 8.5% · 30yr
- Down + closing
- —
- Monthly P&I
- —
- Monthly cashflow
- —
- DSCR
- —
- Eligible?
- —
No personal income docs; deal must DSCR.
Hard money
10% down · 12.0% · 12mo
- Down + closing
- —
- Monthly P&I
- —
- Monthly cashflow
- —
- DSCR
- —
- Eligible?
- —
Short-term bridge; refi at stabilization.
Rent comps 6 comps
| Address | Beds | Baths | Sqft | Rent | $/sqft | DOM | Units | Dist |
|---|---|---|---|---|---|---|---|---|
| 260 Klutz St Troutman, NC | 4.0 | 2.0 | 1553 | $1,750 | $1.13 | 24d | 1 | 0.90mi |
| 248 Mills Ave Troutman, NC | 4.0 | 3.0 | 2134 | $2,350 | $1.10 | 24d | 1 | 1.03mi |
| 152 Talley St Unit NA Troutman, NC | 3.0 | 2.0 | 1603 | $1,750 | $1.09 | 24d | 1 | 1.16mi |
| 152 Talley St Troutman, NC | 3.0 | 2.0 | 1603 | $1,750 | $1.09 | 12d | 1 | 1.16mi |
| 145 Macel Dr Troutman, NC | 2.0 | 2.0 | 1318 | $1,976 | $1.50 | 2d | 6 | 1.26mi |
| 151 Scotsman Dr Troutman, NC | 3.0 | 2.0 | 1720 | $2,200 | $1.28 | 18d | 1 | 1.40mi |
Listing history 5 events
-
2026-05-23status Active
-
2026-05-23price $225,000
-
2026-04-13status Active
-
2026-03-04$283,000 Active
-
1993-02-01soldstatus $70,000
ⓘ Source: listings_history table (triggers on properties + properties_extension) + one-shot
backfill from property_details.listing_events for pre-trigger history.
Tax reassessment forecast NC · Resets to sale price
- Current annual tax
- $1,165 · $97/mo
- Projected year-2 tax
- $1,845 · $154/mo
- Expected delta
- +$680/yr (+$57/mo · 58.4%)
ⓘ Screening estimate from a state-policy table — verify with the county assessor before closing.
Climate risk First Street
- Flood 1/10 Low FEMA zone X (unshaded) · 0% chance over 30 yrs
- Wildfire 3/10 Moderate
- Heat 5/10 Major 7 d/yr ≥103°F today · 17 d/yr by 30 yrs out
- Wind 3/10 Moderate 6% chance of damaging wind over 30 yrs
- Air quality 3/10 Moderate 3 unhealthy d/yr today · 5 by 30 yrs out
Nearby sold comps map
Loading sold comps map…
Walkable amenities ~0.75 mi
Loading nearby amenities…
Taxation est. · year 1
- Rental income
- $25,429
- − Mortgage interest
- −$12,603
- − Property taxes
- −$1,165
- − Insurance
- −$1,125
- − Repairs & maintenance
- −$2,034
- − Management
- −$2,034
- − Depreciation
- −$6,545
- Taxable loss
- −$79
- Est. tax savings @ 24.0%
- +$19
- After-tax cash flow
- $3,659/yr
For passive investors: Depreciation is non-cash, so a rental often shows a tax loss while cash-flowing — sheltering income. Rental losses are passive: they offset passive income freely, and up to $25,000/yr can offset ordinary (W-2) income if you actively participate and your MAGI is under $100k (phasing out to $0 by $150k); unused losses carry forward. On sale, claimed depreciation is recaptured at up to 25%, and gains may owe capital-gains tax (a 1031 exchange can defer both). Figures are a year-1 estimate at your 24.0% rate — not tax advice; consult a CPA.
Schools (NCES district)
- District
- Iredell-Statesville Schools
- NCES district ID
- 3702310
- Math proficiency
- 53% ▲ 8.00%
- Reading proficiency
- 52% ▲ 4.00%
- Median HH income
- $51,201
- Composite
- 44.98/100
- National rank
- #2703
- State rank
- #51 of 178 in NC
Livability — Troutman
- Score
- 64/100
- State rank
- #342
- US rank
- #13725
Category grades
Schools grade is shown separately in the Schools card above.
Census & demographics
- County
- Iredell County · 182,638 people
- City population
- 11,875
- Metro
- Charlotte-Concord-Gastonia, NC-SC
- Population (ZIP)
- 11,875
- Household income
- $93,511
- Rent vs Own
- Severe rent burden
- 167.0
Population outlook (Iredell County) Hauer SSP2
- Today (2025)
- 194,510 people
- By 2030
- 206,171 · +6.0%
- By 2040
- 227,781 · +17.1%
- By 2050
- 245,102 · +26.0%
- By 2075
- 280,896 · +44.4%
- By 2100
- 294,375 · +51.3%
Race, ethnicity, and origin ACS 2023
- Neighborhood character
- Predominantly White (76%)
- Race & ethnicity
- White 76% Black 15% Hispanic / Latino 6% Two or more races 4% Asian 1%
- Hispanic origin (detail)
- Mexican 3% Puerto Rican 1%
- Common ancestry
- Serbian 2% Italian 2% Slovak 2%
- Foreign-born
- 3% · Canada
- Languages at home
- 96% English-only · Spanish 3% Other Asian/Pacific 1%
Political lean MEDSL · Iredell
- 2024 margin
- Solid R (+32.6) · D 33.2% · R 65.8%
- 2008→2024 swing
- -8.2pp toward R · 2008: -24.4pp · 2024: -32.6pp
- All cycles
- 2024: R+32.6 2020: R+32.4 2016: R+36.8 2012: R+30.5 2008: R+24.4
Not yet ingested
- Civics
- —
Market trends
- HPI YoY
- ▼ -71.32%
- Current HPI
- 229.5993
- Rent YoY
- ▲ 2.13%
- Metro
- Charlotte-Concord-Gastonia, NC-SC
- State GDP YoY
- ▲ 3.28%
- F500 in state
- 26
Industry mix (Fortune 500 HQ in NC)
| Industry | F500 HQs | Revenue |
|---|---|---|
| Financial Services | 2 | $213B |
|
||
| Retail | 2 | $95B |
|
||
| Industrial Conglomerate | 1 | $38B |
|
||
| Metals / Steel | 1 | $35B |
|
||
| Utilities | 1 | $30B |
|
||
| Industrial Machinery | 1 | $19B |
|
||
Price history
+221.4% since first listed5 events — show timeline
- 2026-05-23 Relisted — CANOPYMLS as Distributed by MLS Grid
- 2026-05-23 Price Changed $225,000 CANOPYMLS as Distributed by MLS Grid
- 2026-04-13 Relisted — CANOPYMLS as Distributed by MLS Grid
- 2026-03-04 Listed $283,000 CANOPYMLS as Distributed by MLS Grid
- 1993-02-01 Sold (Public Records) $70,000 Public Records
Property tax history
+4.4%/yrLatest (2025): $1,165 · +0.0% YoY. Source: county tax records.
Cash-flow waterfall
monthlySold comps — $/sqft
last 12 mo · ≤1 miLoading sold comps…