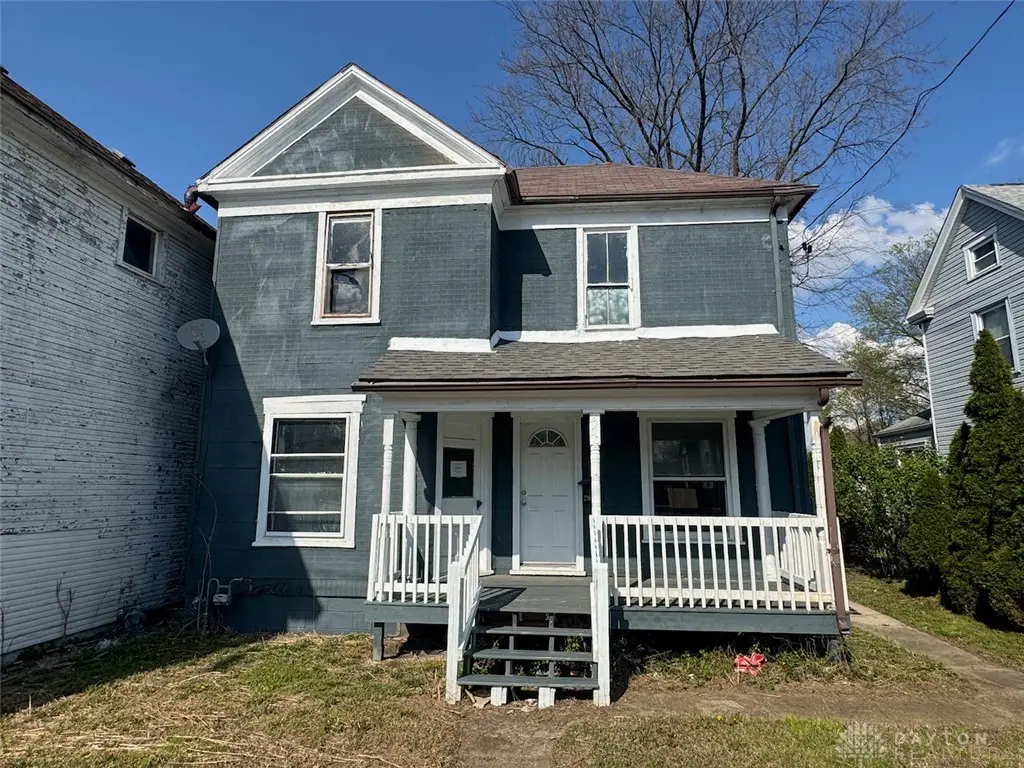
2100 Wayne Ave · Dayton, OH
Flood risk 1/10 · Minimal
- FEMA flood zone
- X (unshaded)
- Chance of flooding over 30 yrs
- 0.0%
- Est. flood insurance / yr
- $473 – $860
Fire risk 1/10 · Minimal
- Est. fire insurance / yr
- $713 – $1,323
Heat risk 4/10 · Minor
- Hot days now (above 101°F)
- 7 days/yr
- Hot days in 30 yrs
- 18 days/yr
Wind risk 2/10 · Minimal
- Chance of severe wind over 30 yrs
- 0.0%
Air-quality risk 3/10 · Minor
- Unhealthy air days now
- 3 days/yr
- Unhealthy air days in 30 yrs
- 5 days/yr
Risk factors via First Street. Map © Google.
Why this score? — see what drove the B+ grade
The composite is a weighted blend of 9 inputs, each scored 0–100. Each bar is that input's sub-score; the figure is the points it added to the 100-point composite (weight × sub-score).
- Cash flow +30.0/30.0
- ARV discount +15.0/15.0
- 1% rule +10.0/10.0
- DSCR +10.0/10.0
- Rent growth +5.0/5.0
- Livability +3.2/5.0
- Condition / age +2.5/5.0
- Schools +1.3/10.0
- Appreciation +0.0/10.0
$85,000
🖨 Deal sheet (PDF) 📄 Offer letter ✓ Due diligence
Listing remarks MLS
Spacious 4-bedroom, 2-bath two-story home located in the heart of Dayton! Large windows throughout fill the home with natural light, creating a bright and welcoming feel. Enjoy relaxing on the inviting front porch and take advantage of the generous backyard with plenty of room for outdoor living, gardening, or entertaining. This home offers great space, character, and opportunity for someone ready to add their personal touch and bring it back to life. A solid property with tons of potential in a convenient location close to everything Dayton has to offer!
Key facts
- Large windows
- Front porch
- Solid property
Tags
Neighborhood map
What this means for you Summary
Snapshot
- This is a 3-bed/2.0-bath single-family listed at $85k.
Deal economics
- At list price, monthly cash flow is $540 ($6k/yr) — positive.
- The deal already cash-flows at list — no discount required.
- Meets the 1% rule at list price ($1k rent vs $85k).
- Recommended offer: $80k (6.0% below list) — sets the bar for market timing.
- Cap rate 13.9% vs local median 7.3% in Dayton — top-decile yield for the area; either an underpriced asset or a hidden risk that comps aren't pricing in. Stress-test before assuming the spread holds.
Location & tenants
- Location reads 65/100 on livability (#716 in OH) — a middle-class / working-renter tenant base. Strengths: cost of living A+, housing A+, health & safety A; Watch: amenities C-, crime F, commute F.
- Dayton City (urban): math 12% / reading 21% proficiency, ranked #641 of 656 in OH (top 98%) — low school quality limits family demand, transient renter base, plan for 1-2y turnover; 74% free/reduced lunch — lower-income household profile, screen leases tightly.
- Zoned schools: River'S Edge Montessori Elementary School (math 22% / reading 32%, grade F, #1,193 of 1,584 statewide, top 76%, 494 students, 0% FRL); Belmont High School (math 5% / reading 20%, grade F, #720 of 781 statewide, top 93%, 1,100 students, 0% FRL) — zoned schools average 0% FRL vs 74% district-wide (74 pts lower); this property's tenant base skews higher-income than the district average.
- Market conditions: Rents rising fast (+11.4%/yr); 94 active listings in the ZIP; 40 comparable units currently listed for rent nearby; rentals at typical pace (median 16d on market — plan ~3-4 weeks tenant-placement turnaround); 907 units permitted in Montgomery County in 2024 (416 in 5+ unit buildings).
- This rent runs 36% of the median local income ($47k/yr) — at the standard rent-burdened threshold; future hikes will face affordability resistance.
Forward outlook
- Local home prices are declining (-3.0%/yr); year-one equity from $588 of loan paydown is wiped out by about $3k of value loss. Plan a longer hold.
- Montgomery County population projected at -10% by 2050 — secular population decline; favor cash flow + early exit over multi-decade hold.
- At projected returns (-3.0% appreciation + 8.0% rent growth), your $24k cash investment doubles in ~4 years — after that, you're playing with house money.
Negotiation context
- It's been on market 67 days — a 6% lower offer ($80k) is reasonable based on typical stale-listing flexibility.
- 6 sale attempts since 16y ago; this cycle's ask has dropped $5k (6%) from the opening price — seller is motivated, your offer sets the floor, not the list.
- Current owner paid $32k; list at $85k implies a 166% gain — meaningful room to come down on a strong offer.
Risks & watch-outs
- Watch-outs: built in 1905 — expect roof / HVAC / electrical / plumbing capex.
Questions for the listing agent
- It's been on market 67 days. Have you received any prior offers? Is the seller open to a 6% concession, seller financing, or rate buy-down credit?
- Built in 1905 — when were the roof, HVAC, electrical panel, plumbing, and water heater last replaced?
- Why hasn't it sold? Are there any deal-killer items the seller is aware of (foundation, flood, title, zoning, code violations)?
- Is there a deadline driving the sale (1031 exchange, divorce, estate, relocation)? That informs how much negotiation room exists.
- Crime grade is F in this area — have there been break-ins, vandalism, or insurance claims at this property in the last 3 years? What carrier currently insures it and at what premium?
- What's the average days-on-market for RENTAL listings here right now (not sales)? A rising rental-DOM trend means longer vacancies and softer asking-rent achievability than the comps imply.
- What's the recent tenant-quality profile in this submarket — average credit score on applications, eviction rate, late-payment / NSF rate, and stable-employment percentage? A property-management company in the area should have these aggregated.
- How much new for-sale + rental construction is in the pipeline within 1–3 miles? Heavy new supply typically softens prices + rents 12–24 months out; constrained supply supports both.
Investment metrics
- 1% rule
- 1.65% ✓
- Cap rate
- 13.92%
- Cash-on-cash
- 27.23%
- DSCR
- 2.21
- GRM
- 5.1
CMA / ARV
- ARV (median comp)
- $164,325
- List price
- $85,000
- Delta
- -48.27%
- Verdict
- UNDERPRICED
- Comps
- 20 within 1.0 mi
Show comp detail 12 sales within ~0.75 mi
| Address | Dist | Beds/Ba | Sqft | Sold | Price | $/sf | Match |
|---|---|---|---|---|---|---|---|
| 2127 Wayne Ave | 0.05mi | 3/2.0 | 1,648 (+7%) | 2mo | $125,164 | $76 | 84 |
| 40 Anderson St | 0.09mi | 3/1.5 | 1,433 (-7%) | 1mo | $172,850 | $121 | 81 |
| 128 Missouri Ave | 0.21mi | 3/2.0 | 1,415 (-8%) | 2mo | $165,000 | $117 | 75 |
| 112 Missouri Ave | 0.24mi | 4/1.0 (+1) | 1,581 (+2%) | 3mo | $150,500 | $95 | 73 |
| 167 Indiana Ave | 0.23mi | 3/1.5 | 1,395 (-10%) | 2mo | $179,900 | $129 | 70 |
| 136 Dover St | 0.54mi | 3/1.5 | 1,512 (-2%) | 2mo | $92,000 | $61 | 68 |
| 1027 Highland Ave | 0.44mi | 4/1.5 (+1) | 1,520 (-1%) | 3mo | $117,500 | $77 | 67 |
| 645 Orlando Ter | 0.66mi | 3/2.0 | 1,562 (+1%) | 1mo | $315,000 | $202 | 67 |
| 55 Illinois Ave | 0.30mi | 3/1.0 | 1,408 (-9%) | 1mo | $95,000 | $67 | 67 |
| 1254 Phillips Ave | 0.51mi | 3/1.5 | 1,348 (-13%) | 2mo | $187,000 | $139 | 51 |
| 55 Virginia Ave | 0.37mi | 4/2.5 (+1) | 1,757 (+14%) | 2mo | $215,000 | $122 | 51 |
| 853 Creighton Ave | 0.74mi | 3/1.0 | 1,368 (-11%) | 2mo | $125,000 | $91 | 40 |
Match score weights: distance 35% · size 25% · config 20% · recency 20%. Top-matched comps best support the ARV.
Projected returns pro-forma
-3.0% appreciation · 8.0% rent growth · sell at horizon
- IRR
- 26.7%
- Equity multiple
- 2.18×
- Total profit
- $28,045
- Equity at exit
- $12,674
- IRR
- 37.1%
- Equity multiple
- 5.31×
- Total profit
- $102,476
- Equity at exit
- $7,349
Cash invested: $23,800 (down + closing). Projections, not guarantees.
Landlord ↔ Tenant lean methodology
- Overall (STATE)
- 73 Landlord-Friendly
- State Ohio
- 73 Landlord-Friendly · R+6
- County
- — inherits STATE
- City
- — inherits STATE
ZIP-level market 45410
- Home prices YoY
- -21.4%
- Rents YoY
- 11.4%
- Active inventory
- 94
- Price-to-rent
- 5.1×
Monthly cashflow live
- Estimated rent
- $1,402 high interval (Pro) →
- Mortgage (P&I)
- −$446
- Tax from tax record
- −$86 /mo · $1,036/yr
- Insurance
- −$35
- HOA
- −$0
- Vacancy / Maint / Mgmt
- −$294
- Net cashflow
- $540
Break-even live
Sensitivity live
| Price | -10% $588 | -5% $564 | +0% $540 | +5% $516 | +10% $492 |
|---|---|---|---|---|---|
| Rent | -10% $429 | -5% $485 | +0% $540 | +5% $595 | +10% $651 |
| Rate | -1.0pp $583 | -0.5pp $562 | base $540 | +0.5pp $518 | +1.0pp $496 |
UW: 25.0% down · 7.5% · 30yr · 1.5% tax · 5.0% vac · 8.0% maint · 8.0% mgmt
Financing live
Cash to close
- Down payment
- $21,250
- Closing costs
- $2,550
- Reserves months
- —
- Total cash needed
- —
Loan-product check · same deal, 3 products live
Conventional
25% down · 7.5% · 30yr
- Down + closing
- —
- Monthly P&I
- —
- Monthly cashflow
- —
- DSCR
- —
- Eligible?
- —
Personal DTI + credit; lowest rate.
DSCR
20% down · 8.5% · 30yr
- Down + closing
- —
- Monthly P&I
- —
- Monthly cashflow
- —
- DSCR
- —
- Eligible?
- —
No personal income docs; deal must DSCR.
Hard money
10% down · 12.0% · 12mo
- Down + closing
- —
- Monthly P&I
- —
- Monthly cashflow
- —
- DSCR
- —
- Eligible?
- —
Short-term bridge; refi at stabilization.
Rent comps 40 comps
| Address | Beds | Baths | Sqft | Rent | $/sqft | DOM | Units | Dist |
|---|---|---|---|---|---|---|---|---|
| 2114 Wayne Ave Dayton, OH | 4.0 | 2.0 | 1723 | $1,595 | $0.93 | 45d | 1 | 0.05mi |
| 2132 Wayne Ave Dayton, OH | 3.0 | 2.0 | 1484 | $1,350 | $0.91 | 4d | 1 | 0.07mi |
| 313 Illinois Ave Dayton, OH | 3.0 | 1.0 | 1142 | $975 | $0.85 | 5d | 1 | 0.10mi |
| 20 Lucerne Ave Dayton, OH | 3.0 | 1.0 | 1378 | $1,200 | $0.87 | 45d | 1 | 0.17mi |
| 920 E Stewart St Dayton, OH | 4.0 | 1.0 | 1322 | $1,425 | $1.08 | 45d | 1 | 0.17mi |
| 32 Gebhart St Dayton, OH | 4.0 | 1.0 | 1800 | $1,400 | $0.78 | 16d | 1 | 0.19mi |
| 534 Beckman St Dayton, OH | 3.0 | 2.0 | 1452 | $1,400 | $0.96 | 4d | 1 | 0.24mi |
| 136 Indiana Ave Dayton, OH | 3.0 | 1.0 | 1194 | $1,250 | $1.05 | 25d | 1 | 0.25mi |
| 1038 Walnut Hill Pl Dayton, OH | 3.0 | 1.0 | 1232 | $1,095 | $0.89 | 45d | 1 | 0.32mi |
| 1020 Walnut Hill Pl Dayton, OH | 3.0 | 1.0 | 1200 | $1,400 | $1.17 | 45d | 1 | 0.35mi |
| 1603 Manette Pl Dayton, OH | 4.0 | 2.0 | 2000 | $1,695 | $0.85 | 16d | 1 | 0.40mi |
| 1411 Wyoming St Dayton, OH | 3.0 | 1.0 | 1256 | $1,095 | $0.87 | 4d | 1 | 0.42mi |
| 1515 Wyoming St Dayton, OH | 3.0 | 1.0 | 1400 | $1,000 | $0.71 | 45d | 1 | 0.46mi |
| 31 Bidleman St Dayton, OH | 2.0 | 1.5 | 1568 | $1,100 | $0.70 | 45d | 1 | 0.49mi |
| 2600 Wayne Ave Dayton, OH | 4.0 | 1.5 | 1328 | $1,500 | $1.13 | 25d | 1 | 0.51mi |
| 1101 Phillips Ave Unit 1101 Dayton, OH | 3.0 | 1.5 | 1300 | $1,450 | $1.12 | 45d | 1 | 0.54mi |
| 519 Wyoming St Dayton, OH | 3.0 | 1.5 | 1240 | $1,600 | $1.29 | 45d | 1 | 0.64mi |
| 438 Clover St Dayton, OH | 3.0 | 2.0 | 2156 | $1,025 | $0.48 | 45d | 1 | 0.68mi |
| 320 Park Dr Dayton, OH | 4.0 | 3.0 | 2100 | $2,400 | $1.14 | 16d | 1 | 0.68mi |
| 1112 Irving Ave Dayton, OH | 3.0 | 4.0 | 2041 | $4,500 | $2.20 | 5d | 1 | 0.70mi |
| 511 Parrot St Dayton, OH | 3.0 | 1.5 | 1618 | $1,100 | $0.68 | 16d | 1 | 0.72mi |
| 344 Firwood Dr Dayton, OH | 1.0–3.0 | 1.0–1.5 | 739 | $1,350 | $1.83 | 4d | 15 | 0.79mi |
| 244 Quitman St Unit A Dayton, OH | 3.0 | 1.0 | 1987 | $1,325 | $0.67 | 25d | 1 | 0.81mi |
| 319 Wyoming St Dayton, OH | 4.0 | 2.5 | 2064 | $2,000 | $0.97 | 4d | 1 | 0.82mi |
| 637 Creighton Ave Dayton, OH | 3.0 | 1.0 | 1144 | $1,350 | $1.18 | 16d | 1 | 0.88mi |
| 229 James St Unit 228 Dayton, OH | 3.0 | 1.0 | 1700 | $1,200 | $0.71 | 25d | 1 | 0.88mi |
| 227 James St Unit 1 Dayton, OH | 3.0 | 1.0 | 1700 | $1,200 | $0.71 | 5d | 1 | 0.89mi |
| 228 James St Dayton, OH | 3.0 | 1.0 | 1700 | $1,200 | $0.71 | 45d | 1 | 0.90mi |
| 836 Wellmeier Ave Dayton, OH | 4.0 | 1.0 | 2148 | $1,500 | $0.70 | 5d | 1 | 0.92mi |
| 854 Santa Cruz Ave Dayton, OH | 3.0 | 1.0 | 1060 | $1,300 | $1.23 | 45d | 1 | 0.96mi |
| 243 Oak St Dayton, OH | 3.0 | 1.5 | 1316 | $1,600 | $1.22 | 5d | 1 | 0.97mi |
| 25 Garret St Dayton, OH | 2.0 | 1.5 | 1364 | $1,750 | $1.28 | 25d | 1 | 1.03mi |
| 424 Bantz Ct Dayton, OH | 3.0 | 1.0 | 1192 | $1,050 | $0.88 | 5d | 1 | 1.04mi |
| 121 E Schantz Ave #3 Dayton, OH | 3.0 | 2.0 | 2200 | $3,500 | $1.59 | 4d | 1 | 1.08mi |
| 706 Kolping Ave Unit 706 Dayton, OH | 3.0 | 1.5 | 1172 | $1,300 | $1.11 | 4d | 1 | 1.09mi |
| 23 Jasper St Dayton, OH | 4.0 | 4.0 | 1490 | $3,600 | $2.42 | 5d | 1 | 1.12mi |
| 213 Burns Ave Dayton, OH | 2.0 | 1.5 | 1388 | $1,500 | $1.08 | 45d | 1 | 1.19mi |
| 213 Burns Ave Dayton, OH | 2.0 | 1.5 | 1388 | $1,500 | $1.08 | 16d | 1 | 1.19mi |
| 1354 Ohmer St Unit 1356C Dayton, OH | 2.0 | 2.0 | 1200 | $900 | $0.75 | 45d | 1 | 1.20mi |
| 1053 Wilmington Ave Dayton, OH | 2.0–3.0 | 1.0–1.5 | 1025 | $1,495 | $1.46 | 4d | 5 | 1.22mi |
Listing history 42 events
-
2026-06-22days on market $85,000 Active 67 DOM
-
2026-06-18days on market $85,000 Active 64 DOM
-
2026-06-17days on market $85,000 Active 63 DOM
-
2026-06-16days on market $85,000 Active 62 DOM
-
2026-06-15days on market $85,000 Active 61 DOM
-
2026-06-14days on market $85,000 Active 59 DOM
-
2026-06-13days on market $85,000 Active 58 DOM
-
2026-06-10days on market $85,000 Active 56 DOM
-
2026-06-09days on market $85,000 Active 55 DOM
-
2026-06-08days on market $85,000 Active 54 DOM
-
2026-06-07days on market $85,000 Active 53 DOM
-
2026-06-05days on market $85,000 Active 50 DOM
-
2026-06-03days on market $85,000 Active 49 DOM
-
2026-06-02days on market $85,000 Active 48 DOM
-
2026-06-01days on market $85,000 Active 47 DOM
-
2026-05-31days on market $85,000 Active 46 DOM
-
2026-04-15$90,000 Active 561-char remark
Show marketing remark (561 chars)
Spacious 4-bedroom, 2-bath two-story home located in the heart of Dayton! Large windows throughout fill the home with natural light, creating a bright and welcoming feel. Enjoy relaxing on the inviting front porch and take advantage of the generous backyard with plenty of room for outdoor living, gardening, or entertaining. This home offers great space, character, and opportunity for someone ready to add their personal touch and bring it back to life. A solid property with tons of potential in a convenient location close to everything Dayton has to offer!
-
2025-06-12status Pending
-
2025-06-09historical
-
2025-06-06price $70,000
-
2025-06-06price $70,000
-
2025-06-02price $80,000
-
2025-06-01price $80,000
-
2025-05-23price $99,900
-
2025-05-23price $99,900
-
2025-04-28$115,000 Active
-
2021-08-23soldstatus $32,000 Closed
-
2021-08-23soldstatus $32,000 Sold
-
2021-08-16historical Active/Pending
-
2021-08-11$35,800 Active
-
2012-02-02historical
-
2011-11-02$9,900
-
2011-10-31historical
-
2011-07-31$29,900
-
2011-03-02soldstatus $1,000 Closed
-
2011-03-02soldstatus $1,000
-
2011-02-21historical
-
2010-12-06$9,900
-
2007-11-14soldstatus $65,000
-
2006-01-12soldstatus $36,200
-
1997-11-07soldstatus $47,500
-
1990-08-17soldstatus $25,000
ⓘ Source: listings_history table (triggers on properties + properties_extension) + one-shot
backfill from property_details.listing_events for pre-trigger history.
Tax reassessment forecast OH · Partial reset (capped growth)
- Current annual tax
- $1,036 · $86/mo
- Projected year-2 tax
- $1,181 · $98/mo
- Expected delta
- +$145/yr (+$12/mo · 14.0%)
ⓘ Screening estimate from a state-policy table — verify with the county assessor before closing.
Climate risk First Street
- Flood 1/10 Low FEMA zone X (unshaded) · 0% chance over 30 yrs
- Wildfire 1/10 Low
- Heat 4/10 Moderate 7 d/yr ≥101°F today · 18 d/yr by 30 yrs out
- Wind 2/10 Low 0% chance of damaging wind over 30 yrs
- Air quality 3/10 Moderate 3 unhealthy d/yr today · 5 by 30 yrs out
Nearby sold comps map
Loading sold comps map…
Walkable amenities ~0.75 mi
Loading nearby amenities…
Taxation est. · year 1
- Rental income
- $16,824
- − Mortgage interest
- −$4,761
- − Property taxes
- −$1,036
- − Insurance
- −$425
- − Repairs & maintenance
- −$1,346
- − Management
- −$1,346
- − Depreciation
- −$2,473
- Taxable income
- $5,438
- Est. tax owed @ 24.0%
- −$1,305
- After-tax cash flow
- $5,176/yr
For passive investors: Depreciation is non-cash, so a rental often shows a tax loss while cash-flowing — sheltering income. Rental losses are passive: they offset passive income freely, and up to $25,000/yr can offset ordinary (W-2) income if you actively participate and your MAGI is under $100k (phasing out to $0 by $150k); unused losses carry forward. On sale, claimed depreciation is recaptured at up to 25%, and gains may owe capital-gains tax (a 1031 exchange can defer both). Figures are a year-1 estimate at your 24.0% rate — not tax advice; consult a CPA.
Schools (NCES district)
- District
- Dayton City
- NCES district ID
- 3904384
- Math proficiency
- 12% ▼ -12.00%
- Reading proficiency
- 21% ▼ -11.00%
- Median HH income
- $28,688
- Composite
- 12.94/100
- National rank
- #9579
- State rank
- #641 of 656 in OH
Livability — Dayton
- Score
- 65/100
- State rank
- #716
- US rank
- #12895
Category grades
Schools grade is shown separately in the Schools card above.
Census & demographics
- Census place
- Dayton, OH
- County
- Montgomery County · 459,541 people
- City population
- 164,387
- Metro
- Dayton-Kettering, OH
- Population (ZIP)
- 14,694
- Household income
- $46,651
- Rent vs Own
- Severe rent burden
- 961.0
Population outlook (Montgomery County) Hauer SSP2
- Today (2025)
- 523,241 people
- By 2030
- 514,948 · -1.6%
- By 2040
- 493,378 · -5.7%
- By 2050
- 469,639 · -10.2%
- By 2075
- 418,360 · -20.0%
- By 2100
- 353,315 · -32.5%
Race, ethnicity, and origin ACS 2023
- Neighborhood character
- Predominantly White (71%)
- Race & ethnicity
- White 71% Black 15% Hispanic / Latino 7% Two or more races 6% Asian 1%
- Hispanic origin (detail)
- Mexican 3%
- Common ancestry
- Lithuanian 2% Iranian 2% Slovak 2%
- Foreign-born
- 5% · Canada, United Kingdom
- Languages at home
- 91% English-only · Spanish 6% Tagalog/Filipino 1% Other Asian/Pacific 1%
Political lean MEDSL · Montgomery
- 2024 margin
- Toss-up / Even · D 49.8% · R 49.3%
- 2008→2024 swing
- -5.8pp toward R · 2008: 6.2pp · 2024: 0.5pp
- All cycles
- 2024: D+0.5 2020: D+2.2 2016: R+1.2 2012: D+3.1 2008: D+6.2
Not yet ingested
- Civics
- —
Market trends
- HPI YoY
- ▼ -100.61%
- Current HPI
- 369.3938
- Rent YoY
- ▲ 11.37%
- Metro
- Dayton-Kettering, OH
- State GDP YoY
- ▲ 1.98%
- F500 in state
- 48
Industry mix (Fortune 500 HQ in OH)
| Industry | F500 HQs | Revenue |
|---|---|---|
| Insurance | 3 | $145B |
|
||
| Industrial Machinery | 3 | $49B |
|
||
| Financial Services | 3 | $24B |
|
||
| Consumer Goods | 2 | $93B |
|
||
| Aerospace / Defense | 2 | $47B |
|
||
| Utilities | 2 | $33B |
|
||
Price history
+260.0% since first listed26 events — show timeline
- 2026-04-15 Listed $90,000 Dayton MLS
- 2025-06-12 Pending — WRIST
- 2025-06-09 Listing Removed — WRIST
- 2025-06-06 Price Changed $70,000 WRIST
- 2025-06-06 Price Changed $70,000 Dayton MLS
- 2025-06-02 Price Changed $80,000 Dayton MLS
- 2025-06-01 Price Changed $80,000 WRIST
- 2025-05-23 Price Changed $99,900 WRIST
- 2025-05-23 Price Changed $99,900 Dayton MLS
- 2025-04-28 Listed $115,000 WRIST
- 2021-08-23 Sold (MLS) $32,000 Dayton MLS
- 2021-08-23 Sold (MLS) $32,000 Dayton MLS
- 2021-08-16 Contingent — Dayton MLS
- 2021-08-11 Listed $35,800 Dayton MLS
- 2012-02-02 Listing Removed — Dayton MLS
- 2011-11-02 Listed $9,900 Dayton MLS
- 2011-10-31 Listing Removed — Dayton MLS
- 2011-07-31 Listed $29,900 Dayton MLS
- 2011-03-02 Sold (MLS) $1,000 Dayton MLS
- 2011-03-02 Sold (MLS) $1,000 Dayton MLS
- 2011-02-21 Listing Removed — Dayton MLS
- 2010-12-06 Listed $9,900 Dayton MLS
- 2007-11-14 Sold (Public Records) $65,000 Public Records
- 2006-01-12 Sold (Public Records) $36,200 Public Records
- 1997-11-07 Sold (Public Records) $47,500 Public Records
- 1990-08-17 Sold (Public Records) $25,000 Public Records
Property tax history
-6.1%/yrLatest (2025): $1,036 · +2.4% YoY. Source: county tax records.
Cash-flow waterfall
monthlySold comps — $/sqft
last 12 mo · ≤1 miLoading sold comps…