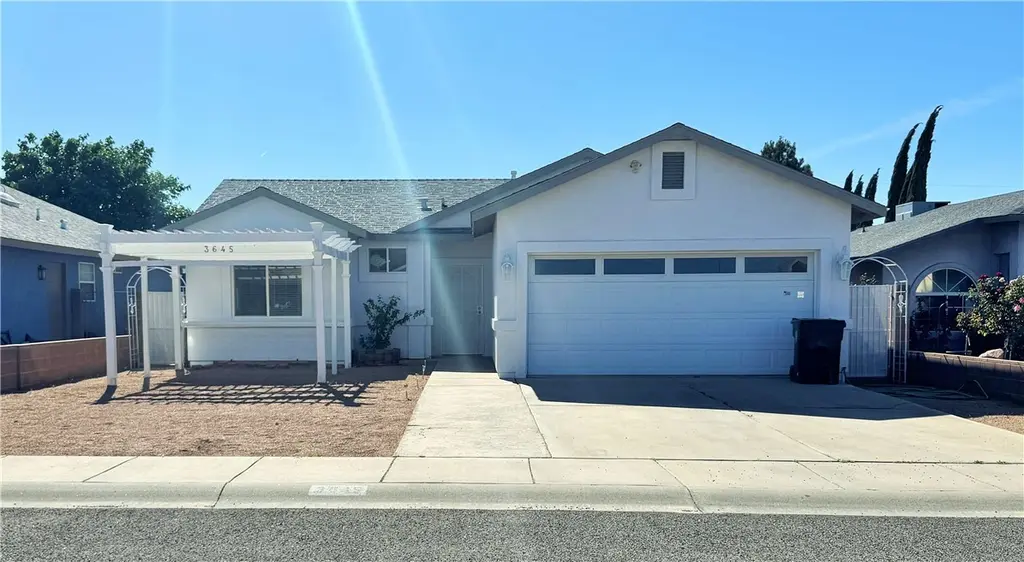
3645 N Verdugo Rd · Kingman, AZ
Flood risk 1/10 · Minimal
- FEMA flood zone
- X (shaded)
- Chance of flooding over 30 yrs
- 0.0%
- Est. flood insurance / yr
- $507 – $1,088
Fire risk 7/10 · Major
- Est. fire insurance / yr
- $610 – $1,132
Heat risk 6/10 · Moderate
- Hot days now (above 100°F)
- 8 days/yr
- Hot days in 30 yrs
- 20 days/yr
Wind risk 1/10 · Minimal
- Chance of severe wind over 30 yrs
- —
Air-quality risk 1/10 · Minimal
- Unhealthy air days now
- 0 days/yr
- Unhealthy air days in 30 yrs
- 0 days/yr
Risk factors via First Street. Map © Google.
Why this score? — see what drove the D grade
The composite is a weighted blend of 9 inputs, each scored 0–100. Each bar is that input's sub-score; the figure is the points it added to the 100-point composite (weight × sub-score).
- Cash flow +13.8/30.0
- ARV discount +9.6/15.0
- DSCR +4.2/10.0
- Livability +4.0/5.0
- 1% rule +2.6/10.0
- Rent growth +2.6/5.0
- Condition / age +2.5/5.0
- Schools +1.8/10.0
- Appreciation +0.0/10.0
$234,900
🖨 Deal sheet (PDF) 📄 Offer letter ✓ Due diligence
Listing remarks MLS
- Quiet street located near the center of town - Custom floor plan - Low maintenance -
Key facts
- New upgrades
- Low maintenance yard
- Centrally located
Tags
Property features AI
Exterior
- Parking: Attached 2-car garage
- Utilities: 220 volt electric service; Natural gas available; Public sewer
- Home design: Single family residence; Residential property
- Construction: Shingle roof
- Exterior features: Block fencing in back yard; Water-smart landscaping; Paved road access; No pool
Interior
- Kitchen: Dishwasher; Gas oven; Gas range; Refrigerator; Granite counters; Breakfast bar
- Bedrooms: Bedrooms with walk-in closets
- Bathrooms: 2 full bathrooms; Accessible full bathroom
- Interior features: Breakfast bar; Ceiling fans; Granite counters; Walk-in closets; Window coverings; Accessible full bathroom
- Laundry & utility: Water heater
Heating & cooling
- Heating & cooling: Central heating (natural gas); Central air; Ceiling fans; Electric cooling
Neighborhood map
What this means for you Summary
Snapshot
- This is a 3-bed/2.0-bath single-family listed at $235k.
Deal economics
- At list price, monthly cash flow is $22 ($259/yr) — positive.
- The deal already cash-flows at list — no discount required.
- To meet the 1% rule (rent ≥ 1% of price), the offer needs to be $177k (24.5% below list).
- Recommended offer: $177k (24.5% below list) — sets the bar for 1% rule.
- Cap rate 6.4% vs local median 3.5% in Kingman — top-decile yield for the area; either an underpriced asset or a hidden risk that comps aren't pricing in. Stress-test before assuming the spread holds.
Location & tenants
- Location reads 79/100 on livability (#5 in AZ, #2,014 nationally) — a middle-class / working-renter tenant base. Strengths: commute A+, cost of living A+, housing A+; Watch: crime C-, employment C-, amenities F.
- Kingman Unified School District (79598) (town): math 19% / reading 24% proficiency, ranked #179 of 249 in AZ (top 72%) — low school quality limits family demand, transient renter base, plan for 1-2y turnover.
- Zoned schools: Manzanita Elementary (math 42% / reading 42%, grade F, #371 of 1,109 statewide, top 34%, 793 students, 63% FRL); Kingman Middle School (math 10% / reading 13%, grade F, #180 of 218 statewide, top 83%, 737 students, 74% FRL); Kingman High School (math 4% / reading 6%, grade F, #364 of 381 statewide, top 100%, 905 students, 50% FRL) — zoned schools at 62% FRL track the district average.
- Market conditions: Rents flat; 647 active listings in the ZIP; 29 comparable units currently listed for rent nearby; rentals lingering (median 46d on market — plan ~5-8 weeks vacancy on turnover, expect pricing pressure); 66% of comp listings sitting > 30 days — soft ceiling on asking rent; 2,543 units permitted in Mohave County in 2024 (33 in 5+ unit buildings).
- This rent runs 42% of the median local income ($51k/yr) — at the standard rent-burdened threshold; future hikes will face affordability resistance.
Forward outlook
- Local home prices are declining (-3.0%/yr); year-one equity from $2k of loan paydown is wiped out by about $7k of value loss. Plan a longer hold.
- Mohave County population projected to shrink 6% by 2050 — rents likely to lag national; underwrite the cash flow, not the appreciation.
Negotiation context
- It's been on market 41 days — a 3% lower offer ($228k) is reasonable based on typical stale-listing flexibility.
- 4 sale attempts since 4y ago; this cycle's ask has dropped $24k (9%) from the opening price — seller is motivated, your offer sets the floor, not the list.
Risks & watch-outs
- Climate carrying-cost: major wildfire risk; extreme-heat days projected 8→20/yr by 2055 (HVAC capex compounding) — expect insurance premiums to compound above CPI over the hold.
Questions for the listing agent
- It's been on market 41 days. Have you received any prior offers? Is the seller open to a 24% concession, seller financing, or rate buy-down credit?
- Is there a deadline driving the sale (1031 exchange, divorce, estate, relocation)? That informs how much negotiation room exists.
- Schools are D-rated, which usually means shorter tenancies and higher turnover. Who's the typical renter profile here, and what's been the actual vacancy rate?
- The area grade is low — what's the realistic commute time and amenity access for the typical tenant pool here? Any planned neighborhood developments (good or bad) we should know about?
- What's the average days-on-market for RENTAL listings here right now (not sales)? A rising rental-DOM trend means longer vacancies and softer asking-rent achievability than the comps imply.
- What's the recent tenant-quality profile in this submarket — average credit score on applications, eviction rate, late-payment / NSF rate, and stable-employment percentage? A property-management company in the area should have these aggregated.
- How much new for-sale + rental construction is in the pipeline within 1–3 miles? Heavy new supply typically softens prices + rents 12–24 months out; constrained supply supports both.
Investment metrics
- 1% rule
- 0.76% ✗
- Cap rate
- 6.40%
- Cash-on-cash
- 0.39%
- DSCR
- 1.02
- GRM
- 11.0
CMA / ARV
- ARV (median comp)
- $246,231
- List price
- $234,900
- Delta
- -4.60%
- Verdict
- FAIR
- Comps
- 20 within 1.0 mi
Show comp detail 12 sales within ~0.75 mi
| Address | Dist | Beds/Ba | Sqft | Sold | Price | $/sf | Match |
|---|---|---|---|---|---|---|---|
| 3645 N Verdugo Rd | 0.00mi | 3/2.0 | 1,317 (0%) | 0mo | $232,900 | $177 | 100 |
| 3615 N Verdugo Rd | 0.07mi | 3/2.0 | 1,323 (+0%) | 1mo | $247,500 | $187 | 95 |
| 3561 N Lomita St | 0.19mi | 3/2.0 | 1,341 (+2%) | 0mo | $280,000 | $209 | 88 |
| 3632 N Irving St | 0.27mi | 3/2.0 | 1,325 (+1%) | 2mo | $266,900 | $201 | 85 |
| 3636 N Irving St | 0.27mi | 3/2.0 | 1,325 (+1%) | 2mo | $266,900 | $201 | 85 |
| 3740 N Kenneth Rd | 0.22mi | 3/2.0 | 1,279 (-3%) | 2mo | $210,000 | $164 | 83 |
| 3671 N Burbank St | 0.29mi | 3/2.0 | 1,248 (-5%) | 2mo | $237,500 | $190 | 76 |
| 3698 N Roosevelt St | 0.37mi | 3/2.0 | 1,249 (-5%) | 2mo | $217,900 | $174 | 72 |
| 2078 Roy Rogers Way | 0.36mi | 3/2.0 | 1,420 (+8%) | 2mo | $310,000 | $218 | 68 |
| 3851 Heritage Ln | 0.38mi | 2/2.0 (-1) | 1,196 (-9%) | 2mo | $242,000 | $202 | 61 |
| 3953 Rex Allen Ct | 0.64mi | 3/2.0 | 1,440 (+9%) | 1mo | $318,000 | $221 | 54 |
| 2156 Alan Ladd Dr | 0.71mi | 3/2.0 | 1,472 (+12%) | 2mo | $329,000 | $224 | 46 |
Match score weights: distance 35% · size 25% · config 20% · recency 20%. Top-matched comps best support the ARV.
Projected returns pro-forma
-3.0% appreciation · 0.33% rent growth · sell at horizon
- IRR
- -18.3%
- Equity multiple
- 0.37×
- Total profit
- $-41,454
- Equity at exit
- $35,024
- IRR
- -16.0%
- Equity multiple
- 0.20×
- Total profit
- $-52,881
- Equity at exit
- $20,310
Cash invested: $65,772 (down + closing). Projections, not guarantees.
Landlord ↔ Tenant lean methodology
- Overall (STATE)
- 87 Strongly Landlord-Friendly
- State Arizona
- 87 Strongly Landlord-Friendly · R+3
- County
- — inherits STATE
- City
- — inherits STATE
ZIP-level market 86409
- Rents YoY
- 0.3%
- Active inventory
- 647
- Price-to-rent
- 11.0×
Monthly cashflow live
- Estimated rent
- $1,774 high interval (Pro) →
- Mortgage (P&I)
- −$1,232
- Tax from tax record
- −$50 /mo · $598/yr
- Insurance
- −$98
- HOA
- −$0
- Vacancy / Maint / Mgmt
- −$372
- Net cashflow
- $22
Break-even live
Sensitivity live
| Price | -10% $155 | -5% $88 | +0% $22 | +5% $-45 | +10% $-111 |
|---|---|---|---|---|---|
| Rent | -10% $-119 | -5% $-48 | +0% $22 | +5% $92 | +10% $162 |
| Rate | -1.0pp $140 | -0.5pp $81 | base $22 | +0.5pp $-39 | +1.0pp $-101 |
UW: 25.0% down · 7.5% · 30yr · 1.5% tax · 5.0% vac · 8.0% maint · 8.0% mgmt
Financing live
Cash to close
- Down payment
- $58,725
- Closing costs
- $7,047
- Reserves months
- —
- Total cash needed
- —
Loan-product check · same deal, 3 products live
Conventional
25% down · 7.5% · 30yr
- Down + closing
- —
- Monthly P&I
- —
- Monthly cashflow
- —
- DSCR
- —
- Eligible?
- —
Personal DTI + credit; lowest rate.
DSCR
20% down · 8.5% · 30yr
- Down + closing
- —
- Monthly P&I
- —
- Monthly cashflow
- —
- DSCR
- —
- Eligible?
- —
No personal income docs; deal must DSCR.
Hard money
10% down · 12.0% · 12mo
- Down + closing
- —
- Monthly P&I
- —
- Monthly cashflow
- —
- DSCR
- —
- Eligible?
- —
Short-term bridge; refi at stabilization.
Rent comps 29 comps
| Address | Beds | Baths | Sqft | Rent | $/sqft | DOM | Units | Dist |
|---|---|---|---|---|---|---|---|---|
| 3644 N Lomita St Kingman, AZ | 4.0 | 2.0 | 1717 | $1,700 | $0.99 | 45d | 1 | 0.05mi |
| 3695 N Adams St Kingman, AZ | 3.0 | 2.0 | 1331 | $1,600 | $1.20 | 45d | 1 | 0.16mi |
| 3631 N Miller St Kingman, AZ | 3.0 | 2.0 | 1593 | $2,450 | $1.54 | 23d | 1 | 0.17mi |
| 3530 N Lomita St Unit C Kingman, AZ | 2.0 | 2.0 | 920 | $1,400 | $1.52 | 23d | 1 | 0.23mi |
| 3571 N Moore St Kingman, AZ | 3.0 | 2.0 | 1288 | $2,450 | $1.90 | 45d | 1 | 0.26mi |
| 3595 N Skylark Rd Kingman, AZ | 3.0 | 2.0 | 1138 | $1,475 | $1.30 | 45d | 1 | 0.28mi |
| 3838 Heritage Ln Kingman, AZ | 2.0 | 2.0 | 1285 | $1,650 | $1.28 | 45d | 1 | 0.37mi |
| 3736 N Roosevelt St Kingman, AZ | 3.0 | 2.0 | 1093 | $1,425 | $1.30 | 45d | 1 | 0.39mi |
| 3838 Meadowbrook Ln Kingman, AZ | 3.0 | 2.0 | 1602 | $1,800 | $1.12 | 23d | 1 | 0.42mi |
| 2244 Dollarhide Dr Kingman, AZ | 3.0 | 2.0 | 1628 | $1,948 | $1.20 | 15d | 1 | 0.52mi |
| 2118 Gene Autry Dr Kingman, AZ | 3.0 | 2.0 | 1494 | $1,850 | $1.24 | 45d | 1 | 0.58mi |
| 3953 Rex Allen Ct Kingman, AZ | 3.0 | 2.0 | 1440 | $1,750 | $1.22 | 15d | 1 | 0.65mi |
| 3932 Lindsey Ave Kingman, AZ | 3.0 | 2.0 | 1335 | $1,500 | $1.12 | 45d | 1 | 1.03mi |
| 969 Kenwood Ave Kingman, AZ | 2.0 | 2.0 | 992 | $2,250 | $2.27 | 45d | 1 | 1.20mi |
| 980 Astor Ave Unit 2 Kingman, AZ | 2.0 | 2.0 | 1100 | $1,350 | $1.23 | 15d | 1 | 1.22mi |
| 936 Astor Ave Unit 1 Kingman, AZ | 2.0 | 2.0 | 1100 | $1,400 | $1.27 | 45d | 1 | 1.25mi |
| 3423 N Fairfax St Kingman, AZ | 3.0 | 2.0 | 1397 | $1,700 | $1.22 | 15d | 1 | 1.26mi |
| 924 Astor Ave Unit 2 Kingman, AZ | 2.0 | 2.0 | 1100 | $1,650 | $1.50 | 23d | 1 | 1.26mi |
| 3418 Mulberry Ln Kingman, AZ | 3.0 | 2.0 | 1397 | $1,695 | $1.21 | 15d | 1 | 1.29mi |
| 2545 Kemp Ave Kingman, AZ | 3.0 | 2.0 | 1481 | $1,750 | $1.18 | 45d | 1 | 1.33mi |
| 969 Shadow Crest Cir Kingman, AZ | 2.0 | 2.0 | 1239 | $1,450 | $1.17 | 45d | 1 | 1.35mi |
| 3146 N Melody St Kingman, AZ | 3.0 | 2.0 | 1175 | $1,550 | $1.32 | 45d | 1 | 1.37mi |
| 3279 N Eagle Rock Rd Kingman, AZ | 3.0 | 2.0 | 1164 | $1,225 | $1.05 | 23d | 1 | 1.40mi |
| 1833 Atlantic Ave Kingman, AZ | 3.0 | 2.0 | 1506 | $1,495 | $0.99 | 45d | 1 | 1.40mi |
| 1947 Hope Ave Kingman, AZ | 3.0 | 2.0 | 1529 | $1,500 | $0.98 | 45d | 1 | 1.41mi |
| 915 E Berk Ave Kingman, AZ | 3.0 | 2.0 | 1175 | $1,495 | $1.27 | 45d | 1 | 1.41mi |
| 2201 Davis Ave Kingman, AZ | 3.0 | 1.0 | 1164 | $1,228 | $1.05 | 45d | 1 | 1.43mi |
| 733 Pala Mesa Dr Kingman, AZ | 3.0 | 2.0 | 1355 | $1,650 | $1.22 | 45d | 1 | 1.45mi |
| 732 Vista Grande Dr Kingman, AZ | 3.0 | 2.0 | 1212 | $1,600 | $1.32 | 45d | 1 | 1.48mi |
Listing history 19 events
-
2026-06-02status $234,900 Pending 41 DOM
-
2026-06-01days on market $234,900 Active 41 DOM
-
2026-05-31days on market $234,900 Active 40 DOM
-
2026-05-30days on market $234,900 Active 39 DOM
-
2026-05-15price $234,900 179-char remark
-
2026-05-08price $250,000 179-char remark
-
2026-05-07price $255,000 179-char remark
-
2026-04-21$259,000 Active 179-char remark
-
2023-04-14soldstatus $214,900 Closed 86-char remark
Show marketing remark (86 chars)
- Quiet street located near the center of town - Custom floor plan - Low maintenance -
-
2023-04-14soldstatus $214,900
Show marketing remark (86 chars)
- Quiet street located near the center of town - Custom floor plan - Low maintenance -
-
2023-02-09historical 86-char remark
Show marketing remark (86 chars)
- Quiet street located near the center of town - Custom floor plan - Low maintenance -
-
2023-02-09$209,900 86-char remark
Show marketing remark (86 chars)
- Quiet street located near the center of town - Custom floor plan - Low maintenance -
-
2022-12-27status Active
-
2022-12-11historical Active Under Contract
-
2022-10-07$224,900 Active
-
2005-07-11soldstatus $150,500
-
2002-08-29soldstatus $88,000
-
1997-04-25soldstatus $78,000
-
1996-08-02soldstatus $13,000
ⓘ Source: listings_history table (triggers on properties + properties_extension) + one-shot
backfill from property_details.listing_events for pre-trigger history.
Tax reassessment forecast AZ · Resets to sale price
- Current annual tax
- $598 · $50/mo
- Projected year-2 tax
- $1,550 · $129/mo
- Expected delta
- +$952/yr (+$79/mo · 159.3%)
ⓘ Screening estimate from a state-policy table — verify with the county assessor before closing.
Climate risk First Street
- Flood 1/10 Low FEMA zone X (shaded) · 0% chance over 30 yrs
- Wildfire 7/10 Severe
- Heat 6/10 Major 8 d/yr ≥100°F today · 20 d/yr by 30 yrs out
- Wind 1/10 Low
- Air quality 1/10 Low 0 unhealthy d/yr today · 0 by 30 yrs out
Nearby sold comps map
Loading sold comps map…
Walkable amenities ~0.75 mi
Loading nearby amenities…
Taxation est. · year 1
- Rental income
- $21,283
- − Mortgage interest
- −$13,158
- − Property taxes
- −$598
- − Insurance
- −$1,174
- − Repairs & maintenance
- −$1,703
- − Management
- −$1,703
- − Depreciation
- −$6,833
- Taxable loss
- −$3,886
- Est. tax savings @ 24.0%
- +$933
- After-tax cash flow
- $1,192/yr
For passive investors: Depreciation is non-cash, so a rental often shows a tax loss while cash-flowing — sheltering income. Rental losses are passive: they offset passive income freely, and up to $25,000/yr can offset ordinary (W-2) income if you actively participate and your MAGI is under $100k (phasing out to $0 by $150k); unused losses carry forward. On sale, claimed depreciation is recaptured at up to 25%, and gains may owe capital-gains tax (a 1031 exchange can defer both). Figures are a year-1 estimate at your 24.0% rate — not tax advice; consult a CPA.
Schools (NCES district)
- District
- Kingman Unified School District (79598)
- NCES district ID
- 0400295
- Math proficiency
- 19% ▼ -11.00%
- Reading proficiency
- 24% ▼ -9.00%
- Median HH income
- $36,760
- Composite
- 17.87/100
- National rank
- #9002
- State rank
- #179 of 249 in AZ
Livability — Kingman
- Score
- 79/100
- State rank
- #5
- US rank
- #2014
Category grades
Schools grade is shown separately in the Schools card above.
Census & demographics
- Census place
- Kingman, AZ
- County
- Mohave County · 181,906 people
- City population
- 60,489
- Metro
- Lake Havasu City-Kingman, AZ
- Population (ZIP)
- 30,365
- Household income
- $50,852
- Rent vs Own
- Severe rent burden
- 688.0
Population outlook (Mohave County) Hauer SSP2
- Today (2025)
- 209,184 people
- By 2030
- 209,674 · +0.2%
- By 2040
- 205,897 · -1.6%
- By 2050
- 196,810 · -5.9%
- By 2075
- 169,454 · -19.0%
- By 2100
- 136,630 · -34.7%
Race, ethnicity, and origin ACS 2023
- Neighborhood character
- Predominantly White (76%)
- Race & ethnicity
- White 76% Hispanic / Latino 16% Two or more races 10% Native American 1%
- Hispanic origin (detail)
- Mexican 12%
- Common ancestry
- Lithuanian 3% Slovak 2% Portuguese 2%
- Foreign-born
- 6% · Canada
- Languages at home
- 92% English-only · Spanish 7%
Political lean MEDSL · Mohave
- 2024 margin
- Solid R (+55.8) · D 21.8% · R 77.6%
- 2008→2024 swing
- -22.9pp toward R · 2008: -32.9pp · 2024: -55.8pp
- All cycles
- 2024: R+55.8 2020: R+51.3 2016: R+51.5 2012: R+42.6 2008: R+32.9
Not yet ingested
- Civics
- —
Market trends
- HPI YoY
- ▼ -158.90%
- Current HPI
- 280.1884
- Rent YoY
- ▲ 0.33%
- Metro
- Lake Havasu City-Kingman, AZ
- State GDP YoY
- ▲ 4.54%
- F500 in state
- 20
Industry mix (Fortune 500 HQ in AZ)
| Industry | F500 HQs | Revenue |
|---|---|---|
| Technology | 2 | $13B |
|
||
| Mining / Metals | 1 | $23B |
|
||
| Environmental Services | 1 | $16B |
|
||
| Metals / Steel | 1 | $14B |
|
||
| Technology Distribution | 1 | $9B |
|
||
| Homebuilding | 1 | $8B |
|
||
Price history
+1691.5% since first listed17 events — show timeline
- 2026-06-12 Sold (MLS) $232,900 WARDEX
- 2026-06-01 Pending — WARDEX
- 2026-05-15 Price Changed $234,900 WARDEX
- 2026-05-08 Price Changed $250,000 WARDEX
- 2026-05-07 Price Changed $255,000 WARDEX
- 2026-04-21 Listed $259,000 WARDEX
- 2023-04-14 Sold (Public Records) $214,900 Public Records
- 2023-04-14 Sold (MLS) $214,900 WARDEX
- 2023-02-09 Listed $209,900 WARDEX
- 2023-02-09 Delisted — WARDEX
- 2022-12-27 Relisted — WARDEX
- 2022-12-11 Contingent — WARDEX
- 2022-10-07 Listed $224,900 WARDEX
- 2005-07-11 Sold (Public Records) $150,500 Public Records
- 2002-08-29 Sold (Public Records) $88,000 Public Records
- 1997-04-25 Sold (Public Records) $78,000 Public Records
- 1996-08-02 Sold (Public Records) $13,000 Public Records
Property tax history
+0.7%/yrLatest (2025): $598 · -0.2% YoY. Source: county tax records.
Cash-flow waterfall
monthlySold comps — $/sqft
last 12 mo · ≤1 miLoading sold comps…