 Fourplex
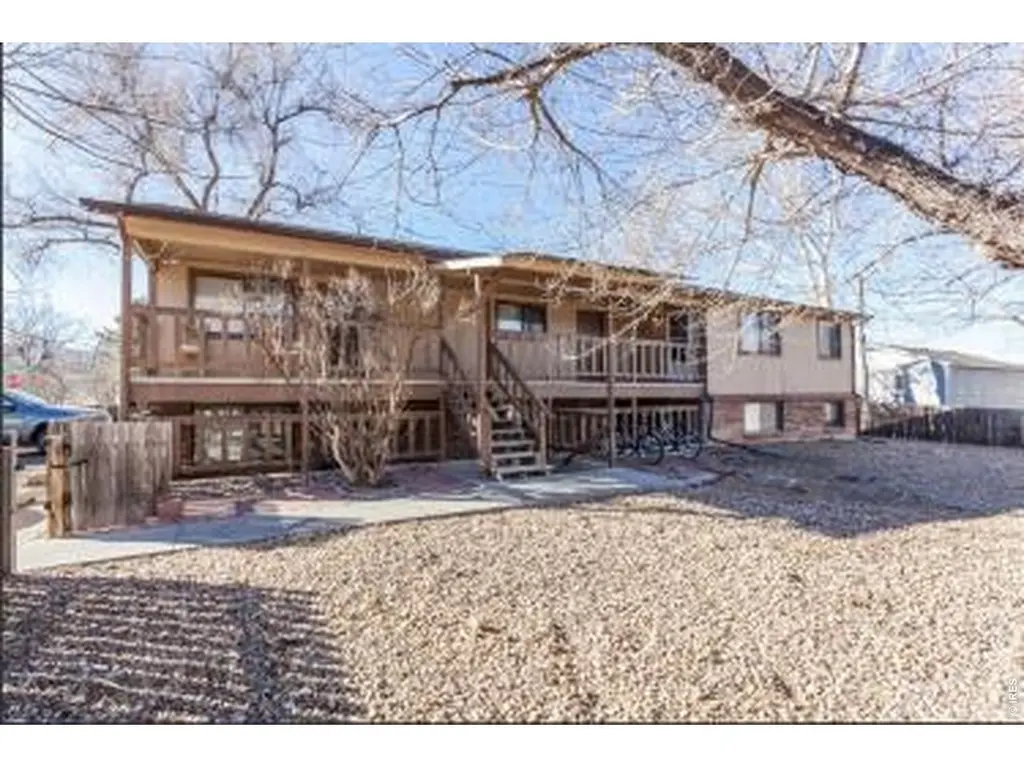
1244 Maple St · Fort Collins, CO
Flood risk 1/10 · Minimal
- FEMA flood zone
- X (unshaded)
- Chance of flooding over 30 yrs
- 0.0%
- Est. flood insurance / yr
- $473 – $860
Fire risk 6/10 · Moderate
- Est. fire insurance / yr
- $939 – $1,743
Heat risk 3/10 · Minor
- Hot days now (above 91°F)
- 7 days/yr
- Hot days in 30 yrs
- 17 days/yr
Wind risk 1/10 · Minimal
- Chance of severe wind over 30 yrs
- —
Air-quality risk 6/10 · Moderate
- Unhealthy air days now
- 13 days/yr
- Unhealthy air days in 30 yrs
- 13 days/yr
Risk factors via First Street. Map © Google.
Why this score? — see what drove the D- grade
The composite is a weighted blend of 9 inputs, each scored 0–100. Each bar is that input's sub-score; the figure is the points it added to the 100-point composite (weight × sub-score).
- Cash flow +11.8/30.0
- Schools +4.5/10.0
- Livability +4.0/5.0
- Rent growth +3.8/5.0
- DSCR +3.5/10.0
- ARV discount +3.4/15.0
- 1% rule +2.5/10.0
- Condition / age +2.5/5.0
- Appreciation +0.0/10.0
$950,000
🖨 Deal sheet (PDF) 📄 Offer letter ✓ Due diligence
Multi-family units
County records classify this as Multi-Family (2-4 Unit). Listing-text estimate: 4 units. confirmed
Listing remarks
Income-Producing 4-PlexPrime In-Town Location with Strong Rental Appeal. This well-maintained fourplex offers a strong investment opportunity in a highly desirable Fort Collins location, steps from Putnam Elementary School and minutes from Colorado State University and Downtown. The property benefits from consistent tenant appeal driven by its proximity to campus, neighborhood amenities, and everyday conveniences. Each unit features a functional 2-bedroom, 1-bath layout with durable finishes designed for easy ownership and long-term performance. With its central location and strong rental fundamentals, this property is well-positioned for investors seeking stability and sustained demand. Fo
Key facts
- 9,147 sq ft lot
- 5 parking spots
- Built 1980
Property features AI
Finance
- Financial info: Total of 4 units; Gross income reported: $78,960; Net operating income reported: $63,901; Income includes rents/leases and laundry; Tenants pay deposit and electricity
Exterior
- Parking: 5 total parking spaces; 1 space per unit
- Utilities: City water with meter; Public sewer; Natural gas available (Xcel); Electricity available with separate meters; Cable available; High-speed internet available; Trash service: Ram Waste
- Home design: Bi-level design; Residential income property — multi-family
- Construction: Frame construction; Composition roof
- Exterior features: Private hot tub; Partial fencing; Paved lot with curbs, gutters, sidewalks, and street light; Asphalt road access; Minimal flood risk (C rating)
Interior
- Kitchen: Electric range; Dishwasher; Refrigerator
- Bedrooms: Four 2-bedroom units (each unit has 2 bedrooms)
- Bathrooms: Four 1-bath units (each unit has 1 bathroom)
- Heating & cooling: Baseboard heating
- Interior features: Window coverings; Fire alarm
- Laundry & utility: On-site laundry included in income
Neighborhood map
What this means for you Summary
Snapshot
- This is a 4 × 2-bed/1.0-bath units multifamily listed at $950k.
Deal economics
- At list price, monthly cash flow is $-268 ($-3k/yr) — negative. Per door: $-67/mo.
- To cash-flow at today's rent, offer at most $903k (5.0% below list).
- To meet the 1% rule (rent ≥ 1% of price), the offer needs to be $711k (25.1% below list).
- Recommended offer: $711k (25.1% below list) — sets the bar for 1% rule.
- Cap rate 6.0% vs local median 2.6% in Fort Collins — top-decile yield for the area; either an underpriced asset or a hidden risk that comps aren't pricing in. Stress-test before assuming the spread holds.
Location & tenants
- Location reads 80/100 on livability (#11 in CO, #1,750 nationally) — a professional / high-income tenant draw. Strengths: amenities A+, commute A+, health & safety A+; Watch: cost of living F.
- Poudre School District R-1 (urban): math 45% / reading 60% proficiency, ranked #10 of 86 in CO (top 12%) — acceptable for families but not a draw, mixed tenant base, ~2y average lease.
- Zoned schools: Putnam Elementary School (math 5% / reading 17%, grade F, #879 of 966 statewide, top 94%, 306 students, 88% FRL); Kinard Core Knowledge Middle School (math 61% / reading 77%, grade A, #8 of 270 statewide, top 3%, 748 students, 7% FRL); Poudre High School (math 36% / reading 59%, grade D, #131 of 381 statewide, top 34%, 1,663 students, 38% FRL) — zoned schools average 45% FRL vs 24% district-wide (20 pts higher); higher-poverty schools than district average — tighter screening recommended.
- Market conditions: Rents rising fast (+5.0%/yr); 117 active listings in the ZIP; 1,786 units permitted in Larimer County in 2024 (402 in 5+ unit buildings).
- At $7,112/mo this rent would consume 147% of the median local household income ($58k/yr) (locally 3630% of renters already pay >50% of income on rent) — very limited rent-growth headroom before tenants either downsize or default.
Forward outlook
- Local home prices are declining (-3.0%/yr); year-one equity from $7k of loan paydown is wiped out by about $28k of value loss. Plan a longer hold.
- Larimer County population projected at +51% by 2050 — long-run rental-demand tailwind backs the buy-and-hold thesis.
Negotiation context
- It's been on market 44 days — a 3% lower offer ($922k) is reasonable based on typical stale-listing flexibility.
- 4 sale attempts since 28y ago; this cycle's ask is 59461% above the opening price — seller raised mid-cycle; expect resistance to lowballs.
- Current owner paid $613k; list at $950k implies a 55% gain — meaningful room to come down on a strong offer.
Risks & watch-outs
- Climate carrying-cost: major wildfire risk — expect insurance premiums to compound above CPI over the hold.
Questions for the listing agent
- What do current leases actually rent for vs. the listed asking? Can we see a recent rent roll and the last 12 months of T-12 income?
- It's been on market 44 days. Have you received any prior offers? Is the seller open to a 25% concession, seller financing, or rate buy-down credit?
- Can we see the unit-by-unit rent roll, current vacancy, and any below-market leases? What's the average tenancy length?
- What capital expenditures (roof, boiler, parking lot, exteriors) have been made in the last 5 years, and what's planned in the next 2?
- Is there a deadline driving the sale (1031 exchange, divorce, estate, relocation)? That informs how much negotiation room exists.
- Schools are B-rated — typically a magnet for longer-tenancy family renters. What's the average tenant stay here, and is there a school-zone premium baked into asking?
- The area grade is low — what's the realistic commute time and amenity access for the typical tenant pool here? Any planned neighborhood developments (good or bad) we should know about?
- What's the average days-on-market for RENTAL listings here right now (not sales)? A rising rental-DOM trend means longer vacancies and softer asking-rent achievability than the comps imply.
- What's the recent tenant-quality profile in this submarket — average credit score on applications, eviction rate, late-payment / NSF rate, and stable-employment percentage? A property-management company in the area should have these aggregated.
- How much new apartment / multifamily construction is in the pipeline within 1–3 miles? Heavy new supply (>2% of stock underway) typically softens rents 12–24 months out; light construction supports rent growth.
Investment metrics
- 1% rule
- 0.75% ✗
- Cap rate
- 5.95%
- Cash-on-cash
- -1.21%
- DSCR
- 0.95
- GRM
- 11.1
CMA / ARV
- ARV (on-the-fly)
- $870,912
- Comps found
- 1
Show comp detail 1 sale within ~0.75 mi
| Address | Dist | Beds/Ba | Sqft | Sold | Price | $/sf | Match |
|---|---|---|---|---|---|---|---|
| 701 Aztec Dr | 0.33mi | 8/4.0 | 3,072 (-11%) | 4mo | $775,000 | $252 | 63 |
Match score weights: distance 35% · size 25% · config 20% · recency 20%. Top-matched comps best support the ARV.
Projected returns pro-forma
-3.0% appreciation · 5.0% rent growth · sell at horizon
- IRR
- -16.3%
- Equity multiple
- 0.41×
- Total profit
- $-156,717
- Equity at exit
- $141,648
- IRR
- -5.2%
- Equity multiple
- 0.63×
- Total profit
- $-97,297
- Equity at exit
- $82,139
Cash invested: $266,000 (down + closing). Projections, not guarantees.
Landlord ↔ Tenant lean methodology
- Overall (STATE)
- 38 Tenant-Leaning
- State Colorado
- 38 Tenant-Leaning · D+4
- County
- — inherits STATE
- City
- — inherits STATE
ZIP-level market 80521
- Rents YoY
- 5.0%
- Active inventory
- 117
- Price-to-rent
- 44.5×
Monthly cashflow live
- Estimated rent
- $7,112 high interval (Pro) →
- Mortgage (P&I)
- −$4,982
- Tax from tax record
- −$509 /mo · $6,104/yr
- Insurance
- −$396
- HOA
- −$0
- Vacancy / Maint / Mgmt
- −$1,494
- Net cashflow
- $-268
Break-even live
Sensitivity live
| Price | -10% $270 | -5% $1 | +0% $-268 | +5% $-537 | +10% $-806 |
|---|---|---|---|---|---|
| Rent | -10% $-830 | -5% $-549 | +0% $-268 | +5% $13 | +10% $294 |
| Rate | -1.0pp $211 | -0.5pp $-26 | base $-268 | +0.5pp $-514 | +1.0pp $-765 |
4-unit breakdown (identical units grouped — click to expand)
| Units | Beds | Baths | Est. rent |
|---|---|---|---|
| 4× units | 2 | 1 | $7,112 |
| #1 | 2 | 1 | $1,778 |
| #2 | 2 | 1 | $1,778 |
| #3 | 2 | 1 | $1,778 |
| #4 | 2 | 1 | $1,778 |
| Total (4 units) | $7,112 | ||
UW: 25.0% down · 7.5% · 30yr · 1.5% tax · 5.0% vac · 8.0% maint · 8.0% mgmt
Financing live
Cash to close
- Down payment
- $237,500
- Closing costs
- $28,500
- Reserves months
- —
- Total cash needed
- —
Loan-product check · same deal, 3 products live
Conventional
25% down · 7.5% · 30yr
- Down + closing
- —
- Monthly P&I
- —
- Monthly cashflow
- —
- DSCR
- —
- Eligible?
- —
Personal DTI + credit; lowest rate.
DSCR
20% down · 8.5% · 30yr
- Down + closing
- —
- Monthly P&I
- —
- Monthly cashflow
- —
- DSCR
- —
- Eligible?
- —
No personal income docs; deal must DSCR.
Hard money
10% down · 12.0% · 12mo
- Down + closing
- —
- Monthly P&I
- —
- Monthly cashflow
- —
- DSCR
- —
- Eligible?
- —
Short-term bridge; refi at stabilization.
Listing history 25 events
-
2026-06-21days on market $950,000 Active 44 DOM
-
2026-06-18days on market $950,000 Active 41 DOM
-
2026-06-17days on market $950,000 Active 40 DOM
-
2026-06-16days on market $950,000 Active 39 DOM
-
2026-06-15days on market $950,000 Active 38 DOM
-
2026-06-14days on market $950,000 Active 36 DOM
-
2026-06-10days on market $950,000 Active 33 DOM
-
2026-06-09days on market $950,000 Active 32 DOM
-
2026-06-08days on market $950,000 Active 31 DOM
-
2026-06-07days on market $950,000 Active 30 DOM
-
2026-06-03days on market $950,000 Active 26 DOM
-
2026-06-02days on market $950,000 Active 25 DOM
-
2026-06-01days on market $950,000 Active 24 DOM
-
2026-05-31days on market $950,000 Active 23 DOM
-
2026-05-30days on market $950,000 Active 22 DOM
-
2026-05-10$1,595
-
2026-05-08$950,000 Active
-
2024-06-05historical $1,525
-
2024-05-10$1,525
-
2023-07-24historical
-
2018-06-14soldstatus $613,000
-
2009-04-02soldstatus $340,000
-
1998-08-24soldstatus $249,500
-
1998-08-01soldstatus $249,500
-
1998-02-01$259,700
ⓘ Source: listings_history table (triggers on properties + properties_extension) + one-shot
backfill from property_details.listing_events for pre-trigger history.
Tax reassessment forecast CO · Resets to sale price
- Current annual tax
- $6,104 · $509/mo
- Projected year-2 tax
- $6,104 · $509/mo
- Expected delta
- $0/yr ($0/mo · 0.0%)
ⓘ Screening estimate from a state-policy table — verify with the county assessor before closing.
Climate risk First Street
- Flood 1/10 Low FEMA zone X (unshaded) · 0% chance over 30 yrs
- Wildfire 6/10 Major
- Heat 3/10 Moderate 7 d/yr ≥91°F today · 17 d/yr by 30 yrs out
- Wind 1/10 Low
- Air quality 6/10 Major 13 unhealthy d/yr today · 13 by 30 yrs out
Nearby sold comps map
Loading sold comps map…
Walkable amenities ~0.75 mi
Loading nearby amenities…
Taxation est. · year 1
- Rental income
- $85,344
- − Mortgage interest
- −$53,215
- − Property taxes
- −$6,104
- − Insurance
- −$4,750
- − Repairs & maintenance
- −$6,828
- − Management
- −$6,828
- − Depreciation
- −$27,636
- Taxable loss
- −$20,016
- Est. tax savings @ 24.0%
- +$4,804
- After-tax cash flow
- $1,589/yr
For passive investors: Depreciation is non-cash, so a rental often shows a tax loss while cash-flowing — sheltering income. Rental losses are passive: they offset passive income freely, and up to $25,000/yr can offset ordinary (W-2) income if you actively participate and your MAGI is under $100k (phasing out to $0 by $150k); unused losses carry forward. On sale, claimed depreciation is recaptured at up to 25%, and gains may owe capital-gains tax (a 1031 exchange can defer both). Figures are a year-1 estimate at your 24.0% rate — not tax advice; consult a CPA.
Schools (NCES district)
- District
- Poudre School District R-1
- NCES district ID
- 0803990
- Math proficiency
- 45% ▼ -7.00%
- Reading proficiency
- 60% ▼ -2.00%
- Median HH income
- $57,281
- Composite
- 45.5/100
- National rank
- #2610
- State rank
- #10 of 86 in CO
Livability — Fort Collins
- Score
- 80/100
- State rank
- #11
- US rank
- #1750
Category grades
Schools grade is shown separately in the Schools card above.
Census & demographics
- Census place
- Fort Collins, CO
- County
- Larimer County · 338,255 people
- City population
- 202,303
- Metro
- Fort Collins, CO
- Population (ZIP)
- 38,776
- Household income
- $58,082
- Rent vs Own
- Severe rent burden
- 3630.0
Population outlook (Larimer County) Hauer SSP2
- Today (2025)
- 415,361 people
- By 2030
- 457,762 · +10.2%
- By 2040
- 542,310 · +30.6%
- By 2050
- 627,048 · +51.0%
- By 2075
- 833,722 · +100.7%
- By 2100
- 952,590 · +129.3%
Race, ethnicity, and origin ACS 2023
- Neighborhood character
- Predominantly White (78%)
- Race & ethnicity
- White 78% Hispanic / Latino 11% Two or more races 8% Asian 4% Black 2% Native American 1%
- Hispanic origin (detail)
- Mexican 6%
- Common ancestry
- Portuguese 3% Italian 3% Slovak 3%
- Foreign-born
- 5% · China, Canada
- Languages at home
- 91% English-only · Spanish 5% Chinese 1% French/Haitian/Cajun 1%
Political lean MEDSL · Larimer
- 2024 margin
- D (+17.6) · D 57.4% · R 39.8% · Other 2.9%
- 2008→2024 swing
- +7.9pp toward D · 2008: 9.7pp · 2024: 17.6pp
- All cycles
- 2024: D+17.6 2020: D+15.4 2016: D+4.9 2012: D+5.2 2008: D+9.7
Not yet ingested
- Civics
- —
Market trends
- HPI YoY
- ▼ -686.60%
- Current HPI
- 301.4833
- Rent YoY
- ▲ 5.00%
- Metro
- Fort Collins, CO
- State GDP YoY
- ▲ 1.95%
- F500 in state
- 14
Industry mix (Fortune 500 HQ in CO)
| Industry | F500 HQs | Revenue |
|---|---|---|
| Technology Distribution | 1 | $31B |
|
||
| Food / Agriculture | 1 | $18B |
|
||
| Packaging | 1 | $14B |
|
||
| Healthcare | 1 | $13B |
|
||
| Energy | 1 | $10B |
|
||
| Technology | 1 | $4B |
|
||
Price history
-99.4% since first listed10 events — show timeline
- 2026-05-10 Listed for Rent $1,595 APPFOLIO
- 2026-05-08 Listed $950,000 IRES
- 2024-06-05 Rental Removed $1,525 APPFOLIO
- 2024-05-10 Listed for Rent $1,525 APPFOLIO
- 2023-07-24 Rental Removed — APPFOLIO
- 2018-06-14 Sold (Public Records) $613,000 Public Records
- 2009-04-02 Sold (Public Records) $340,000 Public Records
- 1998-08-24 Sold (MLS) $249,500 IRES
- 1998-08-01 Sold (Public Records) $249,500 Public Records
- 1998-02-01 Listed $259,700 IRES
Property tax history
+6.2%/yrLatest (2025): $6,104 · +12.4% YoY. Source: county tax records.
Cash-flow waterfall
monthlySold comps — $/sqft
last 12 mo · ≤1 miLoading sold comps…