3311 NW 24th Ave · Okeechobee, FL
Flood risk 1/10 · Minimal
- FEMA flood zone
- A
- Chance of flooding over 30 yrs
- 0.0%
- Est. flood insurance / yr
- $1,009 – $1,996
Fire risk 3/10 · Minor
- Est. fire insurance / yr
- $947 – $1,759
Heat risk 9/10 · Severe
- Hot days now (above 107°F)
- 7 days/yr
- Hot days in 30 yrs
- 24 days/yr
Wind risk 10/10 · Severe
- Chance of severe wind over 30 yrs
- 99.0%
Air-quality risk 1/10 · Minimal
- Unhealthy air days now
- 0 days/yr
- Unhealthy air days in 30 yrs
- 0 days/yr
Risk factors via First Street. Map © Google.
Why this score? — see what drove the B- grade
The composite is a weighted blend of 9 inputs, each scored 0–100. Each bar is that input's sub-score; the figure is the points it added to the 100-point composite (weight × sub-score).
- Cash flow +25.6/30.0
- ARV discount +15.0/15.0
- DSCR +8.5/10.0
- 1% rule +5.8/10.0
- Livability +3.9/5.0
- Schools +3.6/10.0
- Rent growth +2.5/5.0
- Condition / age +2.5/5.0
- Appreciation +2.0/10.0
$191,400
🖨 Deal sheet 📄 Offer letter ✓ Due diligence
Listing remarks
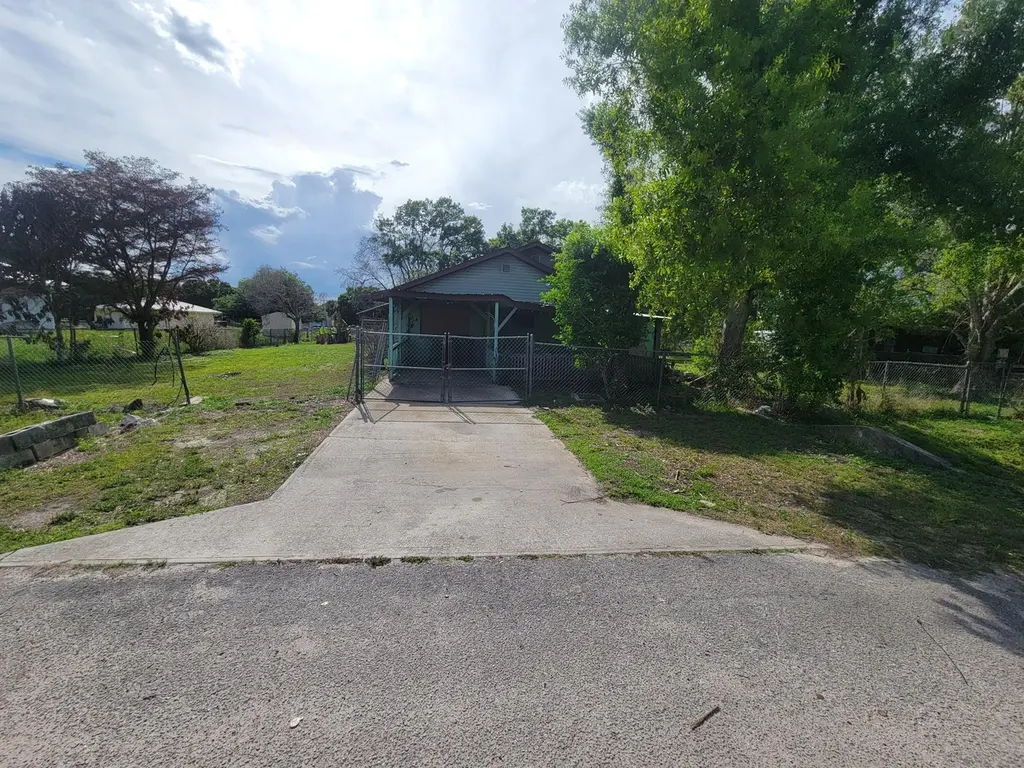
Located in the Basswood this 4 bedroom 2 bathroom 1,545 square foot home is situated on a large lot. Key features in covered entries, large covered front patio, fenced lot, shed, large living room, and separate kitchen. With some updates and a good cleaning this could be an amazing home. Bank Owned. Call today to schedule a showing.
Key facts
- Covered entries
- Separate kitchen
- Large lot
Tags
Property features AI
Finance
- Other: Pets allowed with no restrictions
Exterior
- Parking: Driveway with space for 2 vehicles
- Utilities: Well water; Septic tank; Electricity available
- Home design: Single-family residence; One story; Resale property; Entry level: One
- Construction: CBS construction; Shingle roof; Slab foundation; Built as a single-story structure
- Exterior features: East-facing; Not waterfront
Interior
- Bedrooms: 3 bedrooms on the main level
- Flooring: Tile and other flooring types
- Bathrooms: 2 full bathrooms on the main level
- Heating & cooling: Central electric heating; Central air conditioning
- Interior features: High ceilings; Unfurnished
Neighborhood map
What this means for you Summary
Snapshot
- This is a 3-bed/2.0-bath single-family listed at $191k.
Deal economics
- At list price, monthly cash flow is $330 ($4k/yr) — positive.
- The deal already cash-flows at list — no discount required.
- Meets the 1% rule at list price ($2k rent vs $191k).
- Recommended offer: $180k (6.0% below list) — sets the bar for market timing.
- Cap rate 9.1% vs local median 4.3% in Okeechobee — top-decile yield for the area; either an underpriced asset or a hidden risk that comps aren't pricing in. Stress-test before assuming the spread holds.
Location & tenants
- Location reads 77/100 on livability (#210 in FL, #3,234 nationally) — a middle-class / working-renter tenant base. Strengths: cost of living A+, housing A+, health & safety A+; Watch: employment C-, amenities F, commute F.
- Okeechobee (town): math 44% / reading 42% proficiency, ranked #58 of 73 in FL (top 80%) — families likely to look elsewhere, expect single-tenant / working-renter base with shorter leases; 72% free/reduced lunch — lower-income household profile, screen leases tightly.
- Zoned schools: Seminole Elementary School (math 57% / reading 54%, grade C, #855 of 2,144 statewide, top 41%, 502 students, 75% FRL); Yearling Middle School (math 45% / reading 32%, grade F, #384 of 571 statewide, top 68%, 668 students, 70% FRL); Okeechobee High School (math 30% / reading 42%, grade F, #359 of 667 statewide, top 55%, 1,692 students, 62% FRL) — zoned schools at 69% FRL track the district average.
- Market conditions: 644 active listings in the ZIP; 18 units permitted in Okeechobee County in 2024 (0 in 5+ unit buildings).
Forward outlook
- Local home prices are declining (-3.0%/yr); year-one equity from $1k of loan paydown is wiped out by about $6k of value loss. Plan a longer hold.
- Okeechobee County population projected at -21% by 2050 — secular population decline; favor cash flow + early exit over multi-decade hold.
Negotiation context
- It's been on market 73 days — a 6% lower offer ($180k) is reasonable based on typical stale-listing flexibility.
- 2 sale attempts; this cycle's ask has dropped $17k (8%) from the opening price — seller is motivated, your offer sets the floor, not the list.
- Current owner paid $76k; list at $191k implies a 152% gain — meaningful room to come down on a strong offer.
Risks & watch-outs
- Watch-outs: flood insurance adds $125/mo.
- Climate carrying-cost: in FEMA flood zone A (mandatory federal flood insurance); severe wind risk, 99% chance of damaging wind over 30y; extreme-heat days projected 7→24/yr by 2055 (HVAC capex compounding) — expect insurance premiums to compound above CPI over the hold.
Questions for the listing agent
- It's been on market 73 days. Have you received any prior offers? Is the seller open to a 6% concession, seller financing, or rate buy-down credit?
- What's the actual annual flood-insurance premium (NFIP or private), and is the property in a SFHA with mandatory coverage?
- Why hasn't it sold? Are there any deal-killer items the seller is aware of (foundation, flood, title, zoning, code violations)?
- Is there a deadline driving the sale (1031 exchange, divorce, estate, relocation)? That informs how much negotiation room exists.
- What's the average days-on-market for RENTAL listings here right now (not sales)? A rising rental-DOM trend means longer vacancies and softer asking-rent achievability than the comps imply.
- What's the recent tenant-quality profile in this submarket — average credit score on applications, eviction rate, late-payment / NSF rate, and stable-employment percentage? A property-management company in the area should have these aggregated.
- How much new for-sale + rental construction is in the pipeline within 1–3 miles? Heavy new supply typically softens prices + rents 12–24 months out; constrained supply supports both.
Investment metrics
- 1% rule
- 1.08% ✓
- Cap rate
- 9.15%
- Cash-on-cash
- 10.19%
- DSCR
- 1.45
- GRM
- 7.7
CMA / ARV
- ARV (on-the-fly)
- $325,995
- Comps found
- 11
Show comp detail 11 sales within ~0.75 mi
| Address | Dist | Beds/Ba | Sqft | Sold | Price | $/sf | Match |
|---|---|---|---|---|---|---|---|
| 3269 NW 24th Ave | 0.02mi | 3/2.0 | 1,601 (+4%) | 4mo | $337,500 | $211 | 90 |
| 3845 NW 27th Ave | 0.39mi | 3/2.0 | 1,534 (-1%) | 6mo | $350,000 | $228 | 75 |
| 3897 NW 22nd Ave | 0.38mi | 3/2.0 | 1,456 (-6%) | 0mo | $337,900 | $232 | 72 |
| 3572 NW 19th Ave | 0.37mi | 3/2.0 | 1,519 (-2%) | 21mo | $345,000 | $227 | 62 |
| 3268 NW 20th Ave | 0.27mi | 3/2.0 | 1,485 (-4%) | 22mo | $345,000 | $232 | 62 |
| 3573 NW 28th Ave | 0.29mi | 3/2.0 | 1,607 (+4%) | 21mo | $338,000 | $210 | 62 |
| 3670 NW 27th Ave | 0.27mi | 4/2.0 (+1) | 1,495 (-3%) | 20mo | $272,000 | $182 | 61 |
| 3268 NW 29th Ave | 0.27mi | 3/2.0 | 1,333 (-14%) | 5mo | $284,000 | $213 | 60 |
| 3817 NW 35th Ave | 0.75mi | 4/2.0 (+1) | 1,536 (-1%) | 10mo | $232,500 | $151 | 51 |
| 2987 NW 33rd Ave | 0.58mi | 3/2.0 | 1,723 (+12%) | 7mo | $315,000 | $183 | 48 |
| 3966 NW 17th Ave | 0.61mi | 3/2.0 | 1,388 (-10%) | 21mo | $205,000 | $148 | 37 |
Match score weights: distance 35% · size 25% · config 20% · recency 20%. Top-matched comps best support the ARV.
Projected returns pro-forma
-3.0% appreciation · 3.0% rent growth · sell at horizon
- IRR
- -5.0%
- Equity multiple
- 0.81×
- Total profit
- $-9,972
- Equity at exit
- $28,538
- IRR
- 4.7%
- Equity multiple
- 1.34×
- Total profit
- $18,472
- Equity at exit
- $16,549
Cash invested: $53,592 (down + closing). Projections, not guarantees.
Landlord ↔ Tenant lean methodology
- Overall (STATE)
- 87 Strongly Landlord-Friendly
- State Florida
- 87 Strongly Landlord-Friendly · R+3
- County
- — inherits STATE
- City
- — inherits STATE
ZIP-level market 34972
- Home prices YoY
- -1.5%
- Active inventory
- 644
- Price-to-rent
- 7.7×
Monthly cashflow live
- Estimated rent
- $2,072 medium interval (Pro) →
- Mortgage (P&I)
- −$1,004
- Tax from tax record
- −$98 /mo · $1,180/yr
- Insurance
- −$80
- Flood insurance flood zone
- −$125 /mo · $1,502/yr
- HOA
- −$0
- Vacancy / Maint / Mgmt
- −$435
- Net cashflow
- $330
Break-even live
UW: 25.0% down · 7.5% · 30yr · 1.5% tax · 5.0% vac · 8.0% maint · 8.0% mgmt
Financing live
Cash to close
- Down payment
- $47,850
- Closing costs
- $5,742
- Reserves months
- —
- Total cash needed
- —
Loan-product check · same deal, 3 products live
Conventional
25% down · 7.5% · 30yr
- Down + closing
- —
- Monthly P&I
- —
- Monthly cashflow
- —
- DSCR
- —
- Eligible?
- —
Personal DTI + credit; lowest rate.
DSCR
20% down · 8.5% · 30yr
- Down + closing
- —
- Monthly P&I
- —
- Monthly cashflow
- —
- DSCR
- —
- Eligible?
- —
No personal income docs; deal must DSCR.
Hard money
10% down · 12.0% · 12mo
- Down + closing
- —
- Monthly P&I
- —
- Monthly cashflow
- —
- DSCR
- —
- Eligible?
- —
Short-term bridge; refi at stabilization.
Listing history 20 events
-
2026-06-19days on market $191,400 Active 73 DOM
-
2026-06-18days on market $191,400 Active 72 DOM
-
2026-06-17days on market $191,400 Active 71 DOM
-
2026-06-16days on market $191,400 Active 70 DOM
-
2026-06-15days on market $191,400 Active 69 DOM
-
2026-06-14days on market $191,400 Active 67 DOM
-
2026-06-10days on market $191,400 Active 64 DOM
-
2026-06-09days on market $191,400 Active 63 DOM
-
2026-06-08days on market $191,400 Active 62 DOM
-
2026-06-07days on market $191,400 Active 61 DOM
-
2026-06-05days on market $191,400 Active 58 DOM
-
2026-06-03pricedays on market $191,400 Active 57 DOM
-
2026-06-02days on market $208,000 Active 56 DOM
-
2026-06-01days on market $208,000 Active 55 DOM
-
2026-05-31days on market $208,000 Active 54 DOM
-
2026-05-30days on market $208,000 Active 53 DOM
-
2026-04-06$208,000 Active
-
2025-12-29$5,000 Active
-
2001-07-03soldstatus $76,000
-
1997-01-01soldstatus $65,000
ⓘ Source: listings_history table (triggers on properties + properties_extension) + one-shot
backfill from property_details.listing_events for pre-trigger history.
Tax reassessment forecast FL · Resets to sale price
- Current annual tax
- $1,180 · $98/mo
- Projected year-2 tax
- $1,589 · $132/mo
- Expected delta
- +$409/yr (+$34/mo · 34.6%)
ⓘ Screening estimate from a state-policy table — verify with the county assessor before closing.
Climate risk First Street
- Flood 1/10 Low FEMA zone A · 0% chance over 30 yrs
- Wildfire 3/10 Moderate
- Heat 9/10 Extreme 7 d/yr ≥107°F today · 24 d/yr by 30 yrs out
- Wind 10/10 Extreme 99% chance of damaging wind over 30 yrs
- Air quality 1/10 Low 0 unhealthy d/yr today · 0 by 30 yrs out
Nearby sold comps map
Loading sold comps map…
Walkable amenities ~0.75 mi
Loading nearby amenities…
Taxation est. · year 1
- Rental income
- $24,867
- − Mortgage interest
- −$10,721
- − Property taxes
- −$1,180
- − Insurance
- −$2,460
- − Repairs & maintenance
- −$1,989
- − Management
- −$1,989
- − Depreciation
- −$5,568
- Taxable income
- $959
- Est. tax owed @ 24.0%
- −$230
- After-tax cash flow
- $3,730/yr
For passive investors: Depreciation is non-cash, so a rental often shows a tax loss while cash-flowing — sheltering income. Rental losses are passive: they offset passive income freely, and up to $25,000/yr can offset ordinary (W-2) income if you actively participate and your MAGI is under $100k (phasing out to $0 by $150k); unused losses carry forward. On sale, claimed depreciation is recaptured at up to 25%, and gains may owe capital-gains tax (a 1031 exchange can defer both). Figures are a year-1 estimate at your 24.0% rate — not tax advice; consult a CPA.
Schools (NCES district)
- District
- Okeechobee
- NCES district ID
- 1201410
- Math proficiency
- 44% ▼ -12.00%
- Reading proficiency
- 42% ▼ -4.00%
- Median HH income
- $36,710
- Composite
- 35.73/100
- National rank
- #4855
- State rank
- #58 of 73 in FL
Livability — Okeechobee
- Score
- 77/100
- State rank
- #210
- US rank
- #3234
Category grades
Schools grade is shown separately in the Schools card above.
Census & demographics
- City population
- 23,975
- Population (ZIP)
- 19,185
Population outlook (Okeechobee County) Hauer SSP2
- Today (2025)
- 37,273 people
- By 2030
- 35,885 · -3.7%
- By 2040
- 32,931 · -11.6%
- By 2050
- 29,433 · -21.0%
- By 2075
- 19,607 · -47.4%
- By 2100
- 11,814 · -68.3%
Race, ethnicity, and origin ACS 2023
- Neighborhood character
- Diverse neighborhood (Simpson 0.62)
- Race & ethnicity
- White 52% Hispanic / Latino 30% Black 14% Two or more races 14%
- Hispanic origin (detail)
- Mexican 24% Puerto Rican 1% Cuban 1%
- Common ancestry
- Lithuanian 3% Slovak 1% Romanian 1%
- Foreign-born
- 12% · Canada, Dominican Republic
- Languages at home
- 77% English-only · Spanish 22% Other Indo-European 0%
Political lean MEDSL · Okeechobee
- 2024 margin
- Solid R (+53.8) · D 22.9% · R 76.7%
- 2008→2024 swing
- -34.6pp toward R · 2008: -19.2pp · 2024: -53.8pp
- All cycles
- 2024: R+53.8 2020: R+44.4 2016: R+39.5 2012: R+20.0 2008: R+19.2
Not yet ingested
- Civics
- —
Market trends
- HPI YoY
- ▼ -5.94%
- Current HPI
- 389.1156
- Rent YoY
- —
- Metro
- —
- State GDP YoY
- ▲ 3.28%
- F500 in state
- 36
Industry mix (Fortune 500 HQ in FL)
| Industry | F500 HQs | Revenue |
|---|---|---|
| Industrial Technology | 2 | $29B |
|
||
| Insurance | 2 | $17B |
|
||
| Retail | 1 | $60B |
|
||
| Technology Distribution | 1 | $58B |
|
||
| Homebuilding | 1 | $35B |
|
||
| Technology Manufacturing | 1 | $35B |
|
||
Price history
+220.0% since first listed4 events — show timeline
- 2026-04-06 Listed $208,000 Beaches MLS
- 2025-12-29 Listed $5,000 NFMLS
- 2001-07-03 Sold (Public Records) $76,000 Public Records
- 1997-01-01 Sold (Public Records) $65,000 Public Records
Property tax history
+3.3%/yrLatest (2025): $1,180 · +4.1% YoY. Source: county tax records.
Cash-flow waterfall
monthlySold comps — $/sqft
last 12 mo · ≤1 miLoading sold comps…