 Multi-family
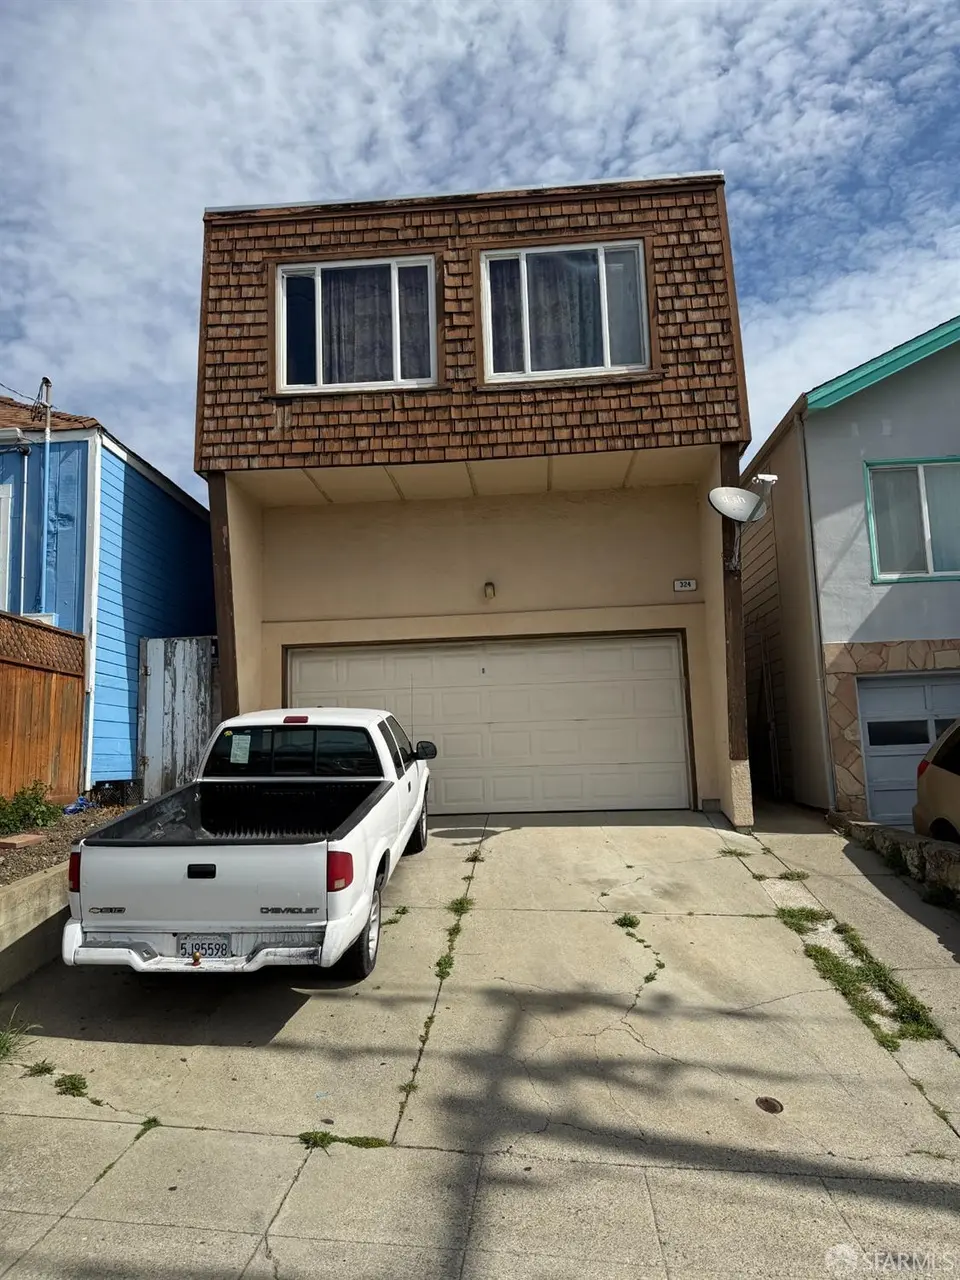
324 Railroad Ave · South San Francisco, CA
Flood risk 1/10 · Minimal
- FEMA flood zone
- X (unshaded)
- Chance of flooding over 30 yrs
- 0.0%
- Est. flood insurance / yr
- $507 – $1,088
Fire risk 5/10 · Moderate
- Est. fire insurance / yr
- $659 – $1,223
Heat risk 2/10 · Minimal
- Hot days now (above 78°F)
- 8 days/yr
- Hot days in 30 yrs
- 18 days/yr
Wind risk 1/10 · Minimal
- Chance of severe wind over 30 yrs
- —
Air-quality risk 7/10 · Major
- Unhealthy air days now
- 13 days/yr
- Unhealthy air days in 30 yrs
- 13 days/yr
Risk factors via First Street. Map © Google.
Why this score? — see what drove the B- grade
The composite is a weighted blend of 9 inputs, each scored 0–100. Each bar is that input's sub-score; the figure is the points it added to the 100-point composite (weight × sub-score).
- Cash flow +25.2/30.0
- ARV discount +15.0/15.0
- DSCR +8.3/10.0
- 1% rule +5.6/10.0
- Rent growth +4.0/5.0
- Schools +4.0/10.0
- Livability +3.2/5.0
- Condition / age +2.5/5.0
- Appreciation +0.0/10.0
$1,088,000
🖨 Deal sheet (PDF) 📄 Offer letter ✓ Due diligence
Multi-family units
County records classify this as Multi-Family (2-4 Unit). Listing-text estimate: 1 unit. estimate disagrees with records
Listing remarks
This is a great opportunity for investors! The property, built in 1978, is located within 3 blocks of Grand Avenue, the heart of downtown South San Francisco, with numerous restaurants, shops and public transportation. SSF is home to the biotech industry, and Silicon Valley is accessible via the nearby 101 freeway. The Costco Business Center is located just across the freeway, as is a retail Costco and gas station. The building is nestled on a hillside with a southwestern view. The property consists of one 1-bedroom unit and two 2-bedroom units on two levels. Each unit is carpeted, with some linoleum and vinyl flooring. Kitchens are equipped with electric stoves vented to the outside, dish
Key facts
- Dishwashers
- Southwestern view
- Garbage disposals
Tags
Property features AI
Units
- Unit 1: Apartment: one bedroom, one bathroom on the ground level
- Unit 2: Apartment: two bedrooms, one bathroom on the second floor
- Unit 3: Apartment: two bedrooms, one bathroom on the second floor
Finance
- Other: Living/building area reported as 3206 square feet; Lot size approximately 3,001 sq ft
- Financial info: Triplex with 3 total units, 3 units leased; 4 independent parking spaces for the property
- HOA & community: No association fee
Exterior
- Parking: Attached garage with 4 parking spaces; 4 total parking spaces
- Security: Carbon monoxide detector(s); Smoke detector(s)
- Utilities: Common area meter; Cable connected; City water; Public sewer; Electric available; Electric on property; Separate electric meters; Separate water meters and meter on site
- Home design: Residential income property (Triplex); Contemporary architectural style; Original condition; Built in 1978
- Construction: Shingle siding and stucco construction; Built in 1978
- Exterior features: Regular-shaped lot with sidewalk
Interior
- Kitchen: Free-standing electric range; Free-standing refrigerator; Garbage disposal
- Bedrooms: 5 bedrooms total (includes unit-level bedrooms described below)
- Flooring: Carpet; Laminate; Linoleum
- Bathrooms: 3 full bathrooms
- Heating & cooling: Gas water heater
- Interior features: Carpet, laminate, and linoleum flooring; Disposal; Gas water heater; Contemporary style interior elements
- Laundry & utility: Separate meters for utilities (see Utilities section)
Neighborhood map
What this means for you Summary
Snapshot
- This is a 5-bed/3.0-bath multifamily listed at $1.09M.
Deal economics
- At list price, monthly cash flow is $2k ($29k/yr) — positive.
- The deal already cash-flows at list — no discount required.
- Meets the 1% rule at list price ($12k rent vs $1.09M).
- Recommended offer: $1.07M (1.5% below list) — sets the bar for market timing.
- Cap rate 9.0% vs local median 2.1% in South San Francisco — top-decile yield for the area; either an underpriced asset or a hidden risk that comps aren't pricing in. Stress-test before assuming the spread holds.
Location & tenants
- Location reads 65/100 on livability (#372 in CA) — a middle-class / working-renter tenant base. Strengths: commute A+, employment A+; Watch: amenities F, cost of living F, health & safety F.
- South San Francisco Unified (urban): math 38% / reading 47% proficiency, ranked #176 of 517 in CA (top 34%) — families likely to look elsewhere, expect single-tenant / working-renter base with shorter leases.
- Zoned schools: Spruce Elementary (math 23% / reading 24%, grade F, #1,157 of 1,571 statewide, top 74%, 408 students, 61% FRL); Parkway Heights Middle (math 25% / reading 33%, grade F, #224 of 498 statewide, top 46%, 612 students, 55% FRL); South San Francisco High (math 37% / reading 64%, grade D+, #324 of 1,170 statewide, top 28%, 1,280 students, 41% FRL) — zoned schools average 52% FRL vs 33% district-wide (19 pts higher); higher-poverty schools than district average — tighter screening recommended.
- Market conditions: Rents rising fast (+6.0%/yr); 76 active listings in the ZIP; high-income renter base; 1,019 units permitted in San Mateo County in 2024 (484 in 5+ unit buildings).
- At $11,567/mo this rent would consume 102% of the median local household income ($137k/yr) (locally 2470% of renters already pay >50% of income on rent) — very limited rent-growth headroom before tenants either downsize or default.
Forward outlook
- Local home prices are declining (-3.0%/yr); year-one equity from $8k of loan paydown is wiped out by about $33k of value loss. Plan a longer hold.
- San Mateo County population projected at +24% by 2050 — long-run rental-demand tailwind backs the buy-and-hold thesis.
- At projected returns (-3.0% appreciation + 6.0% rent growth), your $305k cash investment doubles in ~9 years — after that, you're playing with house money.
Negotiation context
- It's been on market 28 days — a 2% lower offer ($1.07M) is reasonable based on typical stale-listing flexibility.
Risks & watch-outs
- Climate carrying-cost: moderate wildfire risk — expect insurance premiums to compound above CPI over the hold.
Questions for the listing agent
- Built in 1978 — when were the roof, HVAC, electrical panel, plumbing, and water heater last replaced?
- Is there a deadline driving the sale (1031 exchange, divorce, estate, relocation)? That informs how much negotiation room exists.
- Schools are D-rated, which usually means shorter tenancies and higher turnover. Who's the typical renter profile here, and what's been the actual vacancy rate?
- What's the average days-on-market for RENTAL listings here right now (not sales)? A rising rental-DOM trend means longer vacancies and softer asking-rent achievability than the comps imply.
- What's the recent tenant-quality profile in this submarket — average credit score on applications, eviction rate, late-payment / NSF rate, and stable-employment percentage? A property-management company in the area should have these aggregated.
- How much new apartment / multifamily construction is in the pipeline within 1–3 miles? Heavy new supply (>2% of stock underway) typically softens rents 12–24 months out; light construction supports rent growth.
Investment metrics
- 1% rule
- 1.06% ✓
- Cap rate
- 9.00%
- Cash-on-cash
- 9.66%
- DSCR
- 1.43
- GRM
- 7.8
CMA / ARV
- ARV (median comp)
- $1,500,391
- List price
- $1,088,000
- Delta
- -27.49%
- Verdict
- UNDERPRICED
- Comps
- 19 within 1.0 mi
Show comp detail 2 sales within ~0.75 mi
| Address | Dist | Beds/Ba | Sqft | Sold | Price | $/sf | Match |
|---|---|---|---|---|---|---|---|
| 324 Railroad Ave | 0.00mi | 5/3.0 | 3,206 (0%) | 0mo | $1,100,000 | $343 | 100 |
| 723 Olive Ave | 0.52mi | 5/4.5 | 2,883 (-10%) | 14mo | $1,923,000 | $667 | 41 |
Match score weights: distance 35% · size 25% · config 20% · recency 20%. Top-matched comps best support the ARV.
Projected returns pro-forma
-3.0% appreciation · 6.02% rent growth · sell at horizon
- IRR
- 1.3%
- Equity multiple
- 1.05×
- Total profit
- $15,806
- Equity at exit
- $162,224
- IRR
- 13.5%
- Equity multiple
- 2.22×
- Total profit
- $371,669
- Equity at exit
- $94,070
Cash invested: $304,640 (down + closing). Projections, not guarantees.
Landlord ↔ Tenant lean methodology
- Overall (STATE)
- 18 Strongly Tenant-Friendly
- State California
- 18 Strongly Tenant-Friendly · D+13
- County
- — inherits STATE
- City
- — inherits STATE
ZIP-level market 94080
- Rents YoY
- 6.0%
- Active inventory
- 76
- Price-to-rent
- 26.5×
Monthly cashflow live
- Estimated rent
- $11,567 high interval (Pro) →
- Mortgage (P&I)
- −$5,706
- Tax from tax record
- −$526 /mo · $6,311/yr
- Insurance
- −$453
- HOA
- −$0
- Vacancy / Maint / Mgmt
- −$2,429
- Net cashflow
- $2,453
Break-even live
Sensitivity live
| Price | -10% $3,069 | -5% $2,761 | +0% $2,453 | +5% $2,145 | +10% $1,837 |
|---|---|---|---|---|---|
| Rent | -10% $1,539 | -5% $1,996 | +0% $2,453 | +5% $2,910 | +10% $3,367 |
| Rate | -1.0pp $3,001 | -0.5pp $2,730 | base $2,453 | +0.5pp $2,171 | +1.0pp $1,884 |
3-unit breakdown (identical units grouped — click to expand)
| Units | Beds | Baths | Est. rent |
|---|---|---|---|
| 1× unit | 1 | 1 | $3,422 |
| 2× units | 2 | 1 | $8,146 |
| #2 | 2 | 1 | $4,073 |
| #3 | 2 | 1 | $4,073 |
| Total (3 units) | $11,567 | ||
UW: 25.0% down · 7.5% · 30yr · 1.5% tax · 5.0% vac · 8.0% maint · 8.0% mgmt
Financing live
Cash to close
- Down payment
- $272,000
- Closing costs
- $32,640
- Reserves months
- —
- Total cash needed
- —
Loan-product check · same deal, 3 products live
Conventional
25% down · 7.5% · 30yr
- Down + closing
- —
- Monthly P&I
- —
- Monthly cashflow
- —
- DSCR
- —
- Eligible?
- —
Personal DTI + credit; lowest rate.
DSCR
20% down · 8.5% · 30yr
- Down + closing
- —
- Monthly P&I
- —
- Monthly cashflow
- —
- DSCR
- —
- Eligible?
- —
No personal income docs; deal must DSCR.
Hard money
10% down · 12.0% · 12mo
- Down + closing
- —
- Monthly P&I
- —
- Monthly cashflow
- —
- DSCR
- —
- Eligible?
- —
Short-term bridge; refi at stabilization.
Listing history 2 events
-
2026-04-28$1,088,000 Active 1061-char remark
-
1984-08-23soldstatus $183,000
ⓘ Source: listings_history table (triggers on properties + properties_extension) + one-shot
backfill from property_details.listing_events for pre-trigger history.
Tax reassessment forecast CA · Resets to sale price
- Current annual tax
- $6,311 · $526/mo
- Projected year-2 tax
- $8,269 · $689/mo
- Expected delta
- +$1,958/yr (+$163/mo · 31.0%)
ⓘ Screening estimate from a state-policy table — verify with the county assessor before closing.
Climate risk First Street
- Flood 1/10 Low FEMA zone X (unshaded) · 0% chance over 30 yrs
- Wildfire 5/10 Major
- Heat 2/10 Low 8 d/yr ≥78°F today · 18 d/yr by 30 yrs out
- Wind 1/10 Low
- Air quality 7/10 Severe 13 unhealthy d/yr today · 13 by 30 yrs out
Nearby sold comps map
Loading sold comps map…
Walkable amenities ~0.75 mi
Loading nearby amenities…
Taxation est. · year 1
- Rental income
- $138,804
- − Mortgage interest
- −$60,945
- − Property taxes
- −$6,311
- − Insurance
- −$5,440
- − Repairs & maintenance
- −$11,104
- − Management
- −$11,104
- − Depreciation
- −$31,651
- Taxable income
- $12,248
- Est. tax owed @ 24.0%
- −$2,940
- After-tax cash flow
- $26,497/yr
For passive investors: Depreciation is non-cash, so a rental often shows a tax loss while cash-flowing — sheltering income. Rental losses are passive: they offset passive income freely, and up to $25,000/yr can offset ordinary (W-2) income if you actively participate and your MAGI is under $100k (phasing out to $0 by $150k); unused losses carry forward. On sale, claimed depreciation is recaptured at up to 25%, and gains may owe capital-gains tax (a 1031 exchange can defer both). Figures are a year-1 estimate at your 24.0% rate — not tax advice; consult a CPA.
Schools (NCES district)
- District
- South San Francisco Unified
- NCES district ID
- 0637530
- Math proficiency
- 38% ▼ -6.00%
- Reading proficiency
- 47% ▼ -5.00%
- Median HH income
- $82,986
- Composite
- 39.69/100
- National rank
- #3905
- State rank
- #176 of 517 in CA
Livability — South San Francisco
- Score
- 65/100
- State rank
- #372
- US rank
- #12707
Category grades
Schools grade is shown separately in the Schools card above.
Census & demographics
- Census place
- South San Francisco, CA
- County
- San Mateo County · 733,415 people
- City population
- 64,761
- Metro
- San Francisco-Oakland-Berkeley, CA
- Population (ZIP)
- 64,761
- Household income
- $136,733
- Rent vs Own
- Severe rent burden
- 2470.0
Population outlook (San Mateo County) Hauer SSP2
- Today (2025)
- 864,008 people
- By 2030
- 910,523 · +5.4%
- By 2040
- 997,285 · +15.4%
- By 2050
- 1,071,189 · +24.0%
- By 2075
- 1,197,206 · +38.6%
- By 2100
- 1,192,523 · +38.0%
Race, ethnicity, and origin ACS 2023
- Neighborhood character
- Diverse neighborhood (Simpson 0.68)
- Race & ethnicity
- Asian 42% Hispanic / Latino 31% White 21% Two or more races 13% Black 2% Pacific Islander 1%
- Hispanic origin (detail)
- Mexican 18%
- Common ancestry
- Lithuanian 1% Italian 1% Scotch-Irish 1%
- Foreign-born
- 40% · Canada, China, Vietnam
- Languages at home
- 47% English-only · Spanish 20% Tagalog/Filipino 12% Chinese 11%
Political lean MEDSL · San Mateo
- 2024 margin
- Solid D (+50.3) · D 73.5% · R 23.2% · Other 3.3%
- 2008→2024 swing
- +1.6pp toward D · 2008: 48.7pp · 2024: 50.3pp
- All cycles
- 2024: D+50.3 2020: D+57.7 2016: D+57.7 2012: D+44.8 2008: D+48.7
Not yet ingested
- Civics
- —
Market trends
- HPI YoY
- ▼ -1094.19%
- Current HPI
- 330.5769
- Rent YoY
- ▲ 6.02%
- Metro
- San Francisco-Oakland-Berkeley, CA
- State GDP YoY
- ▲ 3.21%
- F500 in state
- 116
Industry mix (Fortune 500 HQ in CA)
| Industry | F500 HQs | Revenue |
|---|---|---|
| Technology | 27 | $1,492B |
|
||
| Financial Services | 3 | $174B |
|
||
| Retail | 3 | $44B |
|
||
| Insurance | 3 | $26B |
|
||
| Media / Entertainment | 2 | $115B |
|
||
| Pharmaceuticals / Biotech | 2 | $62B |
|
||
Price history
+501.1% since first listed4 events — show timeline
- 2026-06-15 Sold (MLS) $1,100,000 San Francisco MLS
- 2026-05-27 Pending — San Francisco MLS
- 2026-04-28 Listed $1,088,000 San Francisco MLS
- 1984-08-23 Sold (Public Records) $183,000 Public Records
Property tax history
+2.5%/yrLatest (2025): $6,311 · +1.4% YoY. Source: county tax records.
Cash-flow waterfall
monthlySold comps — $/sqft
last 12 mo · ≤1 miLoading sold comps…