23 Seymour Rd Unit 3B · Tariffville, CT
Flood risk No data
- FEMA flood zone
- —
- Chance of flooding over 30 yrs
- —
- Est. flood insurance / yr
- —
Fire risk No data
- Est. fire insurance / yr
- —
Heat risk No data
- Hot days now (above threshold)
- —
- Hot days in 30 yrs
- —
Wind risk No data
- Chance of severe wind over 30 yrs
- —
Air-quality risk No data
- Unhealthy air days now
- —
- Unhealthy air days in 30 yrs
- —
Risk factors via First Street. Map © Google.
Why this score? — see what drove the D grade
The composite is a weighted blend of 9 inputs, each scored 0–100. Each bar is that input's sub-score; the figure is the points it added to the 100-point composite (weight × sub-score).
- Cash flow +11.2/30.0
- ARV discount +7.5/15.0
- 1% rule +5.2/10.0
- Schools +5.2/10.0
- Livability +3.7/5.0
- DSCR +3.3/10.0
- Rent growth +2.5/5.0
- Condition / age +2.5/5.0
- Appreciation +0.0/10.0
$219,000
🖨 Deal sheet (PDF) 📄 Offer letter ✓ Due diligence
Listing remarks MLS
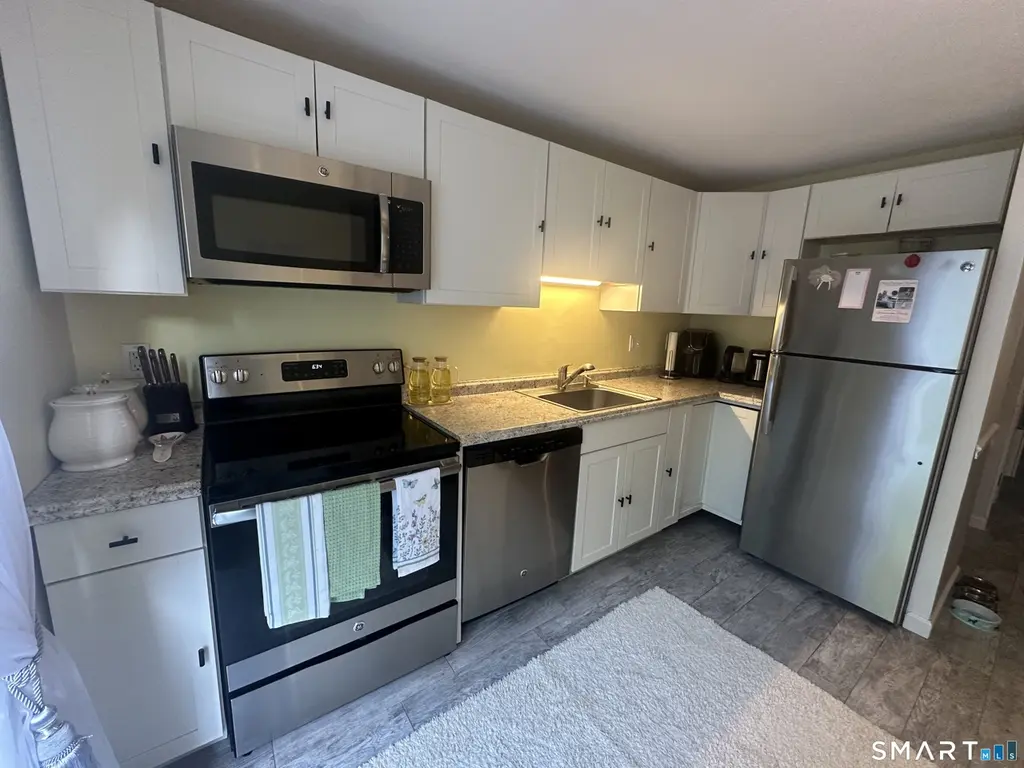
Beautifully Renovated Townhouse in Quiet, East Granby Complex. Updates and Features Include a Bright & Cherry New Kitchen w/ New Stainless Steel Appliances; New Windows; New Flooring and Fresh Paint Throughout; Central Air; Newly Finished Lower Level; Rear Deck Overlooking Pretty Back Yard; Updated Mechanicals and Plenty of Storage & Closet Space. Cool off This Summer in the Inground Pool! This Lovely Property is a Pleasure To Show, Move Right In! 5 Minutes to BDL and Route 91.
Key facts
- Finished basement
- Updated kitchen
- Prime location
Tags
Property features AI
Finance
- HOA & community: Monthly HOA fee; HOA covers grounds maintenance, trash pickup, snow removal, property management, pool service, and road maintenance; Community pool; Professional on-site property management; Pets allowed (ask for details)
Exterior
- Parking: Off-street assigned parking (1 space)
- Utilities: Public water connected; Public sewer connected
- Home design: Condominium; Unit located on first floor; Part of the Quincewood complex; Brown exterior color
- Construction: Frame construction; Built with typical condominium construction
- Exterior features: Vinyl siding; Level lot
Interior
- Kitchen: Oven/Range; Microwave; Refrigerator; Dishwasher
- Bedrooms: 2 bedrooms
- Bathrooms: 1 full bath; 1 half bath
- Heating & cooling: Baseboard heating (electric); Window air conditioning unit; 50-gallon electric hot water tank
- Interior features: Two-level unit; Partially finished full basement
- Laundry & utility: Washer and dryer included; Laundry located in rear room of basement (lower level)
Neighborhood map
What this means for you Summary
Snapshot
- This is a 2-bed/1.5-bath condo listed at $219k.
Deal economics
- At list price, monthly cash flow is $-83 ($-997/yr) — negative.
- To cash-flow at today's rent, offer at most $204k (6.7% below list).
- Meets the 1% rule at list price ($2k rent vs $219k).
- Recommended offer: $204k (6.7% below list) — sets the bar for cash-flow.
Location & tenants
- Location reads 73/100 on livability (#78 in CT) — a middle-class / working-renter tenant base. Strengths: crime A+, housing A+, health & safety B+; Watch: amenities F, commute F.
- East Granby School District (rural): math 51% / reading 64% proficiency, ranked #54 of 153 in CT (top 35%) — acceptable for families but not a draw, mixed tenant base, ~2y average lease; only 8% free/reduced lunch — higher-income household profile.
- Zoned schools: Allgrove School (202 students, 15% FRL); East Granby Middle School (math 51% / reading 70%, grade B+, #45 of 175 statewide, top 28%, 195 students, 19% FRL); East Granby High School (math 57% / reading 67%, grade B-, #40 of 194 statewide, top 21%, 258 students, 14% FRL).
- Market conditions: 26 active listings in the ZIP; 1,867 units permitted in Capitol Planning Region in 2024 (1,399 in 5+ unit buildings).
Forward outlook
- Local home prices are declining (-3.0%/yr); year-one equity from $2k of loan paydown is wiped out by about $7k of value loss. Plan a longer hold.
Negotiation context
- Only 7 days on market — expect competitive offers; lowballing is unlikely to land.
- 5 sale attempts since 9y ago with the ask held roughly flat each time — persistent listings suggest the price (not the market) is what's stuck; bring a comps-based counter.
- Current owner paid $112k; list at $219k implies a 96% gain — meaningful room to come down on a strong offer.
Questions for the listing agent
- What do current leases actually rent for vs. the listed asking? Can we see a recent rent roll and the last 12 months of T-12 income?
- Built in 1970 — when were the roof, HVAC, electrical panel, plumbing, and water heater last replaced?
- What does the HOA fee cover, when was the last increase, and are there any pending special assessments or reserve-fund shortfalls?
- Any open or pending special assessments — roof, HVAC, plumbing, elevator, façade? What's the per-unit balance and payoff schedule, and is the seller paying it off at close or rolling it to the buyer?
- Is there a deadline driving the sale (1031 exchange, divorce, estate, relocation)? That informs how much negotiation room exists.
- Schools are A-rated — typically a magnet for longer-tenancy family renters. What's the average tenant stay here, and is there a school-zone premium baked into asking?
- The area grade is low — what's the realistic commute time and amenity access for the typical tenant pool here? Any planned neighborhood developments (good or bad) we should know about?
- What's the average days-on-market for RENTAL listings here right now (not sales)? A rising rental-DOM trend means longer vacancies and softer asking-rent achievability than the comps imply.
- What's the recent tenant-quality profile in this submarket — average credit score on applications, eviction rate, late-payment / NSF rate, and stable-employment percentage? A property-management company in the area should have these aggregated.
- How much new apartment / multifamily construction is in the pipeline within 1–3 miles? Heavy new supply (>2% of stock underway) typically softens rents 12–24 months out; light construction supports rent growth.
Investment metrics
- 1% rule
- 1.02% ✓
- Cap rate
- 5.84%
- Cash-on-cash
- -1.63%
- DSCR
- 0.93
- GRM
- 8.1
CMA / ARV
No comps found within radius.
Projected returns pro-forma
-3.0% appreciation · 3.0% rent growth · sell at horizon
- IRR
- -18.8%
- Equity multiple
- 0.34×
- Total profit
- $-40,539
- Equity at exit
- $32,654
- IRR
- -11.1%
- Equity multiple
- 0.33×
- Total profit
- $-41,131
- Equity at exit
- $18,935
Cash invested: $61,320 (down + closing). Projections, not guarantees.
Landlord ↔ Tenant lean methodology
- Overall (STATE)
- 27 Tenant-Leaning
- State Connecticut
- 27 Tenant-Leaning · D+7
- County
- — inherits STATE
- City
- — inherits STATE
ZIP-level market 06026
- Home prices YoY
- -18.4%
- Active inventory
- 26
- Price-to-rent
- 8.1×
Monthly cashflow live
- Estimated rent
- $2,241 medium interval (Pro) →
- Mortgage (P&I)
- −$1,148
- Tax from tax record
- −$279 /mo · $3,346/yr
- Insurance
- −$91
- HOA
- −$335
- Vacancy / Maint / Mgmt
- −$471
- Net cashflow
- $-83
Break-even live
Sensitivity live
| Price | -10% $41 | -5% $-21 | +0% $-83 | +5% $-145 | +10% $-207 |
|---|---|---|---|---|---|
| Rent | -10% $-260 | -5% $-172 | +0% $-83 | +5% $5 | +10% $94 |
| Rate | -1.0pp $27 | -0.5pp $-27 | base $-83 | +0.5pp $-140 | +1.0pp $-198 |
UW: 25.0% down · 7.5% · 30yr · 1.5% tax · 5.0% vac · 8.0% maint · 8.0% mgmt
Financing live
Cash to close
- Down payment
- $54,750
- Closing costs
- $6,570
- Reserves months
- —
- Total cash needed
- —
Loan-product check · same deal, 3 products live
Conventional
25% down · 7.5% · 30yr
- Down + closing
- —
- Monthly P&I
- —
- Monthly cashflow
- —
- DSCR
- —
- Eligible?
- —
Personal DTI + credit; lowest rate.
DSCR
20% down · 8.5% · 30yr
- Down + closing
- —
- Monthly P&I
- —
- Monthly cashflow
- —
- DSCR
- —
- Eligible?
- —
No personal income docs; deal must DSCR.
Hard money
10% down · 12.0% · 12mo
- Down + closing
- —
- Monthly P&I
- —
- Monthly cashflow
- —
- DSCR
- —
- Eligible?
- —
Short-term bridge; refi at stabilization.
HOA detail condo
- Monthly dues
- $335 · $4,020/yr
- Likely covers
- pool
- Assessments
- None detected in remarks — confirm with the listing agent.
Listing history 6 events
-
2026-06-13statusdays on market $219,000 Under Contract 7 DOM
-
2026-06-10days on market $219,000 Active 5 DOM
-
2026-06-09days on market $219,000 Active 4 DOM
-
2026-06-08days on market $219,000 Active 3 DOM
-
2026-06-07remarks 699-char remark
-
2026-06-07$219,000 Active 2 DOM
ⓘ Source: listings_history table (triggers on properties + properties_extension) + one-shot
backfill from property_details.listing_events for pre-trigger history.
Tax reassessment forecast CT · Partial reset (capped growth)
- Current annual tax
- $3,346 · $279/mo
- Projected year-2 tax
- $4,016 · $335/mo
- Expected delta
- +$670/yr (+$56/mo · 20.0%)
ⓘ Screening estimate from a state-policy table — verify with the county assessor before closing.
Nearby sold comps map
Loading sold comps map…
Walkable amenities ~0.75 mi
Loading nearby amenities…
Taxation est. · year 1
- Rental income
- $26,892
- − Mortgage interest
- −$12,267
- − Property taxes
- −$3,346
- − Insurance
- −$1,095
- − Repairs & maintenance
- −$2,151
- − Management
- −$2,151
- − HOA
- −$4,020
- − Depreciation
- −$6,371
- Taxable loss
- −$4,510
- Est. tax savings @ 24.0%
- +$1,082
- After-tax cash flow
- $85/yr
For passive investors: Depreciation is non-cash, so a rental often shows a tax loss while cash-flowing — sheltering income. Rental losses are passive: they offset passive income freely, and up to $25,000/yr can offset ordinary (W-2) income if you actively participate and your MAGI is under $100k (phasing out to $0 by $150k); unused losses carry forward. On sale, claimed depreciation is recaptured at up to 25%, and gains may owe capital-gains tax (a 1031 exchange can defer both). Figures are a year-1 estimate at your 24.0% rate — not tax advice; consult a CPA.
Schools (NCES district)
- District
- East Granby School District
- NCES district ID
- 0901170
- Math proficiency
- 51% ▼ -14.00%
- Reading proficiency
- 64% ▼ -9.00%
- Median HH income
- $78,289
- Composite
- 51.66/100
- National rank
- #1695
- State rank
- #54 of 153 in CT
Livability — Tariffville
- Score
- 73/100
- State rank
- #78
- US rank
- #5682
Category grades
Schools grade is shown separately in the Schools card above.
Census & demographics
- City population
- 1,607
- Population (ZIP)
- 5,176
Population outlook (Capitol County) Hauer SSP2
- By 2040
- 1,063,519
Race, ethnicity, and origin ACS 2023
- Neighborhood character
- Predominantly White (77%)
- Race & ethnicity
- White 77% Two or more races 9% Hispanic / Latino 6% Black 4% Asian 3%
- Hispanic origin (detail)
- Puerto Rican 3%
- Common ancestry
- Romanian 7% Portuguese 3% Slovak 2%
- Foreign-born
- 10% · Canada, China, South Korea
- Languages at home
- 86% English-only · Spanish 5% Other Asian/Pacific 2% French/Haitian/Cajun 2%
Political lean MEDSL · Capitol
- 2024 margin
- Strong D (+21.9) · D 60.1% · R 38.2% · Other 1.7%
- All cycles
- 2024: D+21.9
Not yet ingested
- Civics
- —
Market trends
- HPI YoY
- ▼ -52.66%
- Current HPI
- 234.323
- Rent YoY
- —
- Metro
- —
- State GDP YoY
- ▲ 1.06%
- F500 in state
- 38
Industry mix (Fortune 500 HQ in CT)
| Industry | F500 HQs | Revenue |
|---|---|---|
| Industrial Machinery | 4 | $38B |
|
||
| Insurance | 3 | $71B |
|
||
| Financial Services | 2 | $25B |
|
||
| Transportation / Logistics | 2 | $18B |
|
||
| Healthcare | 1 | $247B |
|
||
| Telecommunications | 1 | $55B |
|
||
Price history
+247.6% since first listed16 events — show timeline
- 2026-06-04 Listed $219,000 Smart MLS
- 2018-10-04 Listing Removed — Smart MLS
- 2018-10-04 Sold (Public Records) $111,900 Public Records
- 2018-10-04 Sold (MLS) $111,900 Smart MLS
- 2018-09-15 Contingent — Smart MLS
- 2018-07-22 Relisted — Smart MLS
- 2018-07-04 Contingent — Smart MLS
- 2018-06-09 Listed $111,900 Smart MLS
- 2018-06-01 Listing Removed — Smart MLS
- 2018-05-14 Price Changed $119,995 Smart MLS
- 2018-04-19 Price Changed $121,995 Smart MLS
- 2018-02-02 Price Changed $124,900 Smart MLS
- 2017-10-25 Listed $127,900 Smart MLS
- 2017-10-20 Sold (MLS) $58,000 Smart MLS
- 2017-09-21 Listing Removed — Smart MLS
- 2017-02-28 Listed $63,000 Smart MLS
Property tax history
+3.3%/yrLatest (2025): $3,346 · +2.4% YoY. Source: county tax records.
Cash-flow waterfall
monthlySold comps — $/sqft
last 12 mo · ≤1 miLoading sold comps…