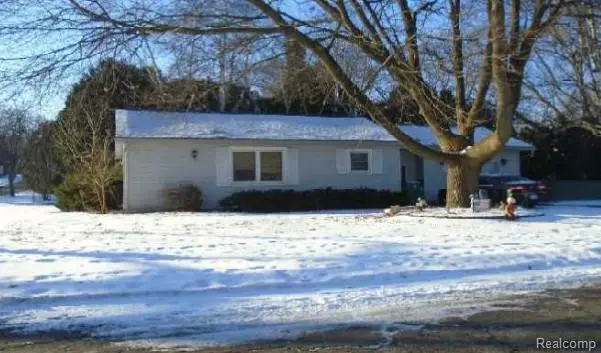
802 Woodlawn Ave · Owosso, MI
Flood risk 1/10 · Minimal
- FEMA flood zone
- X (unshaded)
- Chance of flooding over 30 yrs
- 0.0%
- Est. flood insurance / yr
- $473 – $860
Fire risk 1/10 · Minimal
- Est. fire insurance / yr
- $784 – $1,456
Heat risk 2/10 · Minimal
- Hot days now (above 98°F)
- 7 days/yr
- Hot days in 30 yrs
- 15 days/yr
Wind risk 2/10 · Minimal
- Chance of severe wind over 30 yrs
- —
Air-quality risk 2/10 · Minimal
- Unhealthy air days now
- 1 days/yr
- Unhealthy air days in 30 yrs
- 2 days/yr
Risk factors via First Street. Map © Google.
Why this score? — see what drove the B+ grade
The composite is a weighted blend of 9 inputs, each scored 0–100. Each bar is that input's sub-score; the figure is the points it added to the 100-point composite (weight × sub-score).
- Cash flow +30.0/30.0
- ARV discount +15.0/15.0
- DSCR +10.0/10.0
- 1% rule +9.0/10.0
- Livability +3.8/5.0
- Rent growth +2.5/5.0
- Condition / age +2.5/5.0
- Schools +2.3/10.0
- Appreciation +0.0/10.0
$71,200
🖨 Deal sheet 📄 Offer letter ✓ Due diligence
Listing remarks MLS
REO Occupied – NO ACCESS OR VIEWINGS of this property. Please DO NOT DISTURB the occupant. "As is" cash only sale with no contingencies or inspections. Buyer will be responsible for obtaining possession of the property upon closing. Great Opportunity to own this single-family home built in 1940 featuring 2 bedrooms and 1 bathrooms. * * * SPECIAL NOTES: (1) This is a CASH ONLY transaction. (2) Seller to pay Taxes, HOA, and Municipal/Utility Liens. (3) Please read the Auction disclaimers carefully before placing a bid or submitting an offer. * * *
Key facts
- 0.28 acre lot
- Garage
- Built 1940
Neighborhood map
What this means for you Summary
Snapshot
- This is a 2-bed/1.0-bath single-family listed at $71k.
Deal economics
- At list price, monthly cash flow is $304 ($4k/yr) — positive.
- The deal already cash-flows at list — no discount required.
- Meets the 1% rule at list price ($1k rent vs $71k).
- Recommended offer: $63k (12.0% below list) — sets the bar for market timing.
- Cap rate 11.4% vs local median 4.2% in Owosso — top-decile yield for the area; either an underpriced asset or a hidden risk that comps aren't pricing in. Stress-test before assuming the spread holds.
Location & tenants
- Location reads 76/100 on livability (#147 in MI, #3,704 nationally) — a middle-class / working-renter tenant base. Strengths: cost of living A+, housing A+, health & safety A+; Watch: schools D+, crime D-, commute F.
- Owosso Public Schools (town): math 21% / reading 33% proficiency, ranked #401 of 540 in MI (top 74%) — low school quality limits family demand, transient renter base, plan for 1-2y turnover.
- Market conditions: 162 active listings in the ZIP; 1 comparable units currently listed for rent nearby; 74 units permitted in Shiawassee County in 2024 (0 in 5+ unit buildings).
Forward outlook
- Local home prices are declining (-3.0%/yr); year-one equity from $492 of loan paydown is wiped out by about $2k of value loss. Plan a longer hold.
- Shiawassee County population projected at -25% by 2050 — secular population decline; favor cash flow + early exit over multi-decade hold.
- At projected returns (-3.0% appreciation + 3.0% rent growth), your $20k cash investment doubles in ~7 years — after that, you're playing with house money.
Negotiation context
- It's been on market 169 days — a 12% lower offer ($63k) is reasonable based on typical stale-listing flexibility.
- 4 sale attempts since 7y ago with the ask held roughly flat each time — persistent listings suggest the price (not the market) is what's stuck; bring a comps-based counter.
Risks & watch-outs
- Watch-outs: built in 1940 — expect roof / HVAC / electrical / plumbing capex.
Questions for the listing agent
- It's been on market 169 days. Have you received any prior offers? Is the seller open to a 12% concession, seller financing, or rate buy-down credit?
- Built in 1940 — when were the roof, HVAC, electrical panel, plumbing, and water heater last replaced?
- Why hasn't it sold? Are there any deal-killer items the seller is aware of (foundation, flood, title, zoning, code violations)?
- Is there a deadline driving the sale (1031 exchange, divorce, estate, relocation)? That informs how much negotiation room exists.
- Schools are D-rated, which usually means shorter tenancies and higher turnover. Who's the typical renter profile here, and what's been the actual vacancy rate?
- Crime grade is D in this area — have there been break-ins, vandalism, or insurance claims at this property in the last 3 years? What carrier currently insures it and at what premium?
- What's the average days-on-market for RENTAL listings here right now (not sales)? A rising rental-DOM trend means longer vacancies and softer asking-rent achievability than the comps imply.
- What's the recent tenant-quality profile in this submarket — average credit score on applications, eviction rate, late-payment / NSF rate, and stable-employment percentage? A property-management company in the area should have these aggregated.
- How much new for-sale + rental construction is in the pipeline within 1–3 miles? Heavy new supply typically softens prices + rents 12–24 months out; constrained supply supports both.
Investment metrics
- 1% rule
- 1.40% ✓
- Cap rate
- 11.42%
- Cash-on-cash
- 18.32%
- DSCR
- 1.82
- GRM
- 5.9
CMA / ARV
- ARV (median comp)
- $98,890
- List price
- $71,200
- Delta
- -28.00%
- Verdict
- UNDERPRICED
- Comps
- 20 within 1.0 mi
Show comp detail 12 sales within ~0.75 mi
| Address | Dist | Beds/Ba | Sqft | Sold | Price | $/sf | Match |
|---|---|---|---|---|---|---|---|
| 755 Woodlawn Ave | 0.04mi | 2/1.0 | 840 (+9%) | 2mo | $91,000 | $108 | 80 |
| 1207 Broadway Ave | 0.04mi | 2/1.0 | 844 (+10%) | 4mo | $120,000 | $142 | 78 |
| 822 Glenwood Ave | 0.14mi | 2/1.0 | 800 (+4%) | 10mo | $112,500 | $141 | 78 |
| 902 Glenwood Ave | 0.16mi | 2/1.0 | 834 (+9%) | 2mo | $155,000 | $186 | 76 |
| 615 Glenwood St | 0.24mi | 2/1.0 | 790 (+3%) | 9mo | $150,000 | $190 | 76 |
| 626 Alger St | 0.20mi | 3/1.5 (+1) | 755 (-2%) | 17mo | $33,000 | $44 | 67 |
| 810 Broadway Ave | 0.14mi | 1/1.0 (-1) | 857 (+12%) | 6mo | $42,000 | $49 | 64 |
| 631 Woodlawn Ave | 0.21mi | 1/1.0 (-1) | 672 (-12%) | 1mo | $73,000 | $109 | 63 |
| 721 Wright Ave | 0.48mi | 1/1.0 (-1) | 726 (-6%) | 5mo | $65,000 | $90 | 60 |
| 201 E Stewart St | 0.50mi | 2/1.0 | 696 (-9%) | 9mo | $115,000 | $165 | 54 |
| 504 E Howard St | 0.51mi | 2/1.0 | 880 (+15%) | 12mo | $10,000 | $11 | 42 |
| 1403 Melinda St | 0.67mi | 1/1.0 (-1) | 696 (-9%) | 8mo | $95,000 | $136 | 41 |
Match score weights: distance 35% · size 25% · config 20% · recency 20%. Top-matched comps best support the ARV.
Projected returns pro-forma
-3.0% appreciation · 3.0% rent growth · sell at horizon
- IRR
- 10.0%
- Equity multiple
- 1.39×
- Total profit
- $7,859
- Equity at exit
- $10,616
- IRR
- 19.1%
- Equity multiple
- 2.60×
- Total profit
- $31,850
- Equity at exit
- $6,156
Cash invested: $19,936 (down + closing). Projections, not guarantees.
Landlord ↔ Tenant lean methodology
- Overall (STATE)
- 62 Landlord-Friendly
- State Michigan
- 62 Landlord-Friendly · EVEN
- County
- — inherits STATE
- City
- — inherits STATE
ZIP-level market 48867
- Active inventory
- 162
- Price-to-rent
- 5.9×
Monthly cashflow live
- Estimated rent
- $1,000 medium interval (Pro) →
- Mortgage (P&I)
- −$373
- Tax from tax record
- −$83 /mo · $991/yr
- Insurance
- −$30
- HOA
- −$0
- Vacancy / Maint / Mgmt
- −$210
- Net cashflow
- $304
Break-even live
UW: 25.0% down · 7.5% · 30yr · 1.5% tax · 5.0% vac · 8.0% maint · 8.0% mgmt
Financing live
Cash to close
- Down payment
- $17,800
- Closing costs
- $2,136
- Reserves months
- —
- Total cash needed
- —
Loan-product check · same deal, 3 products live
Conventional
25% down · 7.5% · 30yr
- Down + closing
- —
- Monthly P&I
- —
- Monthly cashflow
- —
- DSCR
- —
- Eligible?
- —
Personal DTI + credit; lowest rate.
DSCR
20% down · 8.5% · 30yr
- Down + closing
- —
- Monthly P&I
- —
- Monthly cashflow
- —
- DSCR
- —
- Eligible?
- —
No personal income docs; deal must DSCR.
Hard money
10% down · 12.0% · 12mo
- Down + closing
- —
- Monthly P&I
- —
- Monthly cashflow
- —
- DSCR
- —
- Eligible?
- —
Short-term bridge; refi at stabilization.
Rent comps 1 comps
| Address | Beds | Baths | Sqft | Rent | $/sqft | DOM | Units | Dist |
|---|---|---|---|---|---|---|---|---|
| 1800 Candlewick Dr Owosso, MI | 3.0 | 2.0 | 1056 | $1,000 | $0.95 | 13d | 1 | 1.39mi |
Listing history 22 events
-
2026-06-18days on market $71,200 Active 169 DOM
-
2026-06-17days on market $71,200 Active 168 DOM
-
2026-06-16days on market $71,200 Active 167 DOM
-
2026-06-15days on market $71,200 Active 166 DOM
-
2026-06-13days on market $71,200 Active 164 DOM
-
2026-06-12days on market $71,200 Active 163 DOM
-
2026-06-09days on market $71,200 Active 160 DOM
-
2026-06-08days on market $71,200 Active 159 DOM
-
2026-06-07days on market $71,200 Active 158 DOM
-
2026-06-07days on market $71,200 Active 157 DOM
-
2026-06-04days on market $71,200 Active 154 DOM
-
2026-06-02days on market $71,200 Active 153 DOM
-
2026-06-01days on market $71,200 Active 152 DOM
-
2026-05-31days on market $71,200 Active 151 DOM
-
2026-05-31days on market $71,200 Active 150 DOM
-
2025-12-29$71,200 Active 571-char remark
Show marketing remark (584 chars)
REO Occupied – NO ACCESS OR VIEWINGS of this property. Please DO NOT DISTURB the occupant. "As is" cash only sale with no contingencies or inspections. Buyer will be responsible for obtaining possession of the property upon closing. Great Opportunity to own this single-family home built in 1940 featuring 2 bedrooms and 1 bathrooms. * * * SPECIAL NOTES: (1) This is a CASH ONLY transaction. (2) Seller to pay Taxes, HOA, and Municipal/Utility Liens. (3) Please read the Auction disclaimers carefully before placing a bid or submitting an offer. * * *
-
2025-12-29$71,200 Active 584-char remark
Show marketing remark (584 chars)
REO Occupied – NO ACCESS OR VIEWINGS of this property. Please DO NOT DISTURB the occupant. "As is" cash only sale with no contingencies or inspections. Buyer will be responsible for obtaining possession of the property upon closing. Great Opportunity to own this single-family home built in 1940 featuring 2 bedrooms and 1 bathrooms. * * * SPECIAL NOTES: (1) This is a CASH ONLY transaction. (2) Seller to pay Taxes, HOA, and Municipal/Utility Liens. (3) Please read the Auction disclaimers carefully before placing a bid or submitting an offer. * * *
-
2019-05-22soldstatus $65,000
-
2019-05-17soldstatus $65,000
-
2019-05-17soldstatus $65,000
-
2019-04-09$64,900
-
2019-04-09$64,900
ⓘ Source: listings_history table (triggers on properties + properties_extension) + one-shot
backfill from property_details.listing_events for pre-trigger history.
Tax reassessment forecast MI · Partial reset (capped growth)
- Current annual tax
- $991 · $83/mo
- Projected year-2 tax
- $1,044 · $87/mo
- Expected delta
- +$53/yr (+$4/mo · 5.3%)
ⓘ Screening estimate from a state-policy table — verify with the county assessor before closing.
Climate risk First Street
- Flood 1/10 Low FEMA zone X (unshaded) · 0% chance over 30 yrs
- Wildfire 1/10 Low
- Heat 2/10 Low 7 d/yr ≥98°F today · 15 d/yr by 30 yrs out
- Wind 2/10 Low
- Air quality 2/10 Low 1 unhealthy d/yr today · 2 by 30 yrs out
Nearby sold comps map
Loading sold comps map…
Walkable amenities ~0.75 mi
Loading nearby amenities…
Taxation est. · year 1
- Rental income
- $12,000
- − Mortgage interest
- −$3,988
- − Property taxes
- −$991
- − Insurance
- −$356
- − Repairs & maintenance
- −$960
- − Management
- −$960
- − Depreciation
- −$2,071
- Taxable income
- $2,673
- Est. tax owed @ 24.0%
- −$642
- After-tax cash flow
- $3,011/yr
For passive investors: Depreciation is non-cash, so a rental often shows a tax loss while cash-flowing — sheltering income. Rental losses are passive: they offset passive income freely, and up to $25,000/yr can offset ordinary (W-2) income if you actively participate and your MAGI is under $100k (phasing out to $0 by $150k); unused losses carry forward. On sale, claimed depreciation is recaptured at up to 25%, and gains may owe capital-gains tax (a 1031 exchange can defer both). Figures are a year-1 estimate at your 24.0% rate — not tax advice; consult a CPA.
Schools (NCES district)
- District
- Owosso Public Schools
- NCES district ID
- 2627210
- Math proficiency
- 21% ▼ -6.00%
- Reading proficiency
- 33% ▲ 1.00%
- Median HH income
- $40,656
- Composite
- 22.78/100
- National rank
- #8025
- State rank
- #401 of 540 in MI
Livability — Owosso
- Score
- 76/100
- State rank
- #147
- US rank
- #3704
Category grades
Schools grade is shown separately in the Schools card above.
Census & demographics
- Census place
- Owosso, MI
- City population
- 27,399
- Population (ZIP)
- 27,399
Population outlook (Shiawassee County) Hauer SSP2
- Today (2025)
- 64,238 people
- By 2030
- 61,434 · -4.4%
- By 2040
- 55,054 · -14.3%
- By 2050
- 48,426 · -24.6%
- By 2075
- 35,995 · -44.0%
- By 2100
- 26,678 · -58.5%
Race, ethnicity, and origin ACS 2023
- Neighborhood character
- Predominantly White (92%)
- Race & ethnicity
- White 92% Hispanic / Latino 4% Two or more races 3%
- Common ancestry
- Romanian 6% Lithuanian 3% Iranian 3%
- Foreign-born
- 1%
- Languages at home
- 98% English-only · Spanish 1% Arabic 1%
Political lean MEDSL · Shiawassee
- 2024 margin
- Strong R (+23.1) · D 37.7% · R 60.8% · Other 1.6%
- 2008→2024 swing
- -31.7pp toward R · 2008: 8.6pp · 2024: -23.1pp
- All cycles
- 2024: R+23.1 2020: R+19.9 2016: R+19.6 2012: D+3.7 2008: D+8.6
Not yet ingested
- Civics
- —
Market trends
- HPI YoY
- ▼ -234.79%
- Current HPI
- 190.5775
- Rent YoY
- —
- Metro
- —
- State GDP YoY
- ▲ 1.37%
- F500 in state
- 28
Industry mix (Fortune 500 HQ in MI)
| Industry | F500 HQs | Revenue |
|---|---|---|
| Automotive Parts | 3 | $48B |
|
||
| Automotive | 2 | $372B |
|
||
| Chemicals | 1 | $45B |
|
||
| Automotive Retail | 1 | $29B |
|
||
| Healthcare / Medical Devices | 1 | $23B |
|
||
| Automotive Technology | 1 | $20B |
|
||
Price history
+9.7% since first listed7 events — show timeline
- 2025-12-29 Listed $71,200 MiRealSource-MiMLS
- 2025-12-29 Listed $71,200 REALCOMP
- 2019-05-22 Sold (Public Records) $65,000 Public Records
- 2019-05-17 Sold (MLS) $65,000 MiRealSource-MiMLS
- 2019-05-17 Sold (MLS) $65,000 REALCOMP
- 2019-04-09 Listed $64,900 MiRealSource-MiMLS
- 2019-04-09 Listed $64,900 REALCOMP
Property tax history
-1.9%/yrLatest (2025): $991 · -30.8% YoY. Source: county tax records.
Cash-flow waterfall
monthlySold comps — $/sqft
last 12 mo · ≤1 miLoading sold comps…