 Triplex
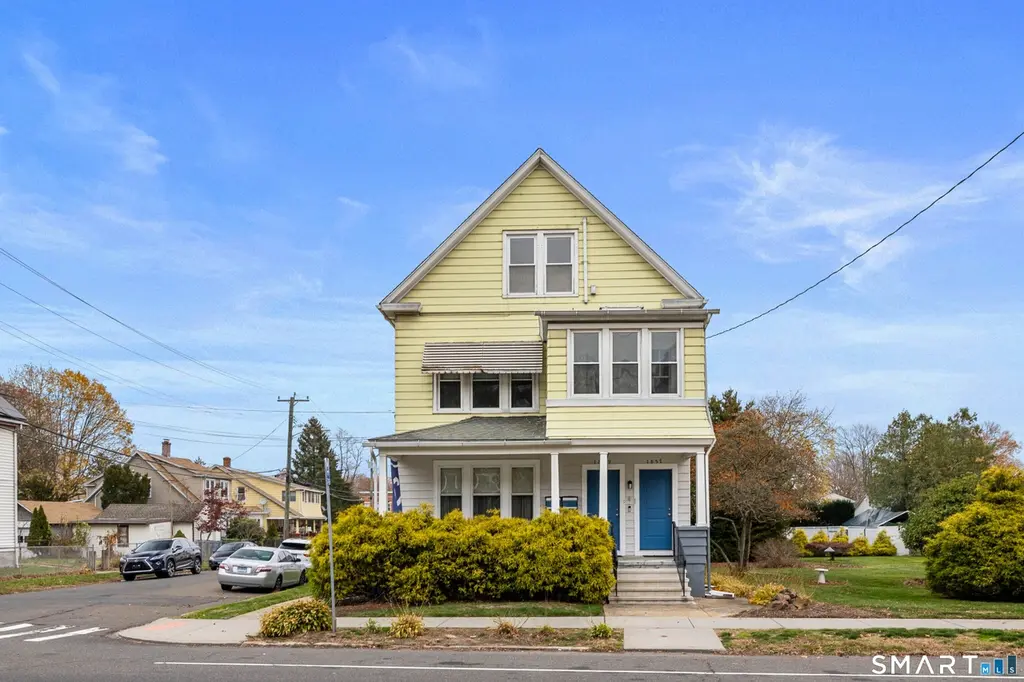
1857 State St · New Haven, CT
Flood risk 6/10 · Moderate
- FEMA flood zone
- X (unshaded)
- Chance of flooding over 30 yrs
- 0.69%
- Est. flood insurance / yr
- $473 – $860
Fire risk 3/10 · Minor
- Est. fire insurance / yr
- $829 – $1,539
Heat risk 6/10 · Moderate
- Hot days now (above 99°F)
- 7 days/yr
- Hot days in 30 yrs
- 16 days/yr
Wind risk 6/10 · Moderate
- Chance of severe wind over 30 yrs
- 54.0%
Air-quality risk 5/10 · Moderate
- Unhealthy air days now
- 6 days/yr
- Unhealthy air days in 30 yrs
- 8 days/yr
Risk factors via First Street. Map © Google.
Why this score? — see what drove the B- grade
The composite is a weighted blend of 9 inputs, each scored 0–100. Each bar is that input's sub-score; the figure is the points it added to the 100-point composite (weight × sub-score).
- Cash flow +26.7/30.0
- ARV discount +11.7/15.0
- DSCR +9.1/10.0
- 1% rule +8.1/10.0
- Livability +4.0/5.0
- Schools +3.3/10.0
- Rent growth +2.6/5.0
- Condition / age +2.5/5.0
- Appreciation +0.0/10.0
$485,000
🖨 Deal sheet (PDF) 📄 Offer letter ✓ Due diligence
Multi-family units
County records classify this as Multi-Family (2-4 Unit). Listing-text estimate: 3 units. confirmed
Listing remarks
Rare opportunity!!! Welcome to 1857 State St. , Hamden, CT. This well-maintained 3-unit multi-family has been lovingly cared for by the same family since it was built, showcasing true pride of ownership throughout. Situated on a double corner lot, the property offers a unique sense of privacy while remaining just moments from shopping, dining, and everyday conveniences. Each unit features 2 bedrooms, 1 full bath, a living room, dining room, and kitchen-ideal for both owner-occupants and investors alike. Additional highlights include a detached 3-car garage, ample street parking, and a fenced-in area-perfect for pet owners. Properties like this are rarely available. Schedule your showing to
Key facts
- 0.29 acre lot
- 3 garage spots
- Built 1928
Neighborhood map
What this means for you Summary
Snapshot
- This is a 3 × 2-bed/1.0-bath units multifamily listed at $485k.
Deal economics
- At list price, monthly cash flow is $1k ($16k/yr) — positive. Per door: $436/mo.
- The deal already cash-flows at list — no discount required.
- Meets the 1% rule at list price ($6k rent vs $485k).
- Cap rate 9.5% vs local median 4.9% in New Haven — top-decile yield for the area; either an underpriced asset or a hidden risk that comps aren't pricing in. Stress-test before assuming the spread holds.
Location & tenants
- Location reads 79/100 on livability (#31 in CT, #2,190 nationally) — a middle-class / working-renter tenant base. Strengths: amenities A+, commute A+, health & safety A+; Watch: schools D+, employment D, crime F.
- Hamden School District (suburban): math 30% / reading 43% proficiency, ranked #106 of 153 in CT (top 69%) — families likely to look elsewhere, expect single-tenant / working-renter base with shorter leases.
- Market conditions: Rents flat; 83 active listings in the ZIP; 1 comparable units currently listed for rent nearby; solid renter incomes; 1,059 units permitted in South Central Connecticut Planning Region in 2024 (779 in 5+ unit buildings).
- At $6,354/mo this rent would consume 73% of the median local household income ($105k/yr) (locally 531% of renters already pay >50% of income on rent) — very limited rent-growth headroom before tenants either downsize or default.
Forward outlook
- Local home prices are declining (-3.0%/yr); year-one equity from $3k of loan paydown is wiped out by about $15k of value loss. Plan a longer hold.
Negotiation context
- Only 3 days on market — expect competitive offers; lowballing is unlikely to land.
- Current owner paid $49k; list at $485k implies a 887% gain — meaningful room to come down on a strong offer.
Risks & watch-outs
- Watch-outs: built in 1928 — expect roof / HVAC / electrical / plumbing capex.
- Climate carrying-cost: major flood risk; major wind risk, 54% chance of damaging wind over 30y; extreme-heat days projected 7→16/yr by 2055 (HVAC capex compounding) — expect insurance premiums to compound above CPI over the hold.
Questions for the listing agent
- Can we see the unit-by-unit rent roll, current vacancy, and any below-market leases? What's the average tenancy length?
- What capital expenditures (roof, boiler, parking lot, exteriors) have been made in the last 5 years, and what's planned in the next 2?
- Built in 1928 — when were the roof, HVAC, electrical panel, plumbing, and water heater last replaced?
- Is there a deadline driving the sale (1031 exchange, divorce, estate, relocation)? That informs how much negotiation room exists.
- Schools are D-rated, which usually means shorter tenancies and higher turnover. Who's the typical renter profile here, and what's been the actual vacancy rate?
- Crime grade is F in this area — have there been break-ins, vandalism, or insurance claims at this property in the last 3 years? What carrier currently insures it and at what premium?
- What's the average days-on-market for RENTAL listings here right now (not sales)? A rising rental-DOM trend means longer vacancies and softer asking-rent achievability than the comps imply.
- What's the recent tenant-quality profile in this submarket — average credit score on applications, eviction rate, late-payment / NSF rate, and stable-employment percentage? A property-management company in the area should have these aggregated.
- How much new apartment / multifamily construction is in the pipeline within 1–3 miles? Heavy new supply (>2% of stock underway) typically softens rents 12–24 months out; light construction supports rent growth.
Investment metrics
- 1% rule
- 1.31% ✓
- Cap rate
- 9.53%
- Cash-on-cash
- 11.56%
- DSCR
- 1.51
- GRM
- 6.4
CMA / ARV
- ARV (on-the-fly)
- $534,688
- Comps found
- 4
Show comp detail 4 sales within ~0.75 mi
| Address | Dist | Beds/Ba | Sqft | Sold | Price | $/sf | Match |
|---|---|---|---|---|---|---|---|
| 1857 State St | 0.00mi | 6/3.0 | 2,813 (-7%) | 1mo | $510,000 | $181 | 87 |
| 1835 State St | 0.04mi | 5/3.0 (-1) | 3,087 (+2%) | 17mo | $469,900 | $152 | 76 |
| 214 Welton St | 0.24mi | 5/3.0 (-1) | 3,388 (+12%) | 16mo | $525,000 | $155 | 52 |
| 50 Hubbard Pl | 0.62mi | 6/3.0 | 2,904 (-4%) | 15mo | $512,500 | $176 | 51 |
Match score weights: distance 35% · size 25% · config 20% · recency 20%. Top-matched comps best support the ARV.
Projected returns pro-forma
-3.0% appreciation · 0.21% rent growth · sell at horizon
- IRR
- -2.5%
- Equity multiple
- 0.91×
- Total profit
- $-12,303
- Equity at exit
- $72,315
- IRR
- 3.6%
- Equity multiple
- 1.22×
- Total profit
- $30,525
- Equity at exit
- $41,934
Cash invested: $135,800 (down + closing). Projections, not guarantees.
Landlord ↔ Tenant lean methodology
- Overall (STATE)
- 27 Tenant-Leaning
- State Connecticut
- 27 Tenant-Leaning · D+7
- County
- — inherits STATE
- City
- — inherits STATE
ZIP-level market 06517
- Rents YoY
- 0.2%
- Active inventory
- 83
- Price-to-rent
- 19.1×
Monthly cashflow live
- Estimated rent
- $6,354 high interval (Pro) →
- Mortgage (P&I)
- −$2,543
- Tax from tax record
- −$966 /mo · $11,591/yr
- Insurance
- −$202
- HOA
- −$0
- Vacancy / Maint / Mgmt
- −$1,334
- Net cashflow
- $1,308
Break-even live
Sensitivity live
| Price | -10% $1,583 | -5% $1,446 | +0% $1,308 | +5% $1,171 | +10% $1,034 |
|---|---|---|---|---|---|
| Rent | -10% $806 | -5% $1,057 | +0% $1,308 | +5% $1,559 | +10% $1,810 |
| Rate | -1.0pp $1,553 | -0.5pp $1,432 | base $1,308 | +0.5pp $1,183 | +1.0pp $1,055 |
3-unit breakdown (identical units grouped — click to expand)
| Units | Beds | Baths | Est. rent |
|---|---|---|---|
| 3× units | 2 | 1 | $6,354 |
| #1 | 2 | 1 | $2,118 |
| #2 | 2 | 1 | $2,118 |
| #3 | 2 | 1 | $2,118 |
| Total (3 units) | $6,354 | ||
UW: 25.0% down · 7.5% · 30yr · 1.5% tax · 5.0% vac · 8.0% maint · 8.0% mgmt
Financing live
Cash to close
- Down payment
- $121,250
- Closing costs
- $14,550
- Reserves months
- —
- Total cash needed
- —
Loan-product check · same deal, 3 products live
Conventional
25% down · 7.5% · 30yr
- Down + closing
- —
- Monthly P&I
- —
- Monthly cashflow
- —
- DSCR
- —
- Eligible?
- —
Personal DTI + credit; lowest rate.
DSCR
20% down · 8.5% · 30yr
- Down + closing
- —
- Monthly P&I
- —
- Monthly cashflow
- —
- DSCR
- —
- Eligible?
- —
No personal income docs; deal must DSCR.
Hard money
10% down · 12.0% · 12mo
- Down + closing
- —
- Monthly P&I
- —
- Monthly cashflow
- —
- DSCR
- —
- Eligible?
- —
Short-term bridge; refi at stabilization.
Rent comps 1 comps
| Address | Beds | Baths | Sqft | Rent | $/sqft | DOM | Units | Dist |
|---|---|---|---|---|---|---|---|---|
| 589 Winchester Ave Unit 3 New Haven, CT | 5.0 | 1.0 | 3936 | $2,650 | $0.67 | 45d | 1 | 1.43mi |
Listing history 4 events
-
2026-04-15status Under Contract
-
2026-04-13$485,000 Active
-
2026-04-12historical $485,000
-
2008-09-22soldstatus $49,160
ⓘ Source: listings_history table (triggers on properties + properties_extension) + one-shot
backfill from property_details.listing_events for pre-trigger history.
Tax reassessment forecast CT · Partial reset (capped growth)
- Current annual tax
- $11,591 · $966/mo
- Projected year-2 tax
- $11,591 · $966/mo
- Expected delta
- $0/yr ($0/mo · 0.0%)
ⓘ Screening estimate from a state-policy table — verify with the county assessor before closing.
Climate risk First Street
- Flood 6/10 Major FEMA zone X (unshaded) · 69% chance over 30 yrs
- Wildfire 3/10 Moderate
- Heat 6/10 Major 7 d/yr ≥99°F today · 16 d/yr by 30 yrs out
- Wind 6/10 Major 54% chance of damaging wind over 30 yrs
- Air quality 5/10 Major 6 unhealthy d/yr today · 8 by 30 yrs out
Nearby sold comps map
Loading sold comps map…
Walkable amenities ~0.75 mi
Loading nearby amenities…
Taxation est. · year 1
- Rental income
- $76,248
- − Mortgage interest
- −$27,168
- − Property taxes
- −$11,591
- − Insurance
- −$2,425
- − Repairs & maintenance
- −$6,100
- − Management
- −$6,100
- − Depreciation
- −$14,109
- Taxable income
- $8,756
- Est. tax owed @ 24.0%
- −$2,101
- After-tax cash flow
- $13,598/yr
For passive investors: Depreciation is non-cash, so a rental often shows a tax loss while cash-flowing — sheltering income. Rental losses are passive: they offset passive income freely, and up to $25,000/yr can offset ordinary (W-2) income if you actively participate and your MAGI is under $100k (phasing out to $0 by $150k); unused losses carry forward. On sale, claimed depreciation is recaptured at up to 25%, and gains may owe capital-gains tax (a 1031 exchange can defer both). Figures are a year-1 estimate at your 24.0% rate — not tax advice; consult a CPA.
Schools (NCES district)
- District
- Hamden School District
- NCES district ID
- 0901860
- Math proficiency
- 30% ▼ -13.00%
- Reading proficiency
- 43% ▼ -7.00%
- Median HH income
- $68,821
- Composite
- 33.34/100
- National rank
- #5490
- State rank
- #106 of 153 in CT
Livability — New Haven
- Score
- 79/100
- State rank
- #31
- US rank
- #2190
Category grades
Schools grade is shown separately in the Schools card above.
Census & demographics
- County
- New Haven County · 688,236 people
- City population
- 61,150
- Metro
- New Haven-Milford, CT
- Population (ZIP)
- 14,221
- Household income
- $104,550
- Rent vs Own
- Severe rent burden
- 531.0
Population outlook (South Central Connecticut County) Hauer SSP2
- By 2040
- 608,362
Race, ethnicity, and origin ACS 2023
- Neighborhood character
- Diverse neighborhood (Simpson 0.60)
- Race & ethnicity
- White 58% Black 19% Hispanic / Latino 17% Two or more races 7% Asian 2%
- Hispanic origin (detail)
- Puerto Rican 11% Dominican 2%
- Common ancestry
- Romanian 5% Scotch-Irish 2% Lithuanian 2%
- Foreign-born
- 12% · Canada, Jamaica, United Kingdom
- Languages at home
- 80% English-only · Spanish 12% French/Haitian/Cajun 2% Other Indo-European 1%
Political lean MEDSL · South Central Connecticut
- 2024 margin
- Strong D (+20.1) · D 59.0% · R 38.9% · Other 2.1%
- All cycles
- 2024: D+20.1
Not yet ingested
- Civics
- —
Market trends
- HPI YoY
- ▼ -204.00%
- Current HPI
- 255.2756
- Rent YoY
- ▲ 0.21%
- Metro
- New Haven-Milford, CT
- State GDP YoY
- ▲ 1.06%
- F500 in state
- 38
Industry mix (Fortune 500 HQ in CT)
| Industry | F500 HQs | Revenue |
|---|---|---|
| Industrial Machinery | 4 | $38B |
|
||
| Insurance | 3 | $71B |
|
||
| Financial Services | 2 | $25B |
|
||
| Transportation / Logistics | 2 | $18B |
|
||
| Healthcare | 1 | $247B |
|
||
| Telecommunications | 1 | $55B |
|
||
Price history
+886.6% since first listed4 events — show timeline
- 2026-04-15 Pending — Smart MLS
- 2026-04-13 Listed $485,000 Smart MLS
- 2026-04-12 Coming Soon $485,000 Smart MLS
- 2008-09-22 Sold (Public Records) $49,160 Public Records
Property tax history
+6.0%/yrLatest (2023): $11,591 · +1.6% YoY. Source: county tax records.
Cash-flow waterfall
monthlySold comps — $/sqft
last 12 mo · ≤1 miLoading sold comps…