110 IL Route 1 Hwy · Cave-In-Rock, IL
Flood risk 1/10 · Minimal
- FEMA flood zone
- X (unshaded)
- Chance of flooding over 30 yrs
- 0.0%
- Est. flood insurance / yr
- $507 – $1,088
Fire risk 2/10 · Minimal
- Est. fire insurance / yr
- $804 – $1,492
Heat risk 5/10 · Moderate
- Hot days now (above 107°F)
- 7 days/yr
- Hot days in 30 yrs
- 21 days/yr
Wind risk 3/10 · Minor
- Chance of severe wind over 30 yrs
- 6.0%
Air-quality risk 2/10 · Minimal
- Unhealthy air days now
- 1 days/yr
- Unhealthy air days in 30 yrs
- 1 days/yr
Risk factors via First Street. Map © Google.
Why this score? — see what drove the B grade
The composite is a weighted blend of 9 inputs, each scored 0–100. Each bar is that input's sub-score; the figure is the points it added to the 100-point composite (weight × sub-score).
- Cash flow +30.0/30.0
- 1% rule +10.0/10.0
- DSCR +10.0/10.0
- ARV discount +8.6/15.0
- Appreciation +5.4/10.0
- Rent growth +2.5/5.0
- Livability +2.5/5.0
- Condition / age +2.2/5.0
- Schools +1.0/10.0
$79,900
🖨 Deal sheet 📄 Offer letter ✓ Due diligence
Listing remarks
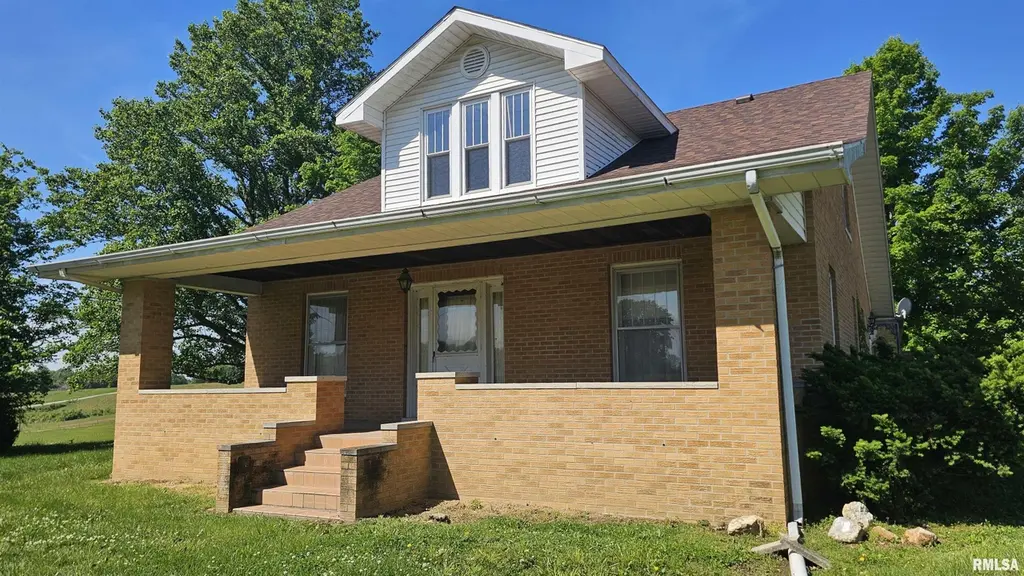
If you’ve been searching for a home with character, space, and the feeling of simpler days, this charming 4-bedroom brick home in the Cave-In-Rock area is full of opportunity. Sitting on approximately . 75 acre, this property captures the heart of classic Southern Illinois living with its welcoming porches, mature setting, and timeless craftsmanship. The large covered front porch is made for “front porch sitting, ” morning coffee, and quiet evenings. Additional exterior entrances add charm and functionality, including elegant French doors off the formal dining room leading to a landing porch perfect for flowers and plants. A second rear entrance features a spacious concret
Key facts
- Covered front porch
- Built-in cabinetry
- French doors
Tags
Property features AI
Exterior
- Parking: Detached 1-car garage
- Utilities: Public water available; Septic system on site; Electric service
- Home design: Single family residence; Built in 1920; Living area about 2015 (building area total listed)
- Construction: Originally built in 1920
- Exterior features: Shingle roof; Outbuilding on property; Sloped lot; Paved road access; Lot dimensions approx. 240 x 136
Interior
- Kitchen: Dishwasher; Refrigerator
- Bedrooms: 4 bedrooms total; Main-level bedroom (approx. 12.4 x 11.11) with egress window; Main-level bedroom (approx. 13.1 x 11.1) with egress window; Upper-level bedroom (approx. 11.9 x 11.4) with egress window; Upper-level bedroom (approx. 7.7 x 9.5) with egress window; Additional unfinished bedroom (upper level, approx. 13.11 x 12.4)
- Flooring: Carpet in many living areas and bedrooms; Hardwood in additional rooms/areas; Vinyl in laundry room
- Bathrooms: 1 full bathroom
- Heating & cooling: Central air conditioning; Baseboard heating; Wall unit(s)
- Interior features: Attic storage; Full, unfinished basement
- Laundry & utility: Main-level laundry room (vinyl flooring, approx. 7.5 x 10.3); Electric water heater
Neighborhood map
What this means for you Summary
Snapshot
- This is a 4-bed/1.0-bath single-family listed at $80k. Condition is rated fair.
Deal economics
- At list price, monthly cash flow is $470 ($6k/yr) — positive.
- The deal already cash-flows at list — no discount required.
- Meets the 1% rule at list price ($1k rent vs $80k).
- Recommended offer: $78k (3.0% below list) — sets the bar for market timing.
Location & tenants
- Location reads: area grade B — affects rentability + tenant quality, not the cash-flow math above.
- Hardin County CUSD 1 (rural): math 7% / reading 17% proficiency, ranked #564 of 620 in IL (top 91%) — low school quality limits family demand, transient renter base, plan for 1-2y turnover.
- Zoned schools: Hardin County High School (math 5% / reading 24%, grade F, #473 of 693 statewide, top 69%, 161 students, 0% FRL) — zoned schools average 0% FRL vs 52% district-wide (52 pts lower); this property's tenant base skews higher-income than the district average.
- Market conditions: 6 active listings in the ZIP.
Forward outlook
- In year one you build about $1k of equity ($552 loan paydown + $689 appreciation (0.9% local appreciation)).
- Hardin County population projected at -26% by 2050 — secular population decline; favor cash flow + early exit over multi-decade hold.
- At projected returns (0.9% appreciation + 3.0% rent growth), your $22k cash investment doubles in ~4 years — after that, you're playing with house money.
Negotiation context
- It's been on market 38 days — a 3% lower offer ($78k) is reasonable based on typical stale-listing flexibility.
Risks & watch-outs
- Watch-outs: built in 1920 — expect roof / HVAC / electrical / plumbing capex.
- Climate carrying-cost: extreme-heat days projected 7→21/yr by 2055 (HVAC capex compounding) — expect insurance premiums to compound above CPI over the hold.
Questions for the listing agent
- It's been on market 38 days. Have you received any prior offers? Is the seller open to a 3% concession, seller financing, or rate buy-down credit?
- Have any recent inspections been done? Can we get a copy of the seller's disclosures and any deferred-maintenance estimates?
- Built in 1920 — when were the roof, HVAC, electrical panel, plumbing, and water heater last replaced?
- Is there a deadline driving the sale (1031 exchange, divorce, estate, relocation)? That informs how much negotiation room exists.
- What's the average days-on-market for RENTAL listings here right now (not sales)? A rising rental-DOM trend means longer vacancies and softer asking-rent achievability than the comps imply.
- What's the recent tenant-quality profile in this submarket — average credit score on applications, eviction rate, late-payment / NSF rate, and stable-employment percentage? A property-management company in the area should have these aggregated.
- How much new for-sale + rental construction is in the pipeline within 1–3 miles? Heavy new supply typically softens prices + rents 12–24 months out; constrained supply supports both.
Investment metrics
- 1% rule
- 1.62% ✓
- Cap rate
- 13.36%
- Cash-on-cash
- 25.22%
- DSCR
- 2.12
- GRM
- 5.1
CMA / ARV
- ARV (median comp)
- $81,868
- List price
- $79,900
- Delta
- -2.40%
- Verdict
- FAIR
- Comps
- 3 within 1.0 mi
Show comp detail 1 sale within ~0.75 mi
| Address | Dist | Beds/Ba | Sqft | Sold | Price | $/sf | Match |
|---|---|---|---|---|---|---|---|
| 110 IL Route 1 Hwy | 0.00mi | 4/1.0 | 2,015 (0%) | 0mo | $90,000 | $45 | 100 |
Match score weights: distance 35% · size 25% · config 20% · recency 20%. Top-matched comps best support the ARV.
Projected returns pro-forma
0.86% appreciation · 3.0% rent growth · sell at horizon
- IRR
- 27.2%
- Equity multiple
- 2.38×
- Total profit
- $30,930
- Equity at exit
- $26,707
- IRR
- 30.0%
- Equity multiple
- 4.57×
- Total profit
- $79,928
- Equity at exit
- $35,055
Cash invested: $22,372 (down + closing). Projections, not guarantees.
Landlord ↔ Tenant lean methodology
- Overall (STATE)
- 43 Moderately Tenant-Leaning
- State Illinois
- 43 Moderately Tenant-Leaning · D+7
- County
- — inherits STATE
- City
- — inherits STATE
ZIP-level market 62919
- Home prices YoY
- 1.0%
- Active inventory
- 6
- Price-to-rent
- 5.1×
Monthly cashflow live
- Estimated rent
- $1,294 medium interval (Pro) →
- Mortgage (P&I)
- −$419
- Tax est. 1.5%
- −$100 /mo · $1,198/yr
- Insurance
- −$33
- HOA
- −$0
- Vacancy / Maint / Mgmt
- −$272
- Net cashflow
- $470
Break-even live
UW: 25.0% down · 7.5% · 30yr · 1.5% tax · 5.0% vac · 8.0% maint · 8.0% mgmt
Financing live
Cash to close
- Down payment
- $19,975
- Closing costs
- $2,397
- Reserves months
- —
- Total cash needed
- —
Loan-product check · same deal, 3 products live
Conventional
25% down · 7.5% · 30yr
- Down + closing
- —
- Monthly P&I
- —
- Monthly cashflow
- —
- DSCR
- —
- Eligible?
- —
Personal DTI + credit; lowest rate.
DSCR
20% down · 8.5% · 30yr
- Down + closing
- —
- Monthly P&I
- —
- Monthly cashflow
- —
- DSCR
- —
- Eligible?
- —
No personal income docs; deal must DSCR.
Hard money
10% down · 12.0% · 12mo
- Down + closing
- —
- Monthly P&I
- —
- Monthly cashflow
- —
- DSCR
- —
- Eligible?
- —
Short-term bridge; refi at stabilization.
Listing history 13 events
-
2026-06-13days on market $79,900 Under Contract 38 DOM
-
2026-06-12days on market $79,900 Under Contract 37 DOM
-
2026-06-09days on market $79,900 Under Contract 34 DOM
-
2026-06-08days on market $79,900 Under Contract 33 DOM
-
2026-06-07days on market $79,900 Under Contract 32 DOM
-
2026-06-05days on market $79,900 Under Contract 30 DOM
-
2026-06-04days on market $79,900 Under Contract 28 DOM
-
2026-06-02days on market $79,900 Under Contract 27 DOM
-
2026-06-01days on market $79,900 Under Contract 26 DOM
-
2026-05-31days on market $79,900 Under Contract 25 DOM
-
2026-05-31days on market $79,900 Under Contract 24 DOM
-
2026-05-13historical Under Contract 1460-char remark
-
2026-05-05$79,900 Active 1460-char remark
ⓘ Source: listings_history table (triggers on properties + properties_extension) + one-shot
backfill from property_details.listing_events for pre-trigger history.
Climate risk First Street
- Flood 1/10 Low FEMA zone X (unshaded) · 0% chance over 30 yrs
- Wildfire 2/10 Low
- Heat 5/10 Major 7 d/yr ≥107°F today · 21 d/yr by 30 yrs out
- Wind 3/10 Moderate 6% chance of damaging wind over 30 yrs
- Air quality 2/10 Low 1 unhealthy d/yr today · 1 by 30 yrs out
Nearby sold comps map
Loading sold comps map…
Walkable amenities ~0.75 mi
Loading nearby amenities…
Taxation est. · year 1
- Rental income
- $15,531
- − Mortgage interest
- −$4,476
- − Property taxes
- −$1,198
- − Insurance
- −$400
- − Repairs & maintenance
- −$1,242
- − Management
- −$1,242
- − Depreciation
- −$2,324
- Taxable income
- $4,648
- Est. tax owed @ 24.0%
- −$1,115
- After-tax cash flow
- $4,528/yr
For passive investors: Depreciation is non-cash, so a rental often shows a tax loss while cash-flowing — sheltering income. Rental losses are passive: they offset passive income freely, and up to $25,000/yr can offset ordinary (W-2) income if you actively participate and your MAGI is under $100k (phasing out to $0 by $150k); unused losses carry forward. On sale, claimed depreciation is recaptured at up to 25%, and gains may owe capital-gains tax (a 1031 exchange can defer both). Figures are a year-1 estimate at your 24.0% rate — not tax advice; consult a CPA.
Condition & rehab AI · 13 photos
This home requires moderate renovations to improve its condition and increase its value. Key areas for improvement include the kitchen, bathrooms, and interior walls.
Repairs flagged
- Major kitchen cabinets — severe wear and tear
- Major bathroom fixtures — dated and worn
- Major interior walls — peeling paint and wallpaper
- Minor landscaping — overgrown areas need trimming
Value-add opportunities
- Both paint interior walls — Fresh paint can make a significant difference in the home's appearance and value
- Both replace kitchen cabinets — New cabinets can greatly enhance the kitchen's functionality and aesthetic appeal
- Both update bathroom fixtures — Modern fixtures can improve the home's functionality and appeal to potential buyers
Renovation cost estimate screening
| Repair item | Severity | Est. cost |
|---|---|---|
| kitchen cabinets · severe wear and tear | Major | $15,000–50,000 |
| bathroom fixtures · dated and worn | Major | $15,000–50,000 |
| interior walls · peeling paint and wallpaper | Major | $15,000–50,000 |
| landscaping · overgrown areas need trimming | Minor | $500–3,000 |
| Total estimated repair cost · 4 items | $45,500–153,000 |
Value-add ROI direction
- Both paint interior walls — Fresh paint can make a significant difference in the home's appearance and value ↑
- Both replace kitchen cabinets — New cabinets can greatly enhance the kitchen's functionality and aesthetic appeal ↑
- Both update bathroom fixtures — Modern fixtures can improve the home's functionality and appeal to potential buyers ↑
ⓘ Cost ranges are severity-bucket heuristics (US national rule-of-thumb). Get contractor quotes + a written scope before underwriting a rehab budget.
Schools (NCES district)
- District
- Hardin County CUSD 1
- NCES district ID
- 1718200
- Math proficiency
- 7% ▼ -6.00%
- Reading proficiency
- 17% ▼ -6.00%
- Median HH income
- $37,617
- Composite
- 10.06/100
- National rank
- #9807
- State rank
- #564 of 620 in IL
Livability — Cave-In-Rock
No livability data for this city. (Only ~50 U.S. cities are tracked.)
Census & demographics
- Population (ZIP)
- 775
Population outlook (Hardin County) Hauer SSP2
- Today (2025)
- 3,760 people
- By 2030
- 3,548 · -5.6%
- By 2040
- 3,134 · -16.6%
- By 2050
- 2,786 · -25.9%
- By 2075
- 2,118 · -43.7%
- By 2100
- 1,578 · -58.0%
Race, ethnicity, and origin ACS 2023
- Neighborhood character
- Predominantly White (94%)
- Race & ethnicity
- White 94% Black 4% Hispanic / Latino 2% Two or more races 1%
- Common ancestry
- Italian 6% Serbian 5% Slovak 3%
- Foreign-born
- 1% · Canada
- Languages at home
- 98% English-only · Spanish 2%
Political lean MEDSL · Hardin
- 2024 margin
- Solid R (+61.8) · D 18.6% · R 80.3% · Other 1.1%
- 2008→2024 swing
- -42.3pp toward R · 2008: -19.4pp · 2024: -61.8pp
- All cycles
- 2024: R+61.8 2020: R+57.4 2016: R+57.7 2012: R+34.0 2008: R+19.4
Not yet ingested
- Civics
- —
Market trends
- HPI YoY
- ▲ 0.86%
- Current HPI
- 87.2379
- Rent YoY
- —
- Metro
- —
- State GDP YoY
- ▲ 1.59%
- F500 in state
- 60
Industry mix (Fortune 500 HQ in IL)
| Industry | F500 HQs | Revenue |
|---|---|---|
| Insurance | 4 | $201B |
|
||
| Consumer Goods | 4 | $87B |
|
||
| Industrial Machinery | 3 | $64B |
|
||
| Healthcare | 2 | $55B |
|
||
| Retail / Pharmacy | 1 | $148B |
|
||
| Agriculture / Food | 1 | $86B |
|
||
Price history
+12.6% since first listed3 events — show timeline
- 2026-06-12 Sold (MLS) $90,000 RMLSA as Distributed by MLS Grid
- 2026-05-13 Contingent — RMLSA as Distributed by MLS Grid
- 2026-05-05 Listed $79,900 RMLSA as Distributed by MLS Grid
Cash-flow waterfall
monthlySold comps — $/sqft
last 12 mo · ≤1 miLoading sold comps…