 Duplex
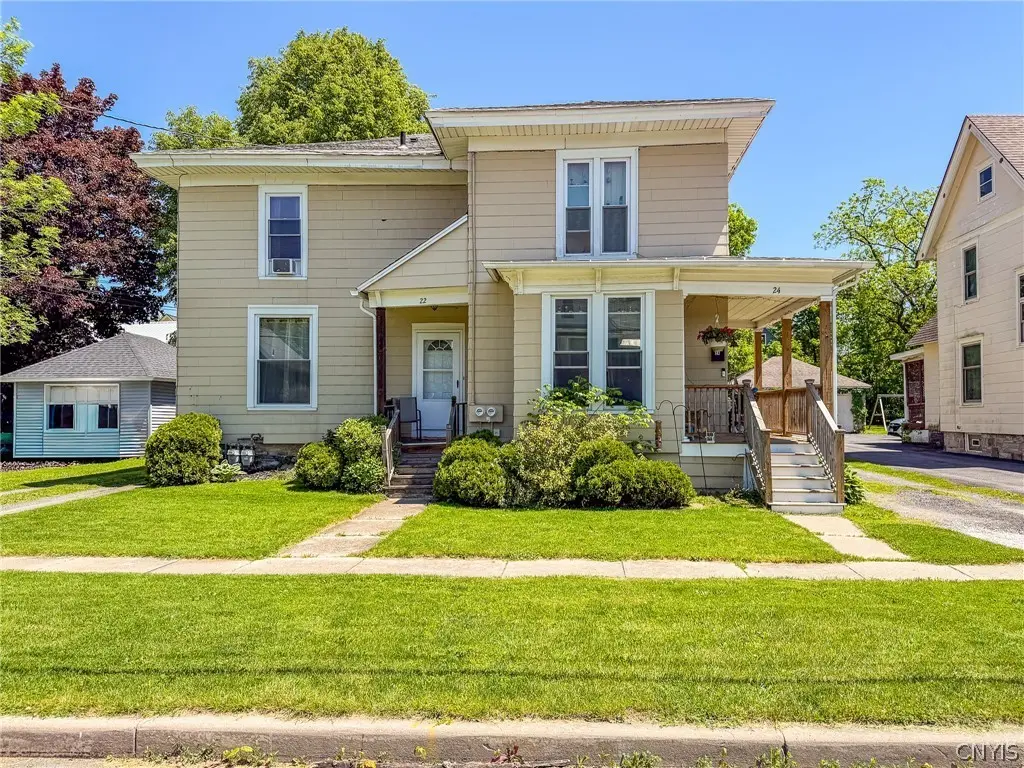
22-24 Burt Ave · Auburn, NY
Flood risk 4/10 · Minor
- FEMA flood zone
- X (unshaded)
- Chance of flooding over 30 yrs
- 0.21%
- Est. flood insurance / yr
- $473 – $860
Fire risk 1/10 · Minimal
- Est. fire insurance / yr
- $691 – $1,283
Heat risk 2/10 · Minimal
- Hot days now (above 96°F)
- 7 days/yr
- Hot days in 30 yrs
- 15 days/yr
Wind risk 1/10 · Minimal
- Chance of severe wind over 30 yrs
- 1.0%
Air-quality risk 2/10 · Minimal
- Unhealthy air days now
- 0 days/yr
- Unhealthy air days in 30 yrs
- 1 days/yr
Risk factors via First Street. Map © Google.
Why this score? — see what drove the C+ grade
The composite is a weighted blend of 9 inputs, each scored 0–100. Each bar is that input's sub-score; the figure is the points it added to the 100-point composite (weight × sub-score).
- Cash flow +30.0/30.0
- DSCR +10.0/10.0
- 1% rule +9.7/10.0
- Livability +3.7/5.0
- ARV discount +3.4/15.0
- Schools +3.0/10.0
- Rent growth +2.5/5.0
- Condition / age +2.5/5.0
- Appreciation +0.0/10.0
$214,900
🖨 Deal sheet 📄 Offer letter ✓ Due diligence
Multi-family units
County records classify this as Multi-Family (2-4 Unit). Listing-text estimate: 2 units. confirmed
Listing remarks
Exceptional income-producing opportunity in a prime Auburn location! This spacious and well-maintained two-family property at 22-24 Burt Ave offers the perfect blend of character, space, and investment potential. Boasting nearly 2,700 square feet, the property features 5 total bedrooms, 2 full baths, and two spacious units with separate kitchens and expansive living areas — ideal for owner-occupants looking to offset their mortgage or investors seeking strong rental income potential. Built in 1920 with timeless Old Style charm, the home offers large rooms, abundant natural light, and functional layouts tenants will appreciate. Outside, enjoy a covered front porch, concrete patio, fenc
Key facts
- Covered front porch
- Separate kitchens
- Two family property
Tags
Property features AI
Finance
- Other: Owner pays: other (see remarks); Rent includes: see remarks
- Financial info: Two-unit building with separate gas and electric meters for each unit; Each unit currently rents for $750 (actual); Operating expenses include utilities (see remarks)
Exterior
- Parking: Gravel / unpaved parking
- Utilities: Electricity connected; Public water connected; Sewer connected
- Home design: Two-story multi-family building; Existing condition
- Construction: Composite siding; Asphalt roof; Block foundation; Built (existing)
- Exterior features: Rectangular residential lot (approx. 66 x 132); Partial fence; Patio; Covered porch; City street frontage
Interior
- Kitchen: Each unit includes dishwasher, oven/range, refrigerator, microwave
- Bedrooms: Two 2-bedroom units
- Flooring: Carpet; Tile; Vinyl; Varies
- Bathrooms: Two full bathrooms (one in each unit)
- Heating & cooling: Gas heating; Hot water / radiator heating
- Interior features: Full basement; Den / family room; Covered porch; Patio; Partial fencing
- Laundry & utility: Each unit has in-unit washer and dryer; Gas water heater
Neighborhood map
What this means for you Summary
Snapshot
- This is a 2 × 2-bed/1.0-bath units multifamily listed at $215k.
Deal economics
- At list price, monthly cash flow is $1k ($13k/yr) — positive. Per door: $521/mo.
- The deal already cash-flows at list — no discount required.
- Meets the 1% rule at list price ($3k rent vs $215k).
- Recommended offer: $212k (1.5% below list) — sets the bar for market timing.
- Cap rate 12.1% vs local median 7.6% in Auburn — top-decile yield for the area; either an underpriced asset or a hidden risk that comps aren't pricing in. Stress-test before assuming the spread holds.
Location & tenants
- Location reads 74/100 on livability (#298 in NY, #4,814 nationally) — a middle-class / working-renter tenant base. Strengths: cost of living A+, housing A+, health & safety A+; Watch: schools D, amenities D-, commute F.
- Auburn City School District (town): math 31% / reading 39% proficiency, ranked #558 of 590 in NY (top 95%) — families likely to look elsewhere, expect single-tenant / working-renter base with shorter leases.
- Market conditions: 221 active listings in the ZIP; 1 comparable units currently listed for rent nearby; 161 units permitted in Cayuga County in 2024 (65 in 5+ unit buildings).
- At $3,162/mo this rent would consume 62% of the median local household income ($61k/yr) (locally 1449% of renters already pay >50% of income on rent) — very limited rent-growth headroom before tenants either downsize or default.
Forward outlook
- Local home prices are declining (-3.0%/yr); year-one equity from $1k of loan paydown is wiped out by about $6k of value loss. Plan a longer hold.
- Cayuga County population projected at -18% by 2050 — secular population decline; favor cash flow + early exit over multi-decade hold.
- At projected returns (-3.0% appreciation + 3.0% rent growth), your $60k cash investment doubles in ~6 years — after that, you're playing with house money.
Negotiation context
- It's been on market 18 days — a 2% lower offer ($212k) is reasonable based on typical stale-listing flexibility.
- Current owner paid $60k; list at $215k implies a 259% gain — meaningful room to come down on a strong offer.
Risks & watch-outs
- Watch-outs: built in 1920 — expect roof / HVAC / electrical / plumbing capex.
Questions for the listing agent
- Can we see the unit-by-unit rent roll, current vacancy, and any below-market leases? What's the average tenancy length?
- What capital expenditures (roof, boiler, parking lot, exteriors) have been made in the last 5 years, and what's planned in the next 2?
- Built in 1920 — when were the roof, HVAC, electrical panel, plumbing, and water heater last replaced?
- Is there a deadline driving the sale (1031 exchange, divorce, estate, relocation)? That informs how much negotiation room exists.
- Schools are D-rated, which usually means shorter tenancies and higher turnover. Who's the typical renter profile here, and what's been the actual vacancy rate?
- What's the average days-on-market for RENTAL listings here right now (not sales)? A rising rental-DOM trend means longer vacancies and softer asking-rent achievability than the comps imply.
- What's the recent tenant-quality profile in this submarket — average credit score on applications, eviction rate, late-payment / NSF rate, and stable-employment percentage? A property-management company in the area should have these aggregated.
- How much new apartment / multifamily construction is in the pipeline within 1–3 miles? Heavy new supply (>2% of stock underway) typically softens rents 12–24 months out; light construction supports rent growth.
Investment metrics
- 1% rule
- 1.47% ✓
- Cap rate
- 12.11%
- Cash-on-cash
- 20.78%
- DSCR
- 1.92
- GRM
- 5.7
CMA / ARV
- ARV (on-the-fly)
- $197,027
- Comps found
- 7
Show comp detail 7 sales within ~0.75 mi
| Address | Dist | Beds/Ba | Sqft | Sold | Price | $/sf | Match |
|---|---|---|---|---|---|---|---|
| 11 Elizabeth St | 0.20mi | 6/3.0 (+1) | 2,708 (+0%) | 10mo | $210,000 | $78 | 73 |
| 42 Elizabeth St | 0.17mi | 6/2.5 (+1) | 2,804 (+4%) | 10mo | $205,000 | $73 | 71 |
| 16 Mattie St | 0.30mi | 6/2.0 (+1) | 2,527 (-6%) | 2mo | $185,000 | $73 | 69 |
| 19 School St | 0.46mi | 6/2.0 (+1) | 2,520 (-7%) | 14mo | $160,100 | $64 | 51 |
| 92 Fitch Ave | 0.69mi | 6/3.0 (+1) | 2,853 (+6%) | 2mo | $270,890 | $95 | 47 |
| 28 Bradford St | 0.54mi | 6/2.0 (+1) | 2,520 (-7%) | 18mo | $125,000 | $50 | 44 |
| 13 School St | 0.47mi | 6/2.0 (+1) | 2,304 (-15%) | 10mo | $177,000 | $77 | 41 |
Match score weights: distance 35% · size 25% · config 20% · recency 20%. Top-matched comps best support the ARV.
Projected returns pro-forma
-3.0% appreciation · 3.0% rent growth · sell at horizon
- IRR
- 13.2%
- Equity multiple
- 1.52×
- Total profit
- $31,569
- Equity at exit
- $32,042
- IRR
- 22.0%
- Equity multiple
- 2.88×
- Total profit
- $113,063
- Equity at exit
- $18,581
Cash invested: $60,172 (down + closing). Projections, not guarantees.
Landlord ↔ Tenant lean methodology
- Overall (STATE)
- 15 Strongly Tenant-Friendly
- State New York
- 15 Strongly Tenant-Friendly · D+10
- County
- — inherits STATE
- City
- — inherits STATE
ZIP-level market 13021
- Home prices YoY
- -22.4%
- Active inventory
- 221
- Price-to-rent
- 11.3×
Monthly cashflow live
- Estimated rent
- $3,162 medium interval (Pro) →
- Mortgage (P&I)
- −$1,127
- Tax from tax record
- −$240 /mo · $2,874/yr
- Insurance
- −$90
- HOA
- −$0
- Vacancy / Maint / Mgmt
- −$664
- Net cashflow
- $1,042
Break-even live
2-unit breakdown (identical units grouped — click to expand)
| Units | Beds | Baths | Est. rent |
|---|---|---|---|
| 2× units | 2 | 1 | $3,162 |
| #1 | 2 | 1 | $1,581 |
| #2 | 2 | 1 | $1,581 |
| Total (2 units) | $3,162 | ||
UW: 25.0% down · 7.5% · 30yr · 1.5% tax · 5.0% vac · 8.0% maint · 8.0% mgmt
Financing live
Cash to close
- Down payment
- $53,725
- Closing costs
- $6,447
- Reserves months
- —
- Total cash needed
- —
Loan-product check · same deal, 3 products live
Conventional
25% down · 7.5% · 30yr
- Down + closing
- —
- Monthly P&I
- —
- Monthly cashflow
- —
- DSCR
- —
- Eligible?
- —
Personal DTI + credit; lowest rate.
DSCR
20% down · 8.5% · 30yr
- Down + closing
- —
- Monthly P&I
- —
- Monthly cashflow
- —
- DSCR
- —
- Eligible?
- —
No personal income docs; deal must DSCR.
Hard money
10% down · 12.0% · 12mo
- Down + closing
- —
- Monthly P&I
- —
- Monthly cashflow
- —
- DSCR
- —
- Eligible?
- —
Short-term bridge; refi at stabilization.
Rent comps 1 comps
| Address | Beds | Baths | Sqft | Rent | $/sqft | DOM | Units | Dist |
|---|---|---|---|---|---|---|---|---|
| 5 Sheridan St Auburn, NY | 4.0 | 2.0 | 1788 | $1,995 | $1.12 | 43d | 1 | 0.77mi |
Listing history 14 events
-
2026-06-19days on market $214,900 Active 18 DOM
-
2026-06-18days on market $214,900 Active 17 DOM
-
2026-06-17days on market $214,900 Active 16 DOM
-
2026-06-16days on market $214,900 Active 15 DOM
-
2026-06-15days on market $214,900 Active 14 DOM
-
2026-06-14days on market $214,900 Active 12 DOM
-
2026-06-12days on market $214,900 Active 11 DOM
-
2026-06-09days on market $214,900 Active 8 DOM
-
2026-06-08days on market $214,900 Active 7 DOM
-
2026-06-07days on market $214,900 Active 6 DOM
-
2026-06-05days on market $214,900 Active 3 DOM
-
2026-06-03days on market $214,900 Active 2 DOM
-
2026-06-02remarks 693-char remark
-
2026-06-02$214,900 Active 1 DOM
ⓘ Source: listings_history table (triggers on properties + properties_extension) + one-shot
backfill from property_details.listing_events for pre-trigger history.
Tax reassessment forecast NY · Partial reset (capped growth)
- Current annual tax
- $2,874 · $240/mo
- Projected year-2 tax
- $3,253 · $271/mo
- Expected delta
- +$379/yr (+$32/mo · 13.2%)
ⓘ Screening estimate from a state-policy table — verify with the county assessor before closing.
Climate risk First Street
- Flood 4/10 Moderate FEMA zone X (unshaded) · 21% chance over 30 yrs
- Wildfire 1/10 Low
- Heat 2/10 Low 7 d/yr ≥96°F today · 15 d/yr by 30 yrs out
- Wind 1/10 Low 100% chance of damaging wind over 30 yrs
- Air quality 2/10 Low 0 unhealthy d/yr today · 1 by 30 yrs out
Nearby sold comps map
Loading sold comps map…
Walkable amenities ~0.75 mi
Loading nearby amenities…
Taxation est. · year 1
- Rental income
- $37,944
- − Mortgage interest
- −$12,038
- − Property taxes
- −$2,874
- − Insurance
- −$1,074
- − Repairs & maintenance
- −$3,036
- − Management
- −$3,036
- − Depreciation
- −$6,252
- Taxable income
- $9,635
- Est. tax owed @ 24.0%
- −$2,312
- After-tax cash flow
- $10,191/yr
For passive investors: Depreciation is non-cash, so a rental often shows a tax loss while cash-flowing — sheltering income. Rental losses are passive: they offset passive income freely, and up to $25,000/yr can offset ordinary (W-2) income if you actively participate and your MAGI is under $100k (phasing out to $0 by $150k); unused losses carry forward. On sale, claimed depreciation is recaptured at up to 25%, and gains may owe capital-gains tax (a 1031 exchange can defer both). Figures are a year-1 estimate at your 24.0% rate — not tax advice; consult a CPA.
Schools (NCES district)
- District
- Auburn City School District
- NCES district ID
- 3603480
- Math proficiency
- 31% ▼ -17.00%
- Reading proficiency
- 39% ▲ 2.00%
- Median HH income
- $43,567
- Composite
- 29.71/100
- National rank
- #6452
- State rank
- #558 of 590 in NY
Livability — Auburn
- Score
- 74/100
- State rank
- #298
- US rank
- #4814
Category grades
Schools grade is shown separately in the Schools card above.
Census & demographics
- Census place
- Auburn, NY
- County
- Cayuga County · 37,247 people
- City population
- 37,247
- Metro
- Auburn, NY
- Population (ZIP)
- 37,247
- Household income
- $60,712
- Rent vs Own
- Severe rent burden
- 1449.0
Population outlook (Cayuga County) Hauer SSP2
- Today (2025)
- 74,820 people
- By 2030
- 72,402 · -3.2%
- By 2040
- 66,917 · -10.6%
- By 2050
- 61,007 · -18.5%
- By 2075
- 48,047 · -35.8%
- By 2100
- 34,512 · -53.9%
Race, ethnicity, and origin ACS 2023
- Neighborhood character
- Predominantly White (87%)
- Race & ethnicity
- White 87% Two or more races 7% Black 3% Hispanic / Latino 3%
- Common ancestry
- Romanian 8% Subsaharan African 3% Lithuanian 2%
- Foreign-born
- 2% · Canada
- Languages at home
- 95% English-only · Spanish 2% Other Indo-European 1% German/W. Germanic 1%
Political lean MEDSL · Cayuga
- 2024 margin
- R (+13.0) · D 43.5% · R 56.5%
- 2008→2024 swing
- -21.5pp toward R · 2008: 8.5pp · 2024: -13.0pp
- All cycles
- 2024: R+13.0 2020: R+9.2 2016: R+13.2 2012: D+10.8 2008: D+8.5
Not yet ingested
- Civics
- —
Market trends
- HPI YoY
- ▼ -97.53%
- Current HPI
- 338.5537
- Rent YoY
- —
- Metro
- Auburn, NY
- State GDP YoY
- ▲ 2.60%
- F500 in state
- 92
Industry mix (Fortune 500 HQ in NY)
| Industry | F500 HQs | Revenue |
|---|---|---|
| Financial Services | 10 | $950B |
|
||
| Consumer Goods | 9 | $162B |
|
||
| Insurance | 4 | $225B |
|
||
| Telecommunications | 2 | $144B |
|
||
| Pharmaceuticals | 2 | $112B |
|
||
| Media / Entertainment | 2 | $69B |
|
||
Price history
+258.8% since first listed2 events — show timeline
- 2026-05-28 Listed $214,900 CNYIS
- 2001-03-27 Sold (Public Records) $59,900 Public Records
Property tax history
-1.0%/yrLatest (2025): $2,874 · +10.8% YoY. Source: county tax records.
Cash-flow waterfall
monthlySold comps — $/sqft
last 12 mo · ≤1 miLoading sold comps…