4550 Pinebrook Cir · Bradenton, FL
Flood risk 1/10 · Minimal
- FEMA flood zone
- X (unshaded)
- Chance of flooding over 30 yrs
- 0.0%
- Est. flood insurance / yr
- $507 – $1,088
Fire risk 1/10 · Minimal
- Est. fire insurance / yr
- $947 – $1,759
Heat risk 10/10 · Severe
- Hot days now (above 106°F)
- 7 days/yr
- Hot days in 30 yrs
- 28 days/yr
Wind risk 10/10 · Severe
- Chance of severe wind over 30 yrs
- 99.0%
Air-quality risk 3/10 · Minor
- Unhealthy air days now
- 2 days/yr
- Unhealthy air days in 30 yrs
- 2 days/yr
Risk factors via First Street. Map © Google.
Why this score? — see what drove the D- grade
The composite is a weighted blend of 9 inputs, each scored 0–100. Each bar is that input's sub-score; the figure is the points it added to the 100-point composite (weight × sub-score).
- ARV discount +7.5/15.0
- Cash flow +7.3/30.0
- 1% rule +6.2/10.0
- Schools +4.4/10.0
- Livability +4.0/5.0
- Condition / age +3.8/5.0
- Rent growth +2.4/5.0
- DSCR +1.5/10.0
- Appreciation +0.0/10.0
$199,500
🖨 Deal sheet (PDF) 📄 Offer letter ✓ Due diligence
Listing remarks
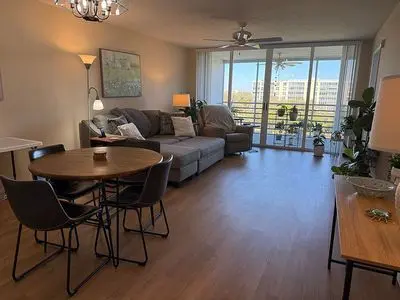
Golf course condo, close to Anna Maria Beaches, movies, shopping. This 55 and older community has everything you need. Pool, club house, pickleball and tennis courts, cable and internet included as well as water and sewer. The living room opens up to a comfortable screened porch. There is covered parking with a reserved spot. This is a quiet neighborhood in a convenient location.
Key facts
- Pickleball
- Golf course condo
- Tennis courts
Tags
Neighborhood map
What this means for you Summary
Snapshot
- This is a 2-bed/2.0-bath condo listed at $200k. Condition is rated good.
Deal economics
- At list price, monthly cash flow is $-266 ($-3k/yr) — negative.
- The deal already cash-flows at list — no discount required.
- Meets the 1% rule at list price ($2k rent vs $200k).
- Recommended offer: $194k (3.0% below list) — sets the bar for market timing.
- Cap rate 4.7% vs local median 3.6% in Bradenton — top-decile yield for the area; either an underpriced asset or a hidden risk that comps aren't pricing in. Stress-test before assuming the spread holds.
Location & tenants
- Location reads 81/100 on livability (#101 in FL, #1,528 nationally) — a professional / high-income tenant draw. Strengths: commute A+, cost of living A+, housing A+; Watch: employment D+, crime D, amenities F.
- Manatee (suburban): math 54% / reading 50% proficiency, ranked #26 of 73 in FL (top 36%) — acceptable for families but not a draw, mixed tenant base, ~2y average lease.
- Zoned schools: H. S. Moody Elementary School (math 39% / reading 24%, grade F, #1,841 of 2,144 statewide, top 86%, 606 students, 73% FRL); W. D. Sugg Middle School (math 34% / reading 28%, grade F, #462 of 571 statewide, top 81%, 1,010 students, 72% FRL); Bayshore High School (math 17% / reading 26%, grade F, #546 of 667 statewide, top 82%, 1,435 students, 65% FRL) — zoned schools average 70% FRL vs 51% district-wide (19 pts higher); higher-poverty schools than district average — tighter screening recommended.
- Zoned-school proficiency averages 28% at this address vs 52% district-wide (-24 pts) — the specific schools serving this property underperform the Manatee average; the district grade overstates school quality for this exact location.
- Market conditions: Rents soft (-0.3%/yr); 514 active listings in the ZIP; 40 comparable units currently listed for rent nearby; rentals at typical pace (median 25d on market — plan ~3-4 weeks tenant-placement turnaround); solid renter incomes; 7,472 units permitted in Manatee County in 2024 (1,782 in 5+ unit buildings).
- This rent runs 33% of the median local income ($82k/yr) — at the standard rent-burdened threshold; future hikes will face affordability resistance.
Forward outlook
- Local home prices are declining (-3.0%/yr); year-one equity from $1k of loan paydown is wiped out by about $6k of value loss. Plan a longer hold.
- Manatee County population projected at +43% by 2050 — long-run rental-demand tailwind backs the buy-and-hold thesis.
Negotiation context
- It's been on market 40 days — a 3% lower offer ($194k) is reasonable based on typical stale-listing flexibility.
- 2 sale attempts since 3y ago with the ask held roughly flat each time — persistent listings suggest the price (not the market) is what's stuck; bring a comps-based counter.
Risks & watch-outs
- Watch-outs: HOA is 29% of rent.
- Climate carrying-cost: severe wind risk, 99% chance of damaging wind over 30y; extreme-heat days projected 7→28/yr by 2055 (HVAC capex compounding) — expect insurance premiums to compound above CPI over the hold.
Questions for the listing agent
- What do current leases actually rent for vs. the listed asking? Can we see a recent rent roll and the last 12 months of T-12 income?
- It's been on market 40 days. Have you received any prior offers? Is the seller open to a 3% concession, seller financing, or rate buy-down credit?
- What does the HOA fee cover, when was the last increase, and are there any pending special assessments or reserve-fund shortfalls?
- Any open or pending special assessments — roof, HVAC, plumbing, elevator, façade? What's the per-unit balance and payoff schedule, and is the seller paying it off at close or rolling it to the buyer?
- Is there a deadline driving the sale (1031 exchange, divorce, estate, relocation)? That informs how much negotiation room exists.
- Crime grade is D in this area — have there been break-ins, vandalism, or insurance claims at this property in the last 3 years? What carrier currently insures it and at what premium?
- The area grade is low — what's the realistic commute time and amenity access for the typical tenant pool here? Any planned neighborhood developments (good or bad) we should know about?
- What's the average days-on-market for RENTAL listings here right now (not sales)? A rising rental-DOM trend means longer vacancies and softer asking-rent achievability than the comps imply.
- What's the recent tenant-quality profile in this submarket — average credit score on applications, eviction rate, late-payment / NSF rate, and stable-employment percentage? A property-management company in the area should have these aggregated.
- How much new apartment / multifamily construction is in the pipeline within 1–3 miles? Heavy new supply (>2% of stock underway) typically softens rents 12–24 months out; light construction supports rent growth.
Investment metrics
- 1% rule
- 1.12% ✓
- Cap rate
- 4.69%
- Cash-on-cash
- -5.71%
- DSCR
- 0.75
- GRM
- 7.4
CMA / ARV
No comps found within radius.
Projected returns pro-forma
-3.0% appreciation · 0.0% rent growth · sell at horizon
- IRR
- -31.2%
- Equity multiple
- 0.01×
- Total profit
- $-55,386
- Equity at exit
- $29,746
- IRR
- -71.3%
- Equity multiple
- -0.68×
- Total profit
- $-93,633
- Equity at exit
- $17,249
Cash invested: $55,860 (down + closing). Projections, not guarantees.
Landlord ↔ Tenant lean methodology
- Overall (STATE)
- 87 Strongly Landlord-Friendly
- State Florida
- 87 Strongly Landlord-Friendly · R+3
- County
- — inherits STATE
- City
- — inherits STATE
ZIP-level market 34209
- Rents YoY
- -0.3%
- Active inventory
- 514
- Price-to-rent
- 7.4×
Monthly cashflow live
- Estimated rent
- $2,242 high interval (Pro) →
- Mortgage (P&I)
- −$1,046
- Tax est. 1.5%
- −$249 /mo · $2,992/yr
- Insurance
- −$83
- HOA est. from 5 same-building comps
- −$658
- Vacancy / Maint / Mgmt
- −$471
- Net cashflow
- $-266
Break-even live
Sensitivity live
| Price | -10% $-128 | -5% $-197 | +0% $-266 | +5% $-335 | +10% $-404 |
|---|---|---|---|---|---|
| Rent | -10% $-443 | -5% $-354 | +0% $-266 | +5% $-177 | +10% $-89 |
| Rate | -1.0pp $-165 | -0.5pp $-215 | base $-266 | +0.5pp $-317 | +1.0pp $-370 |
UW: 25.0% down · 7.5% · 30yr · 1.5% tax · 5.0% vac · 8.0% maint · 8.0% mgmt
Financing live
Cash to close
- Down payment
- $49,875
- Closing costs
- $5,985
- Reserves months
- —
- Total cash needed
- —
Loan-product check · same deal, 3 products live
Conventional
25% down · 7.5% · 30yr
- Down + closing
- —
- Monthly P&I
- —
- Monthly cashflow
- —
- DSCR
- —
- Eligible?
- —
Personal DTI + credit; lowest rate.
DSCR
20% down · 8.5% · 30yr
- Down + closing
- —
- Monthly P&I
- —
- Monthly cashflow
- —
- DSCR
- —
- Eligible?
- —
No personal income docs; deal must DSCR.
Hard money
10% down · 12.0% · 12mo
- Down + closing
- —
- Monthly P&I
- —
- Monthly cashflow
- —
- DSCR
- —
- Eligible?
- —
Short-term bridge; refi at stabilization.
Rent comps 40 comps
| Address | Beds | Baths | Sqft | Rent | $/sqft | DOM | Units | Dist |
|---|---|---|---|---|---|---|---|---|
| 4570 Pinebrook Cir #304 Bradenton, FL | 2.0 | 2.0 | 1256 | $3,100 | $2.47 | 25d | 1 | 0.01mi |
| 4460 Fairways Blvd #606 Bradenton, FL | 2.0 | 2.0 | 1256 | $2,000 | $1.59 | 17d | 1 | 0.14mi |
| 4220 Pinebrook Cir #14 Bradenton, FL | 2.0 | 2.0 | 1534 | $2,300 | $1.50 | 21d | 1 | 0.16mi |
| 4240 Ironwood Cir #404 Bradenton, FL | 2.0 | 2.0 | 1008 | $2,495 | $2.48 | 25d | 1 | 0.16mi |
| 4457 45th Ave W #211 Bradenton, FL | 2.0 | 2.0 | 912 | $1,950 | $2.14 | 17d | 1 | 0.27mi |
| 4107 41st St W Bradenton, FL | 3.0 | 2.0 | 1419 | $3,700 | $2.61 | 25d | 1 | 0.29mi |
| 4040 Ironwood Cir Unit 406F Bradenton, FL | 2.0 | 2.0 | 1008 | $1,675 | $1.66 | 17d | 1 | 0.29mi |
| 4040 Ironwood Cir Unit 404F Bradenton, FL | 2.0 | 2.0 | 1008 | $1,750 | $1.74 | 13d | 1 | 0.29mi |
| 4110 Ironwood Cir #104 Bradenton, FL | 2.0 | 2.0 | 1152 | $1,800 | $1.56 | 25d | 1 | 0.33mi |
| 4325 40th St W Bradenton, FL | 1.0–2.0 | 1.0–2.0 | 775 | $1,675 | $2.16 | 12d | 9 | 0.33mi |
| 4655 46th Street Ct W #103 Bradenton, FL | 2.0 | 2.0 | 1141 | $600 | $0.53 | 5d | 1 | 0.35mi |
| 4550 47th St W Bradenton, FL | 1.0–3.0 | 1.0–2.0 | 930 | $1,800 | $1.94 | 3d | 27 | 0.38mi |
| 108 Pinehurst Dr Bradenton, FL | 2.0 | 2.0 | 1408 | $2,500 | $1.78 | 25d | 1 | 0.47mi |
| 4801 47th Ave W Bradenton, FL | 1.0–3.0 | 1.0–2.0 | 1016 | $1,810 | $1.78 | 3d | 32 | 0.48mi |
| 4449 46th Ave W Unit 4449 Bradenton, FL | 2.0 | 1.0 | 1110 | $3,200 | $2.88 | 25d | 1 | 0.51mi |
| 283 Sherwood Dr Bradenton, FL | 2.0 | 2.0 | 1304 | $1,800 | $1.38 | 25d | 1 | 0.51mi |
| 3909 45th Ter W #106 Bradenton, FL | 2.0 | 2.5 | 1429 | $1,800 | $1.26 | 17d | 1 | 0.52mi |
| 303 Springdale Dr #303 Bradenton, FL | 2.0 | 2.0 | 1304 | $1,999 | $1.53 | 5d | 1 | 0.57mi |
| 3401 50th St W Bradenton, FL | 3.0 | 2.0 | 1418 | $2,699 | $1.90 | 25d | 1 | 0.57mi |
| 4112 Cape Vista Dr Bradenton, FL | 3.0 | 2.0 | 1450 | $3,495 | $2.41 | 25d | 1 | 0.57mi |
| 346 Springdale Dr Unit 346 Bradenton, FL | 2.0 | 2.0 | 1304 | $1,900 | $1.46 | 25d | 1 | 0.58mi |
| 3715 45th Ter W Bradenton, FL | 2.0 | 2.5 | 1429 | $1,695 | $1.19 | 25d | 1 | 0.63mi |
| 3825 45th Ter W #104 Bradenton, FL | 2.0 | 2.5 | 1429 | $1,550 | $1.08 | 25d | 1 | 0.63mi |
| 4802 51st St W Bradenton, FL | 1.0–2.0 | 1.0–2.0 | 1007 | $1,950 | $1.94 | 5d | 13 | 0.63mi |
| 4802 51st St W Bradenton, FL | 1.0–2.0 | 1.0–2.0 | 1007 | $1,950 | $1.94 | 17d | 15 | 0.63mi |
| 3603 45th Ter W #101 Bradenton, FL | 3.0 | 2.5 | 1200 | $1,800 | $1.50 | 5d | 1 | 0.68mi |
| 434 Palm Tree Dr #434 Bradenton, FL | 2.0 | 2.0 | 1728 | $1,900 | $1.10 | 25d | 1 | 0.72mi |
| 4850 51st St W Bradenton, FL | 1.0–2.0 | 1.0–2.0 | 800 | $1,750 | $2.19 | 5d | 2 | 0.74mi |
| 4850 51st St W Bradenton, FL | 1.0–2.0 | 1.0–2.0 | 800 | $1,750 | $2.19 | 16d | 3 | 0.74mi |
| 452 Palm Tree Dr Unit 452 Bradenton, FL | 2.0 | 2.0 | 1304 | $1,595 | $1.22 | 5d | 1 | 0.76mi |
| 655 Woodlawn Dr Unit 655 Bradenton, FL | 2.0 | 2.0 | 1148 | $1,600 | $1.39 | 25d | 1 | 0.83mi |
| 586 Lakeside Dr Unit 586 Bradenton, FL | 2.0 | 2.0 | 940 | $3,200 | $3.40 | 25d | 1 | 0.86mi |
| 577 Lakeside Dr Bradenton, FL | 2.0 | 2.0 | 1728 | $2,000 | $1.16 | 25d | 1 | 0.86mi |
| 3512 32nd St W Bradenton, FL | 2.0 | 1.0 | 1200 | $2,100 | $1.75 | 5d | 1 | 0.86mi |
| 4880 51st St W Bradenton, FL | 1.0–4.0 | 1.0–3.0 | 1019 | $1,527 | $1.50 | 5d | 11 | 0.88mi |
| 3806 Southern Pkwy W Bradenton, FL | 3.0 | 2.0 | 1296 | $2,176 | $1.68 | 13d | 1 | 0.89mi |
| 206 Lakewood Dr Unit 206 Bradenton, FL | 2.0 | 2.0 | 940 | $2,700 | $2.87 | 25d | 1 | 0.92mi |
| 5907 36th Ave Cir W #5907 Bradenton, FL | 2.0 | 2.0 | 937 | $2,800 | $2.99 | 25d | 1 | 0.93mi |
| 142 Pineneedle Dr Unit 142U Bradenton, FL | 2.0 | 2.0 | 1408 | $2,395 | $1.70 | 25d | 1 | 0.94mi |
| 183 Pineneedle Dr Bradenton, FL | 2.0 | 2.0 | 1304 | $1,800 | $1.38 | 25d | 1 | 0.94mi |
HOA detail condo
- Monthly dues
- $0 · $0/yr
- Likely covers
- watersewerinternetcablepool
- Assessments
- None detected in remarks — confirm with the listing agent.
Listing history 19 events
-
2026-06-22days on market $199,500 Active 40 DOM
-
2026-06-18days on market $199,500 Active 37 DOM
-
2026-06-17days on market $199,500 Active 36 DOM
-
2026-06-16days on market $199,500 Active 35 DOM
-
2026-06-15days on market $199,500 Active 34 DOM
-
2026-06-13days on market $199,500 Active 32 DOM
-
2026-06-13days on market $199,500 Active 31 DOM
-
2026-06-10days on market $199,500 Active 29 DOM
-
2026-06-09days on market $199,500 Active 28 DOM
-
2026-06-08days on market $199,500 Active 27 DOM
-
2026-06-08days on market $199,500 Active 26 DOM
-
2026-06-03days on market $199,500 Active 22 DOM
-
2026-06-02days on market $199,500 Active 21 DOM
-
2026-06-01days on market $199,500 Active 20 DOM
-
2026-05-31days on market $199,500 Active 19 DOM
-
2026-05-12$199,500 Active
-
2023-10-10historical $1,950
-
2023-09-30price $1,950
-
2023-09-09$2,200
ⓘ Source: listings_history table (triggers on properties + properties_extension) + one-shot
backfill from property_details.listing_events for pre-trigger history.
Climate risk First Street
- Flood 1/10 Low FEMA zone X (unshaded) · 0% chance over 30 yrs
- Wildfire 1/10 Low
- Heat 10/10 Extreme 7 d/yr ≥106°F today · 28 d/yr by 30 yrs out
- Wind 10/10 Extreme 99% chance of damaging wind over 30 yrs
- Air quality 3/10 Moderate 2 unhealthy d/yr today · 2 by 30 yrs out
Nearby sold comps map
Loading sold comps map…
Walkable amenities ~0.75 mi
Loading nearby amenities…
Taxation est. · year 1
- Rental income
- $26,900
- − Mortgage interest
- −$11,175
- − Property taxes
- −$2,992
- − Insurance
- −$998
- − Repairs & maintenance
- −$2,152
- − Management
- −$2,152
- − HOA
- −$7,896
- − Depreciation
- −$5,804
- Taxable loss
- −$6,269
- Est. tax savings @ 24.0%
- +$1,504
- After-tax cash flow
- $-1,685/yr
For passive investors: Depreciation is non-cash, so a rental often shows a tax loss while cash-flowing — sheltering income. Rental losses are passive: they offset passive income freely, and up to $25,000/yr can offset ordinary (W-2) income if you actively participate and your MAGI is under $100k (phasing out to $0 by $150k); unused losses carry forward. On sale, claimed depreciation is recaptured at up to 25%, and gains may owe capital-gains tax (a 1031 exchange can defer both). Figures are a year-1 estimate at your 24.0% rate — not tax advice; consult a CPA.
Condition & rehab AI · 1 photo
This 55+ community condo is in good condition with no major repairs needed. It offers a good ROI with updates that can enhance its curb appeal and interior aesthetics.
Value-add opportunities
- Both Painting — Fresh paint can enhance curb appeal and interior aesthetics
- Both Lighting — Upgrading lighting fixtures can improve ambiance and safety
- Both Curtains — New curtains can add a fresh look and improve privacy
- Both Flooring — If flooring is old or damaged, replacing it can significantly boost value
- Both Appliances — Upgrading appliances can make the home more appealing to buyers/renters
Renovation cost estimate screening
Value-add ROI direction
- Both Painting — Fresh paint can enhance curb appeal and interior aesthetics ↑
- Both Lighting — Upgrading lighting fixtures can improve ambiance and safety ↑
- Both Curtains — New curtains can add a fresh look and improve privacy ↑
- Both Flooring — If flooring is old or damaged, replacing it can significantly boost value ↑
- Both Appliances — Upgrading appliances can make the home more appealing to buyers/renters ↑
ⓘ Cost ranges are severity-bucket heuristics (US national rule-of-thumb). Get contractor quotes + a written scope before underwriting a rehab budget.
Schools (NCES district)
- District
- Manatee
- NCES district ID
- 1201230
- Math proficiency
- 54% ▼ -6.00%
- Reading proficiency
- 50% ▼ -2.00%
- Median HH income
- $49,607
- Composite
- 44.43/100
- National rank
- #2806
- State rank
- #26 of 73 in FL
Livability — Bradenton
- Score
- 81/100
- State rank
- #101
- US rank
- #1528
Category grades
Schools grade is shown separately in the Schools card above.
Census & demographics
- Census place
- Bradenton, FL
- County
- Manatee County · 416,364 people
- City population
- 227,091
- Metro
- North Port-Sarasota-Bradenton, FL
- Population (ZIP)
- 33,224
- Household income
- $81,728
- Rent vs Own
- Severe rent burden
- 1126.0
Population outlook (Manatee County) Hauer SSP2
- Today (2025)
- 447,342 people
- By 2030
- 488,911 · +9.3%
- By 2040
- 567,934 · +27.0%
- By 2050
- 637,995 · +42.6%
- By 2075
- 781,970 · +74.8%
- By 2100
- 848,272 · +89.6%
Race, ethnicity, and origin ACS 2023
- Neighborhood character
- Predominantly White (84%)
- Race & ethnicity
- White 84% Hispanic / Latino 11% Two or more races 6% Black 2% Asian 1%
- Hispanic origin (detail)
- Puerto Rican 4% Cuban 3%
- Common ancestry
- Romanian 3% Slovak 3% Lithuanian 3%
- Foreign-born
- 9% · Canada, Jamaica, China
- Languages at home
- 90% English-only · Spanish 6% Russian/Polish/Slavic 1% Other Indo-European 1%
Political lean MEDSL · Manatee
- 2024 margin
- Strong R (+23.5) · D 37.9% · R 61.4%
- 2008→2024 swing
- -16.5pp toward R · 2008: -7.0pp · 2024: -23.5pp
- All cycles
- 2024: R+23.5 2020: R+16.1 2016: R+17.1 2012: R+12.5 2008: R+7.0
Not yet ingested
- Civics
- —
Market trends
- HPI YoY
- ▼ -360.34%
- Current HPI
- 320.0061
- Rent YoY
- ▼ -0.30%
- Metro
- North Port-Sarasota-Bradenton, FL
- State GDP YoY
- ▲ 3.28%
- F500 in state
- 36
Industry mix (Fortune 500 HQ in FL)
| Industry | F500 HQs | Revenue |
|---|---|---|
| Industrial Technology | 2 | $29B |
|
||
| Insurance | 2 | $17B |
|
||
| Retail | 1 | $60B |
|
||
| Technology Distribution | 1 | $58B |
|
||
| Homebuilding | 1 | $35B |
|
||
| Technology Manufacturing | 1 | $35B |
|
||
Price history
+8968.2% since first listed4 events — show timeline
- 2026-05-12 Listed $199,500 FSBO.com
- 2023-10-10 Rental Removed $1,950 RENT.
- 2023-09-30 Price Changed $1,950 RENT.
- 2023-09-09 Listed for Rent $2,200 RENT.
Cash-flow waterfall
monthlySold comps — $/sqft
last 12 mo · ≤1 miLoading sold comps…