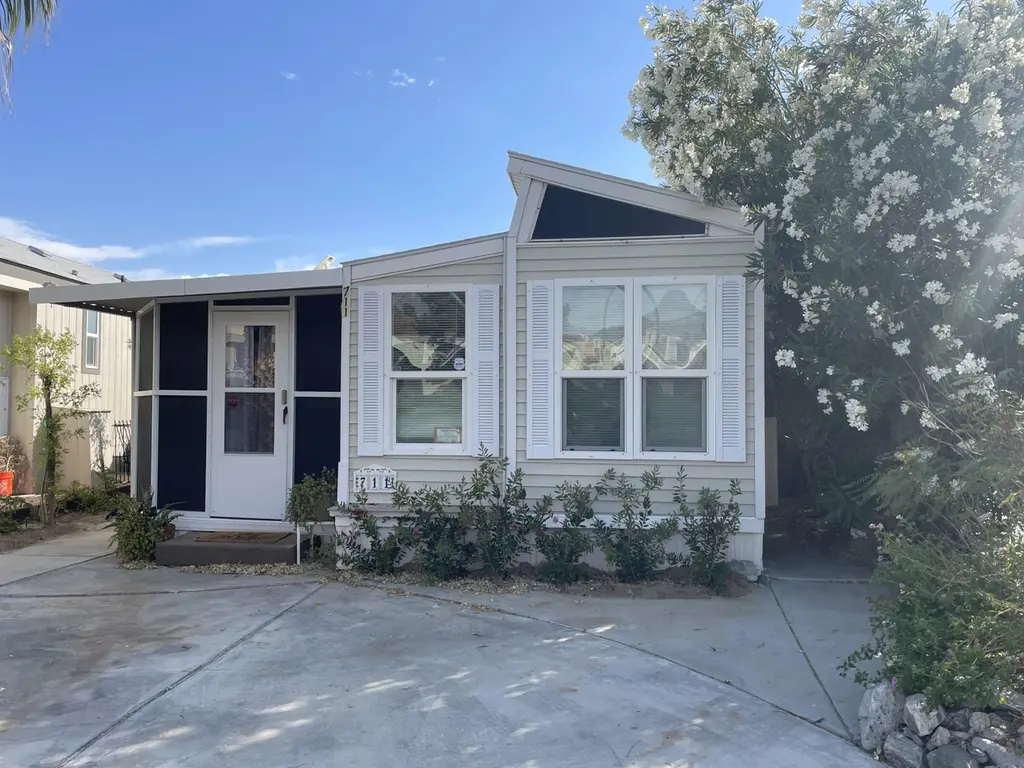
74711 Dillon Rd #711 · Sky Valley, CA
Flood risk 1/10 · Minimal
- FEMA flood zone
- D
- Chance of flooding over 30 yrs
- 0.0%
- Est. flood insurance / yr
- $544 – $1,084
Fire risk 3/10 · Minor
- Est. fire insurance / yr
- $659 – $1,223
Heat risk 8/10 · Major
- Hot days now (above 111°F)
- 7 days/yr
- Hot days in 30 yrs
- 20 days/yr
Wind risk 1/10 · Minimal
- Chance of severe wind over 30 yrs
- —
Air-quality risk 5/10 · Moderate
- Unhealthy air days now
- 6 days/yr
- Unhealthy air days in 30 yrs
- 8 days/yr
Risk factors via First Street. Map © Google.
Why this score? — see what drove the C+ grade
The composite is a weighted blend of 9 inputs, each scored 0–100. Each bar is that input's sub-score; the figure is the points it added to the 100-point composite (weight × sub-score).
- Cash flow +30.0/30.0
- 1% rule +10.0/10.0
- DSCR +10.0/10.0
- Condition / age +4.0/5.0
- Schools +2.7/10.0
- Livability +2.6/5.0
- Rent growth +2.5/5.0
- ARV discount +1.8/15.0
- Appreciation +0.0/10.0
$50,000
🖨 Deal sheet (PDF) 📄 Offer letter ✓ Due diligence
Listing remarks
Centrally located between Joshua Tree National Park and the San Jacinto Mountain Range, Sky Valley Resort is a Friendly, All Ages Park. This Adorable Park Model is being sold Furnished and has 2 Bedrooms, and 1 Bathroom. Cute Kitchen with Breakfast Bar, and Lots of Natural Sunlight from the Skylights. Take in the Warm Desert Evenings on your Screened in Patio. Large Shed for Extra Storage. The roof was just sealed and HVAC system was fully serviced. Situated on a Corner Lot and just Steps away from the many Pools & Spas. Sky Valley Resort offers many Great amenities including 13 Hot Mineral Pools & Spa's, Fitness Center, Sauna, Tennis Courts, Pickle Ball Courts, Cafe, Chapel,
Key facts
- Fitness center
- Centrally located
- Hot mineral pools
Tags
Property features AI
Finance
- Other: Located in a family park (Sky Valley Resort); mobile home to remain; manager approval required
- Financial info: Short-term rentals allowed; Sale includes furnishings and refrigerator; Listing terms: cash or cash to new loan
- HOA & community: No monthly association fee; Gated community; Community amenities (pool, spa, clubhouse, dog park, pickleball)
Exterior
- Parking: Driveway parking; 2 total parking spaces
- Security: Gated community; Community security features
- Utilities: Septic tank
- Home design: One-level home; Park model / manufactured home; Entry on a single story
- Construction: Pier jacks foundation; Manufactured home (Park Model) manufactured in 01/1986
- Exterior features: Located close to the clubhouse; Corner lot; Street lights nearby; Community pool and in-ground spa; Community amenities include dog park and pickleball courts; Has views of desert, park/green belt and mountains; Detached property
Interior
- Kitchen: Laminate countertops; Propane cooktop; Microwave; Refrigerator; Breakfast counter/bar; Open living/dining combo
- Flooring: Laminate flooring
- Bathrooms: 1 full bathroom
- Heating & cooling: Forced air heating; Air conditioning
- Interior features: Vaulted ceilings; Sliding door(s); Blinds and drapes; Turnkey furnished
- Laundry & utility: No in-unit laundry
Neighborhood map
What this means for you Summary
Snapshot
- This is a 2-bed/1.0-bath manufactured listed at $50k. Condition is rated good.
Deal economics
- At list price, monthly cash flow is $852 ($10k/yr) — positive.
- The deal already cash-flows at list — no discount required.
- Meets the 1% rule at list price ($2k rent vs $50k).
- Cap rate 26.7% vs local median 9.6% in Sky Valley — top-decile yield for the area; either an underpriced asset or a hidden risk that comps aren't pricing in. Stress-test before assuming the spread holds.
Location & tenants
- Location reads 52/100 on livability (#1,041 in CA) — a working-class tenant base; expect higher turnover. Strengths: housing A; Watch: schools F, amenities F, commute F.
- Palm Springs Unified (suburban): math 21% / reading 42% proficiency, ranked #328 of 517 in CA (top 63%) — families likely to look elsewhere, expect single-tenant / working-renter base with shorter leases; 73% free/reduced lunch — lower-income household profile, screen leases tightly.
- Market conditions: 216 active listings in the ZIP; 9,195 units permitted in Riverside County in 2024 (1,512 in 5+ unit buildings).
Forward outlook
- Local home prices are declining (-3.0%/yr); year-one equity from $346 of loan paydown is wiped out by about $2k of value loss. Plan a longer hold.
- Riverside County population projected at +22% by 2050 — long-run rental-demand tailwind backs the buy-and-hold thesis.
- At projected returns (-3.0% appreciation + 3.0% rent growth), your $14k cash investment doubles in ~2 years — after that, you're playing with house money.
Negotiation context
- Only 14 days on market — expect competitive offers; lowballing is unlikely to land.
- 8 sale attempts since 3y ago; this cycle's ask has dropped $9k (15%) from the opening price — seller is motivated, your offer sets the floor, not the list.
Risks & watch-outs
- Climate carrying-cost: extreme-heat days projected 7→20/yr by 2055 (HVAC capex compounding) — expect insurance premiums to compound above CPI over the hold.
Questions for the listing agent
- Is there a deadline driving the sale (1031 exchange, divorce, estate, relocation)? That informs how much negotiation room exists.
- Schools are F-rated, which usually means shorter tenancies and higher turnover. Who's the typical renter profile here, and what's been the actual vacancy rate?
- What's the average days-on-market for RENTAL listings here right now (not sales)? A rising rental-DOM trend means longer vacancies and softer asking-rent achievability than the comps imply.
- What's the recent tenant-quality profile in this submarket — average credit score on applications, eviction rate, late-payment / NSF rate, and stable-employment percentage? A property-management company in the area should have these aggregated.
- How much new for-sale + rental construction is in the pipeline within 1–3 miles? Heavy new supply typically softens prices + rents 12–24 months out; constrained supply supports both.
Investment metrics
- 1% rule
- 3.03% ✓
- Cap rate
- 26.74%
- Cash-on-cash
- 73.03%
- DSCR
- 4.25
- GRM
- 2.7
CMA / ARV
- ARV (median comp)
- $44,400
- List price
- $50,000
- Delta
- 12.61%
- Verdict
- OVERPRICED
- Comps
- 5 within 1.0 mi
Show comp detail 11 sales within ~0.75 mi
| Address | Dist | Beds/Ba | Sqft | Sold | Price | $/sf | Match |
|---|---|---|---|---|---|---|---|
| 74711 Dillon Rd Spc 881 | 0.00mi | 1/1.0 (-1) | 600 (0%) | 4mo | $63,000 | $105 | 92 |
| 74711 Dillon Rd #800 | 0.00mi | 2/1.0 | 600 (0%) | 11mo | $31,000 | $52 | 91 |
| 74711 Dillon Rd #736 | 0.00mi | 1/1.5 (-1) | 600 (0%) | 12mo | $80,000 | $133 | 83 |
| 74711 Dillon Rd Spc 218 | 0.00mi | 1/1.0 (-1) | 600 (0%) | 16mo | $40,000 | $67 | 82 |
| 74711 Dillon Rd #100 | 0.00mi | 2/1.0 | 600 (0%) | 22mo | $44,000 | $73 | 81 |
| 74711 Dillon Rd #842 | 0.00mi | 2/1.0 | 610 (+2%) | 19mo | $92,000 | $151 | 81 |
| 74711 Dillon Rd #960 | 0.00mi | 2/1.0 | 650 (+8%) | 12mo | $74,000 | $114 | 76 |
| 74711 Dillon Rd #111 | 0.00mi | 1/1.0 (-1) | 580 (-3%) | 22mo | $72,500 | $125 | 71 |
| 74711 Dillon Rd #716 | 0.17mi | 1/1.0 (-1) | 550 (-8%) | 5mo | $44,400 | $81 | 69 |
| 74711 Dillon Rd #974 | 0.00mi | 2/1.0 | 683 (+14%) | 14mo | $85,000 | $124 | 65 |
| 74711 Dillon Rd Spc 89 | 0.16mi | 1/1.0 (-1) | 650 (+8%) | 17mo | $88,000 | $135 | 60 |
Match score weights: distance 35% · size 25% · config 20% · recency 20%. Top-matched comps best support the ARV.
Projected returns pro-forma
-3.0% appreciation · 3.0% rent growth · sell at horizon
- IRR
- 72.8%
- Equity multiple
- 4.30×
- Total profit
- $46,189
- Equity at exit
- $7,455
- IRR
- 76.6%
- Equity multiple
- 8.87×
- Total profit
- $110,194
- Equity at exit
- $4,323
Cash invested: $14,000 (down + closing). Projections, not guarantees.
Landlord ↔ Tenant lean methodology
- Overall (STATE)
- 18 Strongly Tenant-Friendly
- State California
- 18 Strongly Tenant-Friendly · D+13
- County
- — inherits STATE
- City
- — inherits STATE
ZIP-level market 92241
- Home prices YoY
- -22.8%
- Active inventory
- 216
- Price-to-rent
- 2.7×
Monthly cashflow live
- Estimated rent
- $1,516 medium interval (Pro) →
- Mortgage (P&I)
- −$262
- Tax est. 1.5%
- −$62 /mo · $750/yr
- Insurance
- −$21
- HOA
- −$0
- Vacancy / Maint / Mgmt
- −$318
- Net cashflow
- $852
Break-even live
Sensitivity live
| Price | -10% $887 | -5% $869 | +0% $852 | +5% $835 | +10% $818 |
|---|---|---|---|---|---|
| Rent | -10% $732 | -5% $792 | +0% $852 | +5% $912 | +10% $972 |
| Rate | -1.0pp $877 | -0.5pp $865 | base $852 | +0.5pp $839 | +1.0pp $826 |
UW: 25.0% down · 7.5% · 30yr · 1.5% tax · 5.0% vac · 8.0% maint · 8.0% mgmt
Financing live
Cash to close
- Down payment
- $12,500
- Closing costs
- $1,500
- Reserves months
- —
- Total cash needed
- —
Loan-product check · same deal, 3 products live
Conventional
25% down · 7.5% · 30yr
- Down + closing
- —
- Monthly P&I
- —
- Monthly cashflow
- —
- DSCR
- —
- Eligible?
- —
Personal DTI + credit; lowest rate.
DSCR
20% down · 8.5% · 30yr
- Down + closing
- —
- Monthly P&I
- —
- Monthly cashflow
- —
- DSCR
- —
- Eligible?
- —
No personal income docs; deal must DSCR.
Hard money
10% down · 12.0% · 12mo
- Down + closing
- —
- Monthly P&I
- —
- Monthly cashflow
- —
- DSCR
- —
- Eligible?
- —
Short-term bridge; refi at stabilization.
Listing history 23 events
-
2026-05-15status Pending 1226-char remark
-
2026-05-01historical
-
2026-04-02price $50,000
-
2025-11-03$59,000 Active
-
2025-11-01historical
-
2025-06-01historical
-
2025-05-01$50,000 Active 1226-char remark
-
2025-02-27price $63,000
-
2025-01-01historical
-
2024-08-22status Active
-
2024-07-31status Pending
-
2024-07-10price $69,900
-
2024-06-06$63,000 Active
-
2024-06-06$69,900 Active
-
2024-06-06$74,900 Active
-
2024-06-01historical
-
2024-05-01historical
-
2024-05-01$79,900 Active
-
2024-03-10price $79,900
-
2024-02-18price $89,900
-
2023-12-21price $95,000
-
2023-12-13price $109,900
-
2023-10-31$114,900 Active
ⓘ Source: listings_history table (triggers on properties + properties_extension) + one-shot
backfill from property_details.listing_events for pre-trigger history.
Climate risk First Street
- Flood 1/10 Low FEMA zone D · 0% chance over 30 yrs
- Wildfire 3/10 Moderate
- Heat 8/10 Severe 7 d/yr ≥111°F today · 20 d/yr by 30 yrs out
- Wind 1/10 Low
- Air quality 5/10 Major 6 unhealthy d/yr today · 8 by 30 yrs out
Nearby sold comps map
Loading sold comps map…
Walkable amenities ~0.75 mi
Loading nearby amenities…
Taxation est. · year 1
- Rental income
- $18,192
- − Mortgage interest
- −$2,801
- − Property taxes
- −$750
- − Insurance
- −$250
- − Repairs & maintenance
- −$1,455
- − Management
- −$1,455
- − Depreciation
- −$1,455
- Taxable income
- $10,026
- Est. tax owed @ 24.0%
- −$2,406
- After-tax cash flow
- $7,819/yr
For passive investors: Depreciation is non-cash, so a rental often shows a tax loss while cash-flowing — sheltering income. Rental losses are passive: they offset passive income freely, and up to $25,000/yr can offset ordinary (W-2) income if you actively participate and your MAGI is under $100k (phasing out to $0 by $150k); unused losses carry forward. On sale, claimed depreciation is recaptured at up to 25%, and gains may owe capital-gains tax (a 1031 exchange can defer both). Figures are a year-1 estimate at your 24.0% rate — not tax advice; consult a CPA.
Condition & rehab AI · 6 photos
This manufactured home is in good condition with recent updates and a good curb appeal. Minor cosmetic improvements can further enhance its value for both resale and rental.
Value-add opportunities
- Both Paint the exterior siding and trim for a refreshed look. — A fresh coat of paint can enhance curb appeal and property value.
- Resale Replace the kitchen countertops with quartz or granite for a more modern and durable surface. — Quartz or granite countertops are durable and can add value to the home.
- Rental Install a smart thermostat to improve energy efficiency and comfort. — Smart thermostats can reduce energy costs and attract tech-savvy renters.
Renovation cost estimate screening
Value-add ROI direction
- Both Paint the exterior siding and trim for a refreshed look. — A fresh coat of paint can enhance curb appeal and property value. ↑
- Resale Replace the kitchen countertops with quartz or granite for a more modern and durable surface. — Quartz or granite countertops are durable and can add value to the home. ↑
- Rental Install a smart thermostat to improve energy efficiency and comfort. — Smart thermostats can reduce energy costs and attract tech-savvy renters. ↑
ⓘ Cost ranges are severity-bucket heuristics (US national rule-of-thumb). Get contractor quotes + a written scope before underwriting a rehab budget.
Schools (NCES district)
- District
- Palm Springs Unified
- NCES district ID
- 0629550
- Math proficiency
- 21% ▼ -7.00%
- Reading proficiency
- 42% ▬ 0.00%
- Median HH income
- $43,638
- Composite
- 26.76/100
- National rank
- #7131
- State rank
- #328 of 517 in CA
Livability — Sky Valley
- Score
- 52/100
- State rank
- #1041
- US rank
- #25108
Category grades
Schools grade is shown separately in the Schools card above.
Census & demographics
- Census place
- Sky Valley, CA
- Population (ZIP)
- 8,624
Population outlook (Riverside County) Hauer SSP2
- Today (2025)
- 2,664,475 people
- By 2030
- 2,802,692 · +5.2%
- By 2040
- 3,050,904 · +14.5%
- By 2050
- 3,256,783 · +22.2%
- By 2075
- 3,655,058 · +37.2%
- By 2100
- 3,766,594 · +41.4%
Race, ethnicity, and origin ACS 2023
- Race & ethnicity
- White 50% Hispanic / Latino 46% Two or more races 16% Asian 2% Native American 1%
- Hispanic origin (detail)
- Mexican 36%
- Common ancestry
- Lithuanian 3% Slovak 2% Portuguese 2%
- Foreign-born
- 28% · Canada, South Korea
- Languages at home
- 57% English-only · Spanish 38% Chinese 1% Russian/Polish/Slavic 1%
Political lean MEDSL · Riverside
- 2024 margin
- Toss-up / Even · D 48.0% · R 49.3% · Other 2.6%
- 2008→2024 swing
- -3.6pp toward R · 2008: 2.3pp · 2024: -1.3pp
- All cycles
- 2024: R+1.3 2020: D+8.0 2016: D+4.3 2012: R+0.4 2008: D+2.3
Not yet ingested
- Civics
- —
Market trends
- HPI YoY
- ▼ -118.23%
- Current HPI
- 400.5663
- Rent YoY
- —
- Metro
- —
- State GDP YoY
- ▲ 3.21%
- F500 in state
- 116
Industry mix (Fortune 500 HQ in CA)
| Industry | F500 HQs | Revenue |
|---|---|---|
| Technology | 27 | $1,492B |
|
||
| Financial Services | 3 | $174B |
|
||
| Retail | 3 | $44B |
|
||
| Insurance | 3 | $26B |
|
||
| Media / Entertainment | 2 | $115B |
|
||
| Pharmaceuticals / Biotech | 2 | $62B |
|
||
Price history
-56.5% since first listed23 events — show timeline
- 2026-05-15 Pending — GPSMLS
- 2026-05-01 Listing Removed — GPSMLS
- 2026-04-02 Price Changed $50,000 GPSMLS
- 2025-11-03 Listed $59,000 GPSMLS
- 2025-11-01 Listing Removed — GPSMLS
- 2025-06-01 Listing Removed — GPSMLS
- 2025-05-01 Listed $50,000 GPSMLS
- 2025-02-27 Price Changed $63,000 GPSMLS
- 2025-01-01 Listing Removed — GPSMLS
- 2024-08-22 Relisted — GPSMLS
- 2024-07-31 Pending — GPSMLS
- 2024-07-10 Price Changed $69,900 GPSMLS
- 2024-06-06 Listed $74,900 GPSMLS
- 2024-06-06 Listed $69,900 GPSMLS
- 2024-06-06 Listed $63,000 GPSMLS
- 2024-06-01 Listing Removed — GPSMLS
- 2024-05-01 Listing Removed — GPSMLS
- 2024-05-01 Listed $79,900 GPSMLS
- 2024-03-10 Price Changed $79,900 GPSMLS
- 2024-02-18 Price Changed $89,900 GPSMLS
- 2023-12-21 Price Changed $95,000 GPSMLS
- 2023-12-13 Price Changed $109,900 GPSMLS
- 2023-10-31 Listed $114,900 GPSMLS
Cash-flow waterfall
monthlySold comps — $/sqft
last 12 mo · ≤1 miLoading sold comps…