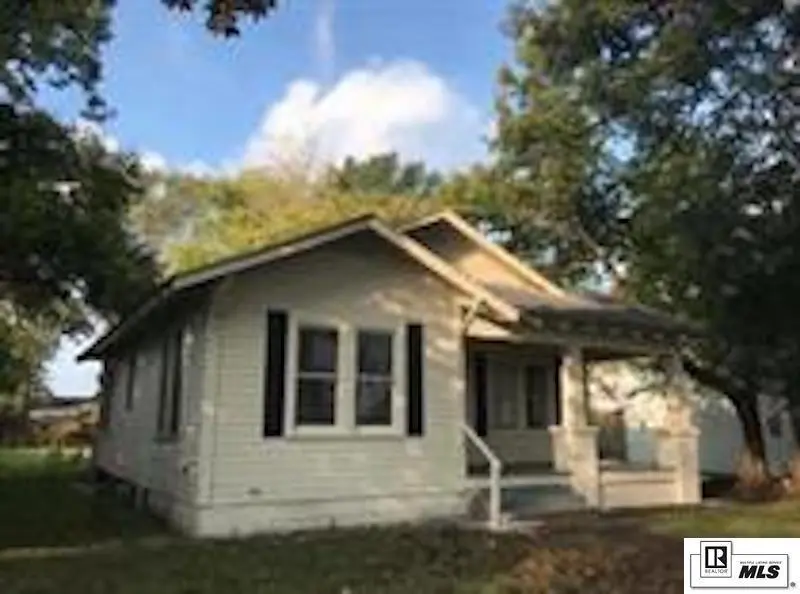
1505 Trenton St · West Monroe, LA
Flood risk 1/10 · Minimal
- FEMA flood zone
- X
- Chance of flooding over 30 yrs
- 0.0%
- Est. flood insurance / yr
- $507 – $1,088
Fire risk 1/10 · Minimal
- Est. fire insurance / yr
- $1,269 – $2,357
Heat risk 7/10 · Major
- Hot days now (above 112°F)
- 7 days/yr
- Hot days in 30 yrs
- 20 days/yr
Wind risk 7/10 · Major
- Chance of severe wind over 30 yrs
- 78.0%
Air-quality risk 1/10 · Minimal
- Unhealthy air days now
- 0 days/yr
- Unhealthy air days in 30 yrs
- 0 days/yr
Risk factors via First Street. Map © Google.
Why this score? — see what drove the B grade
The composite is a weighted blend of 9 inputs, each scored 0–100. Each bar is that input's sub-score; the figure is the points it added to the 100-point composite (weight × sub-score).
- Cash flow +30.0/30.0
- 1% rule +10.0/10.0
- DSCR +10.0/10.0
- ARV discount +6.8/15.0
- Rent growth +4.7/5.0
- Livability +3.5/5.0
- Schools +3.2/10.0
- Condition / age +2.5/5.0
- Appreciation +0.0/10.0
$95,000
🖨 Deal sheet (PDF) 📄 Offer letter ✓ Due diligence
Listing remarks MLS
Check out this Bungalow style home located in the heart of West Monroe with convenient access to all West Monroe has to offer including easy downtown access, grocery stores, shopping, and lots of dining options too!! Features hardwood floors, separate dining room and large fenced backyard. Great investment property. .
Key facts
- Separate dining room
- Convenient access
- Bungalow style home
Tags
Neighborhood map
What this means for you Summary
Snapshot
- This is a 2-bed/1.0-bath single-family listed at $95k.
Deal economics
- At list price, monthly cash flow is $557 ($7k/yr) — positive.
- The deal already cash-flows at list — no discount required.
- Meets the 1% rule at list price ($1k rent vs $95k).
- Recommended offer: $84k (12.0% below list) — sets the bar for market timing.
- Cap rate 13.3% vs local median 5.5% in West Monroe — top-decile yield for the area; either an underpriced asset or a hidden risk that comps aren't pricing in. Stress-test before assuming the spread holds.
Location & tenants
- Location reads 70/100 on livability (#53 in LA) — a middle-class / working-renter tenant base. Strengths: cost of living A+, health & safety A+, housing A; Watch: crime F, commute F, employment F.
- Ouachita Parish (suburban): math 31% / reading 45% proficiency, ranked #26 of 98 in LA (top 26%) — families likely to look elsewhere, expect single-tenant / working-renter base with shorter leases.
- Market conditions: Rents rising fast (+8.9%/yr); 199 active listings in the ZIP; 5 comparable units currently listed for rent nearby; rentals at typical pace (median 22d on market — plan ~3-4 weeks tenant-placement turnaround); 40% of comp listings sitting > 30 days — soft ceiling on asking rent; 345 units permitted in Ouachita Parish in 2024 (0 in 5+ unit buildings).
Forward outlook
- Local home prices are declining (-3.0%/yr); year-one equity from $657 of loan paydown is wiped out by about $3k of value loss. Plan a longer hold.
- At projected returns (-3.0% appreciation + 8.0% rent growth), your $27k cash investment doubles in ~5 years — after that, you're playing with house money.
Negotiation context
- It's been on market 494 days — a 12% lower offer ($84k) is reasonable based on typical stale-listing flexibility.
- 4 sale attempts since 3y ago; this cycle's ask is 11076% above the opening price — seller raised mid-cycle; expect resistance to lowballs.
Risks & watch-outs
- Watch-outs: built in 1935 — expect roof / HVAC / electrical / plumbing capex.
- Climate carrying-cost: major wind risk, 78% chance of damaging wind over 30y; extreme-heat days projected 7→20/yr by 2055 (HVAC capex compounding) — expect insurance premiums to compound above CPI over the hold.
Questions for the listing agent
- It's been on market 494 days. Have you received any prior offers? Is the seller open to a 12% concession, seller financing, or rate buy-down credit?
- Built in 1935 — when were the roof, HVAC, electrical panel, plumbing, and water heater last replaced?
- Why hasn't it sold? Are there any deal-killer items the seller is aware of (foundation, flood, title, zoning, code violations)?
- Is there a deadline driving the sale (1031 exchange, divorce, estate, relocation)? That informs how much negotiation room exists.
- Schools are B-rated — typically a magnet for longer-tenancy family renters. What's the average tenant stay here, and is there a school-zone premium baked into asking?
- Crime grade is F in this area — have there been break-ins, vandalism, or insurance claims at this property in the last 3 years? What carrier currently insures it and at what premium?
- What's the average days-on-market for RENTAL listings here right now (not sales)? A rising rental-DOM trend means longer vacancies and softer asking-rent achievability than the comps imply.
- What's the recent tenant-quality profile in this submarket — average credit score on applications, eviction rate, late-payment / NSF rate, and stable-employment percentage? A property-management company in the area should have these aggregated.
- How much new for-sale + rental construction is in the pipeline within 1–3 miles? Heavy new supply typically softens prices + rents 12–24 months out; constrained supply supports both.
Investment metrics
- 1% rule
- 1.52% ✓
- Cap rate
- 13.33%
- Cash-on-cash
- 25.12%
- DSCR
- 2.12
- GRM
- 5.5
CMA / ARV
- ARV (median comp)
- $93,586
- List price
- $95,000
- Delta
- 1.51%
- Verdict
- FAIR
- Comps
- 20 within 1.0 mi
Show comp detail 3 sales within ~0.75 mi
| Address | Dist | Beds/Ba | Sqft | Sold | Price | $/sf | Match |
|---|---|---|---|---|---|---|---|
| 400 Conella St | 0.60mi | 3/1.0 (+1) | 1,030 (+4%) | 13mo | $149,900 | $146 | 50 |
| 212 Moreland St | 0.74mi | 2/1.0 | 862 (-13%) | 2mo | $72,000 | $84 | 42 |
| 309 Pelican Dr | 0.66mi | 2/1.0 | 912 (-8%) | 20mo | $84,500 | $93 | 39 |
Match score weights: distance 35% · size 25% · config 20% · recency 20%. Top-matched comps best support the ARV.
Projected returns pro-forma
-3.0% appreciation · 8.0% rent growth · sell at horizon
- IRR
- 23.8%
- Equity multiple
- 2.04×
- Total profit
- $27,677
- Equity at exit
- $14,165
- IRR
- 34.6%
- Equity multiple
- 4.92×
- Total profit
- $104,374
- Equity at exit
- $8,214
Cash invested: $26,600 (down + closing). Projections, not guarantees.
Landlord ↔ Tenant lean methodology
- Overall (STATE)
- 90 Strongly Landlord-Friendly
- State Louisiana
- 90 Strongly Landlord-Friendly · R+12
- County
- — inherits STATE
- City
- — inherits STATE
ZIP-level market 71291
- Home prices YoY
- -30.2%
- Rents YoY
- 8.9%
- Active inventory
- 199
- Price-to-rent
- 5.5×
Monthly cashflow live
- Estimated rent
- $1,442 high interval (Pro) →
- Mortgage (P&I)
- −$498
- Tax from tax record
- −$45 /mo · $538/yr
- Insurance
- −$40
- HOA
- −$0
- Vacancy / Maint / Mgmt
- −$303
- Net cashflow
- $557
Break-even live
Sensitivity live
| Price | -10% $611 | -5% $584 | +0% $557 | +5% $530 | +10% $503 |
|---|---|---|---|---|---|
| Rent | -10% $443 | -5% $500 | +0% $557 | +5% $614 | +10% $671 |
| Rate | -1.0pp $605 | -0.5pp $581 | base $557 | +0.5pp $532 | +1.0pp $507 |
UW: 25.0% down · 7.5% · 30yr · 1.5% tax · 5.0% vac · 8.0% maint · 8.0% mgmt
Financing live
Cash to close
- Down payment
- $23,750
- Closing costs
- $2,850
- Reserves months
- —
- Total cash needed
- —
Loan-product check · same deal, 3 products live
Conventional
25% down · 7.5% · 30yr
- Down + closing
- —
- Monthly P&I
- —
- Monthly cashflow
- —
- DSCR
- —
- Eligible?
- —
Personal DTI + credit; lowest rate.
DSCR
20% down · 8.5% · 30yr
- Down + closing
- —
- Monthly P&I
- —
- Monthly cashflow
- —
- DSCR
- —
- Eligible?
- —
No personal income docs; deal must DSCR.
Hard money
10% down · 12.0% · 12mo
- Down + closing
- —
- Monthly P&I
- —
- Monthly cashflow
- —
- DSCR
- —
- Eligible?
- —
Short-term bridge; refi at stabilization.
Rent comps 5 comps
| Address | Beds | Baths | Sqft | Rent | $/sqft | DOM | Units | Dist |
|---|---|---|---|---|---|---|---|---|
| 220 Drew Ave West Monroe, LA | 3.0 | 1.0 | 900 | $1,525 | $1.69 | 22d | 1 | 0.39mi |
| 1107 N 2nd St Unit B Monroe, LA | 1.0 | 1.0 | 847 | $850 | $1.00 | 22d | 1 | 0.57mi |
| 110 Pine St Unit 12 West Monroe, LA | 2.0 | 2.0 | 1000 | $2,400 | $2.40 | 45d | 1 | 0.87mi |
| 2417 N 9th St West Monroe, LA | 2.0 | 1.0 | 900 | $2,000 | $2.22 | 45d | 1 | 1.18mi |
| 411 Filhiol Ave West Monroe, LA | 2.0 | 1.0 | 782 | $875 | $1.12 | 22d | 1 | 1.45mi |
Listing history 22 events
-
2026-06-19days on market $95,000 Active 494 DOM
-
2026-06-18days on market $95,000 Active 493 DOM
-
2026-06-17days on market $95,000 Active 492 DOM
-
2026-06-16days on market $95,000 Active 491 DOM
-
2026-06-15days on market $95,000 Active 490 DOM
-
2026-06-14days on market $95,000 Active 488 DOM
-
2026-06-13days on market $95,000 Active 487 DOM
-
2026-06-10days on market $95,000 Active 485 DOM
-
2026-06-09days on market $95,000 Active 484 DOM
-
2026-06-08days on market $95,000 Active 483 DOM
-
2026-06-07days on market $95,000 Active 482 DOM
-
2026-06-03days on market $95,000 Active 478 DOM
-
2026-06-02days on market $95,000 Active 477 DOM
-
2026-06-01days on market $95,000 Active 476 DOM
-
2026-05-31days on market $95,000 Active 475 DOM
-
2026-05-30days on market $95,000 Active 474 DOM
-
2025-08-31historical $850
-
2025-08-25$850
-
2025-06-18status Active 319-char remark
Show marketing remark (319 chars)
Check out this Bungalow style home located in the heart of West Monroe with convenient access to all West Monroe has to offer including easy downtown access, grocery stores, shopping, and lots of dining options too!! Features hardwood floors, separate dining room and large fenced backyard. Great investment property. .
-
2025-06-04status Pending 319-char remark
Show marketing remark (319 chars)
Check out this Bungalow style home located in the heart of West Monroe with convenient access to all West Monroe has to offer including easy downtown access, grocery stores, shopping, and lots of dining options too!! Features hardwood floors, separate dining room and large fenced backyard. Great investment property. .
-
2025-01-27$95,000 Active 319-char remark
Show marketing remark (319 chars)
Check out this Bungalow style home located in the heart of West Monroe with convenient access to all West Monroe has to offer including easy downtown access, grocery stores, shopping, and lots of dining options too!! Features hardwood floors, separate dining room and large fenced backyard. Great investment property. .
-
2023-11-08$98,000 Active
ⓘ Source: listings_history table (triggers on properties + properties_extension) + one-shot
backfill from property_details.listing_events for pre-trigger history.
Tax reassessment forecast LA · Resets to sale price
- Current annual tax
- $538 · $45/mo
- Projected year-2 tax
- $538 · $45/mo
- Expected delta
- $0/yr ($0/mo · 0.0%)
ⓘ Screening estimate from a state-policy table — verify with the county assessor before closing.
Climate risk First Street
- Flood 1/10 Low FEMA zone X · 0% chance over 30 yrs
- Wildfire 1/10 Low
- Heat 7/10 Severe 7 d/yr ≥112°F today · 20 d/yr by 30 yrs out
- Wind 7/10 Severe 78% chance of damaging wind over 30 yrs
- Air quality 1/10 Low 0 unhealthy d/yr today · 0 by 30 yrs out
Nearby sold comps map
Loading sold comps map…
Walkable amenities ~0.75 mi
Loading nearby amenities…
Taxation est. · year 1
- Rental income
- $17,309
- − Mortgage interest
- −$5,321
- − Property taxes
- −$538
- − Insurance
- −$475
- − Repairs & maintenance
- −$1,385
- − Management
- −$1,385
- − Depreciation
- −$2,764
- Taxable income
- $5,442
- Est. tax owed @ 24.0%
- −$1,306
- After-tax cash flow
- $5,377/yr
For passive investors: Depreciation is non-cash, so a rental often shows a tax loss while cash-flowing — sheltering income. Rental losses are passive: they offset passive income freely, and up to $25,000/yr can offset ordinary (W-2) income if you actively participate and your MAGI is under $100k (phasing out to $0 by $150k); unused losses carry forward. On sale, claimed depreciation is recaptured at up to 25%, and gains may owe capital-gains tax (a 1031 exchange can defer both). Figures are a year-1 estimate at your 24.0% rate — not tax advice; consult a CPA.
Schools (NCES district)
- District
- Ouachita Parish
- NCES district ID
- 2201200
- Math proficiency
- 31% ▼ -38.00%
- Reading proficiency
- 45% ▼ -31.00%
- Median HH income
- $43,316
- Composite
- 32.14/100
- National rank
- #5791
- State rank
- #26 of 98 in LA
Livability — West Monroe
- Score
- 70/100
- State rank
- #53
- US rank
- #7498
Category grades
Schools grade is shown separately in the Schools card above.
Census & demographics
- Census place
- West Monroe, LA
- County
- Ouachita Parish · 118,340 people
- Metro
- Monroe, LA
- Population (ZIP)
- 35,269
- Household income
- $71,639
- Rent vs Own
- Severe rent burden
- 847.0
Population outlook (Ouachita County) Hauer SSP2
- Today (2025)
- 163,370 people
- By 2030
- 165,520 · +1.3%
- By 2040
- 167,652 · +2.6%
- By 2050
- 166,699 · +2.0%
- By 2075
- 156,348 · -4.3%
- By 2100
- 134,102 · -17.9%
Race, ethnicity, and origin ACS 2023
- Neighborhood character
- Predominantly White (78%)
- Race & ethnicity
- White 78% Black 13% Hispanic / Latino 6% Two or more races 3% Asian 1%
- Hispanic origin (detail)
- Mexican 3%
- Common ancestry
- Lithuanian 3% Italian 2% Slovak 1%
- Foreign-born
- 4% · Canada
- Languages at home
- 94% English-only · Spanish 4% Other Indo-European 1%
Political lean MEDSL · Ouachita
- 2024 margin
- Strong R (+27.9) · D 35.5% · R 63.3% · Other 1.2%
- 2008→2024 swing
- -2.7pp toward R · 2008: -25.2pp · 2024: -27.9pp
- All cycles
- 2024: R+27.9 2020: R+23.6 2016: R+25.4 2012: R+20.9 2008: R+25.2
Not yet ingested
- Civics
- —
Market trends
- HPI YoY
- ▼ -95.15%
- Current HPI
- 220.1737
- Rent YoY
- ▲ 8.93%
- Metro
- Monroe, LA
- State GDP YoY
- ▲ 3.29%
- F500 in state
- 10
Industry mix (Fortune 500 HQ in LA)
| Industry | F500 HQs | Revenue |
|---|---|---|
| Telecommunications | 2 | $23B |
|
||
| Utilities | 1 | $12B |
|
||
| Wholesale / Distribution | 1 | $5B |
|
||
| Advertising | 1 | $2B |
|
||
Price history
-3.1% since first listed6 events — show timeline
- 2025-08-31 Rental Removed $850 BUILDIUM
- 2025-08-25 Listed for Rent $850 BUILDIUM
- 2025-06-18 Relisted — NELABOR
- 2025-06-04 Pending — NELABOR
- 2025-01-27 Listed $95,000 NELABOR
- 2023-11-08 Listed $98,000 NELABOR
Property tax history
+11.0%/yrLatest (2025): $538 · +3.9% YoY. Source: county tax records.
Cash-flow waterfall
monthlySold comps — $/sqft
last 12 mo · ≤1 miLoading sold comps…