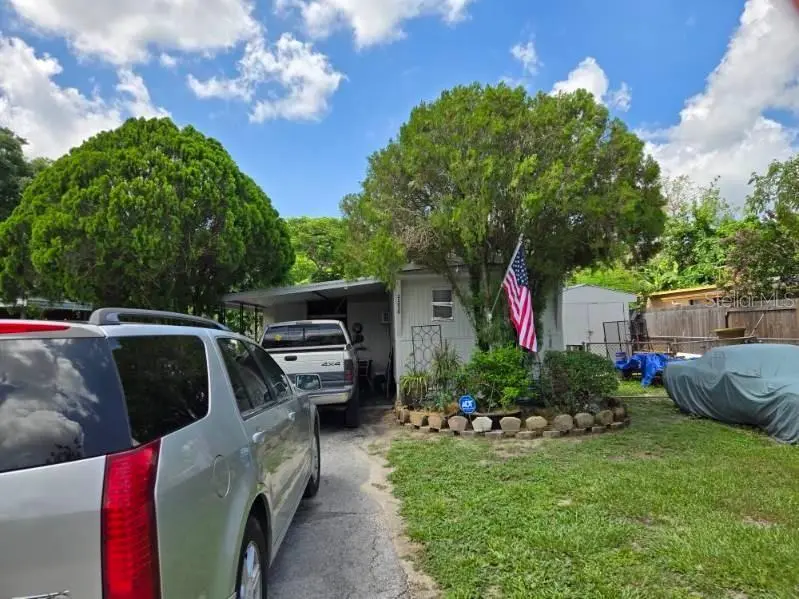
35050 Sateen Dr · Zephyrhills, FL
Flood risk 4/10 · Minor
- FEMA flood zone
- X (unshaded)
- Chance of flooding over 30 yrs
- 0.22%
- Est. flood insurance / yr
- $507 – $1,088
Fire risk 5/10 · Moderate
- Est. fire insurance / yr
- $947 – $1,759
Heat risk 9/10 · Severe
- Hot days now (above 108°F)
- 7 days/yr
- Hot days in 30 yrs
- 25 days/yr
Wind risk 9/10 · Severe
- Chance of severe wind over 30 yrs
- 99.0%
Air-quality risk 2/10 · Minimal
- Unhealthy air days now
- 1 days/yr
- Unhealthy air days in 30 yrs
- 2 days/yr
Risk factors via First Street. Map © Google.
Why this score? — see what drove the B+ grade
The composite is a weighted blend of 9 inputs, each scored 0–100. Each bar is that input's sub-score; the figure is the points it added to the 100-point composite (weight × sub-score).
- Cash flow +30.0/30.0
- ARV discount +15.0/15.0
- 1% rule +10.0/10.0
- DSCR +10.0/10.0
- Schools +4.3/10.0
- Livability +3.6/5.0
- Condition / age +2.5/5.0
- Rent growth +1.9/5.0
- Appreciation +0.0/10.0
$68,500
🖨 Deal sheet 📄 Offer letter ✓ Due diligence
Listing remarks
2/1 manufactured home (1971) in Zephyrhills, FL—priced for a quick cash sale. ~720 sq ft on a 5,662 sq ft lot (~0.13 acres). Value-add opportunity: solid plumbing/electrical, corrugated roof, window unit A/C, and functional layout. Interior features laminate/carpet flooring and Formica finishes. Includes back porch and public water. Light rehab with strong rental or resale potential. Ideal for investors seeking affordable entry point.
Key facts
- 5,640 sq ft lot
- 2 parking spots
- Built 1971
Property features AI
Finance
- Other: Property type: Residential mobile home (single wide); Zoning: RMH; Unfurnished; Direction faces: North
- Financial info: No lease restrictions indicated
- HOA & community: No HOA/association
Exterior
- Parking: Carport with 2 spaces
- Security: No security features listed
- Utilities: Public water available; Septic tank sewer; Water service available
- Home design: Residential single-wide mobile home; One story; North-facing
- Construction: Frame construction; Metal roof; Building area listed (per public records) and living area reported separately
- Exterior features: Paved road access; Lot approximately 0.12 acres (about 524 sq meters)
Interior
- Kitchen: No appliances listed
- Bedrooms: 2 bedrooms
- Flooring: Laminate flooring
- Bathrooms: 1 full bathroom
- Heating & cooling: Ductless heating; Wall/window air conditioning units
- Interior features: No notable interior features listed
- Laundry & utility: No laundry hookups or features listed
Neighborhood map
What this means for you Summary
Snapshot
- This is a 2-bed/2.0-bath manufactured listed at $68k.
Deal economics
- At list price, monthly cash flow is $1k ($12k/yr) — positive.
- The deal already cash-flows at list — no discount required.
- Meets the 1% rule at list price ($2k rent vs $68k).
- Recommended offer: $66k (3.0% below list) — sets the bar for market timing.
- Cap rate 23.9% vs local median 3.7% in Zephyrhills — top-decile yield for the area; either an underpriced asset or a hidden risk that comps aren't pricing in. Stress-test before assuming the spread holds.
Location & tenants
- Location reads 72/100 on livability (#330 in FL) — a middle-class / working-renter tenant base. Strengths: cost of living A+, housing A+, health & safety A; Watch: schools C-, crime C-, amenities F.
- Pasco (suburban): math 50% / reading 52% proficiency, ranked #32 of 73 in FL (top 44%) — acceptable for families but not a draw, mixed tenant base, ~2y average lease.
- Market conditions: Rents soft (-2.5%/yr); 856 active listings in the ZIP; 1 comparable units currently listed for rent nearby; 6,765 units permitted in Pasco County in 2024 (1,250 in 5+ unit buildings).
- This rent runs 38% of the median local income ($57k/yr) — at the standard rent-burdened threshold; future hikes will face affordability resistance.
Forward outlook
- Local home prices are declining (-3.0%/yr); year-one equity from $474 of loan paydown is wiped out by about $2k of value loss. Plan a longer hold.
- Pasco County population projected at +29% by 2050 — long-run rental-demand tailwind backs the buy-and-hold thesis.
- At projected returns (-3.0% appreciation + 0.0% rent growth), your $19k cash investment doubles in ~2 years — after that, you're playing with house money.
Negotiation context
- It's been on market 55 days — a 3% lower offer ($66k) is reasonable based on typical stale-listing flexibility.
Risks & watch-outs
- Climate carrying-cost: severe wind risk, 99% chance of damaging wind over 30y; moderate wildfire risk; extreme-heat days projected 7→25/yr by 2055 (HVAC capex compounding) — expect insurance premiums to compound above CPI over the hold.
Questions for the listing agent
- It's been on market 55 days. Have you received any prior offers? Is the seller open to a 3% concession, seller financing, or rate buy-down credit?
- Built in 1971 — when were the roof, HVAC, electrical panel, plumbing, and water heater last replaced?
- Is there a deadline driving the sale (1031 exchange, divorce, estate, relocation)? That informs how much negotiation room exists.
- What's the average days-on-market for RENTAL listings here right now (not sales)? A rising rental-DOM trend means longer vacancies and softer asking-rent achievability than the comps imply.
- What's the recent tenant-quality profile in this submarket — average credit score on applications, eviction rate, late-payment / NSF rate, and stable-employment percentage? A property-management company in the area should have these aggregated.
- How much new for-sale + rental construction is in the pipeline within 1–3 miles? Heavy new supply typically softens prices + rents 12–24 months out; constrained supply supports both.
Investment metrics
- 1% rule
- 2.64% ✓
- Cap rate
- 23.91%
- Cash-on-cash
- 62.93%
- DSCR
- 3.80
- GRM
- 3.2
CMA / ARV
- ARV (on-the-fly)
- $93,600
- Comps found
- 6
Show comp detail 6 sales within ~0.75 mi
| Address | Dist | Beds/Ba | Sqft | Sold | Price | $/sf | Match |
|---|---|---|---|---|---|---|---|
| 35204 Ada Ave | 0.34mi | 2/1.0 | 710 (-1%) | 0mo | $80,000 | $113 | 78 |
| 35012 Dale Ave | 0.35mi | 2/2.0 | 732 (+2%) | 4mo | $95,000 | $130 | 78 |
| 35142 Zephyr Shores Dr | 0.35mi | 2/2.0 | 720 (0%) | 12mo | $83,000 | $115 | 74 |
| 35238 Dodie Dr #09 | 0.45mi | 1/2.0 (-1) | 726 (+1%) | 2mo | $79,000 | $109 | 71 |
| 35246 Tiffani Lot 63 Ct | 0.52mi | 2/1.0 | 687 (-5%) | 5mo | $118,000 | $172 | 60 |
| 35220 Condominium Blvd #25 | 0.46mi | 2/1.0 | 621 (-14%) | 3mo | $90,000 | $145 | 49 |
Match score weights: distance 35% · size 25% · config 20% · recency 20%. Top-matched comps best support the ARV.
Projected returns pro-forma
-3.0% appreciation · 0.0% rent growth · sell at horizon
- IRR
- 58.6%
- Equity multiple
- 3.49×
- Total profit
- $47,665
- Equity at exit
- $10,214
- IRR
- 62.4%
- Equity multiple
- 6.40×
- Total profit
- $103,526
- Equity at exit
- $5,923
Cash invested: $19,180 (down + closing). Projections, not guarantees.
Landlord ↔ Tenant lean methodology
- Overall (STATE)
- 87 Strongly Landlord-Friendly
- State Florida
- 87 Strongly Landlord-Friendly · R+3
- County
- — inherits STATE
- City
- — inherits STATE
ZIP-level market 33541
- Home prices YoY
- -15.2%
- Rents YoY
- -2.5%
- Active inventory
- 856
- Price-to-rent
- 3.2×
Monthly cashflow live
- Estimated rent
- $1,805 medium interval (Pro) →
- Mortgage (P&I)
- −$359
- Tax from tax record
- −$33 /mo · $393/yr
- Insurance
- −$29
- HOA
- −$0
- Vacancy / Maint / Mgmt
- −$379
- Net cashflow
- $1,006
Break-even live
UW: 25.0% down · 7.5% · 30yr · 1.5% tax · 5.0% vac · 8.0% maint · 8.0% mgmt
Financing live
Cash to close
- Down payment
- $17,125
- Closing costs
- $2,055
- Reserves months
- —
- Total cash needed
- —
Loan-product check · same deal, 3 products live
Conventional
25% down · 7.5% · 30yr
- Down + closing
- —
- Monthly P&I
- —
- Monthly cashflow
- —
- DSCR
- —
- Eligible?
- —
Personal DTI + credit; lowest rate.
DSCR
20% down · 8.5% · 30yr
- Down + closing
- —
- Monthly P&I
- —
- Monthly cashflow
- —
- DSCR
- —
- Eligible?
- —
No personal income docs; deal must DSCR.
Hard money
10% down · 12.0% · 12mo
- Down + closing
- —
- Monthly P&I
- —
- Monthly cashflow
- —
- DSCR
- —
- Eligible?
- —
Short-term bridge; refi at stabilization.
Rent comps 1 comps
| Address | Beds | Baths | Sqft | Rent | $/sqft | DOM | Units | Dist |
|---|---|---|---|---|---|---|---|---|
| 34002 Painthorse Way Wesley Chapel, FL | 1.0–3.0 | 1.0–2.0 | 1022 | $2,208 | $2.16 | 2d | 46 | 1.47mi |
Listing history 16 events
-
2026-06-18days on market $68,500 Active 55 DOM
-
2026-06-17days on market $68,500 Active 54 DOM
-
2026-06-16days on market $68,500 Active 53 DOM
-
2026-06-15days on market $68,500 Active 52 DOM
-
2026-06-13days on market $68,500 Active 50 DOM
-
2026-06-09days on market $68,500 Active 46 DOM
-
2026-06-08days on market $68,500 Active 45 DOM
-
2026-06-07days on market $68,500 Active 44 DOM
-
2026-06-04days on market $68,500 Active 41 DOM
-
2026-06-03days on market $68,500 Active 40 DOM
-
2026-06-02days on market $68,500 Active 39 DOM
-
2026-06-01days on market $68,500 Active 38 DOM
-
2026-05-31days on market $68,500 Active 37 DOM
-
2026-05-12price $70,000
-
2026-05-06price $72,500
-
2026-04-24$75,000 Active
ⓘ Source: listings_history table (triggers on properties + properties_extension) + one-shot
backfill from property_details.listing_events for pre-trigger history.
Tax reassessment forecast FL · Resets to sale price
- Current annual tax
- $393 · $33/mo
- Projected year-2 tax
- $569 · $47/mo
- Expected delta
- +$176/yr (+$15/mo · 44.8%)
ⓘ Screening estimate from a state-policy table — verify with the county assessor before closing.
Climate risk First Street
- Flood 4/10 Moderate FEMA zone X (unshaded) · 22% chance over 30 yrs
- Wildfire 5/10 Major
- Heat 9/10 Extreme 7 d/yr ≥108°F today · 25 d/yr by 30 yrs out
- Wind 9/10 Extreme 99% chance of damaging wind over 30 yrs
- Air quality 2/10 Low 1 unhealthy d/yr today · 2 by 30 yrs out
Nearby sold comps map
Loading sold comps map…
Walkable amenities ~0.75 mi
Loading nearby amenities…
Taxation est. · year 1
- Rental income
- $21,665
- − Mortgage interest
- −$3,837
- − Property taxes
- −$393
- − Insurance
- −$342
- − Repairs & maintenance
- −$1,733
- − Management
- −$1,733
- − Depreciation
- −$1,993
- Taxable income
- $11,634
- Est. tax owed @ 24.0%
- −$2,792
- After-tax cash flow
- $9,278/yr
For passive investors: Depreciation is non-cash, so a rental often shows a tax loss while cash-flowing — sheltering income. Rental losses are passive: they offset passive income freely, and up to $25,000/yr can offset ordinary (W-2) income if you actively participate and your MAGI is under $100k (phasing out to $0 by $150k); unused losses carry forward. On sale, claimed depreciation is recaptured at up to 25%, and gains may owe capital-gains tax (a 1031 exchange can defer both). Figures are a year-1 estimate at your 24.0% rate — not tax advice; consult a CPA.
Schools (NCES district)
- District
- Pasco
- NCES district ID
- 1201530
- Math proficiency
- 50% ▼ -10.00%
- Reading proficiency
- 52% ▼ -5.00%
- Median HH income
- $45,039
- Composite
- 43.14/100
- National rank
- #3074
- State rank
- #32 of 73 in FL
Livability — Zephyrhills
- Score
- 72/100
- State rank
- #330
- US rank
- #5760
Category grades
Schools grade is shown separately in the Schools card above.
Census & demographics
- County
- Pasco County · 524,098 people
- City population
- 48,266
- Metro
- Tampa-St. Petersburg-Clearwater, FL
- Population (ZIP)
- 24,654
- Household income
- $56,579
- Rent vs Own
- Severe rent burden
- 393.0
Population outlook (Pasco County) Hauer SSP2
- Today (2025)
- 570,045 people
- By 2030
- 605,844 · +6.3%
- By 2040
- 674,806 · +18.4%
- By 2050
- 736,022 · +29.1%
- By 2075
- 862,900 · +51.4%
- By 2100
- 906,364 · +59.0%
Race, ethnicity, and origin ACS 2023
- Neighborhood character
- Predominantly White (72%)
- Race & ethnicity
- White 72% Hispanic / Latino 15% Two or more races 8% Black 5% Asian 5%
- Hispanic origin (detail)
- Mexican 4% Puerto Rican 9%
- Common ancestry
- Lithuanian 4% Romanian 3% Serbian 3%
- Foreign-born
- 9% · Canada, Vietnam
- Languages at home
- 85% English-only · Spanish 9% Tagalog/Filipino 1% Other Asian/Pacific 1%
Political lean MEDSL · Pasco
- 2024 margin
- Strong R (+25.2) · D 36.9% · R 62.1% · Other 1.0%
- 2008→2024 swing
- -21.6pp toward R · 2008: -3.6pp · 2024: -25.2pp
- All cycles
- 2024: R+25.2 2020: R+20.1 2016: R+21.6 2012: R+6.7 2008: R+3.6
Not yet ingested
- Civics
- —
Market trends
- HPI YoY
- ▼ -55.21%
- Current HPI
- 308.0619
- Rent YoY
- ▼ -2.51%
- Metro
- Tampa-St. Petersburg-Clearwater, FL
- State GDP YoY
- ▲ 3.28%
- F500 in state
- 36
Industry mix (Fortune 500 HQ in FL)
| Industry | F500 HQs | Revenue |
|---|---|---|
| Industrial Technology | 2 | $29B |
|
||
| Insurance | 2 | $17B |
|
||
| Retail | 1 | $60B |
|
||
| Technology Distribution | 1 | $58B |
|
||
| Homebuilding | 1 | $35B |
|
||
| Technology Manufacturing | 1 | $35B |
|
||
Price history
-6.7% since first listed3 events — show timeline
- 2026-05-12 Price Changed $70,000 Stellar MLS as Distributed by MLS Grid
- 2026-05-06 Price Changed $72,500 Stellar MLS as Distributed by MLS Grid
- 2026-04-24 Listed $75,000 Stellar MLS as Distributed by MLS Grid
Property tax history
-0.6%/yrLatest (2025): $393 · +6.8% YoY. Source: county tax records.
Cash-flow waterfall
monthlySold comps — $/sqft
last 12 mo · ≤1 miLoading sold comps…