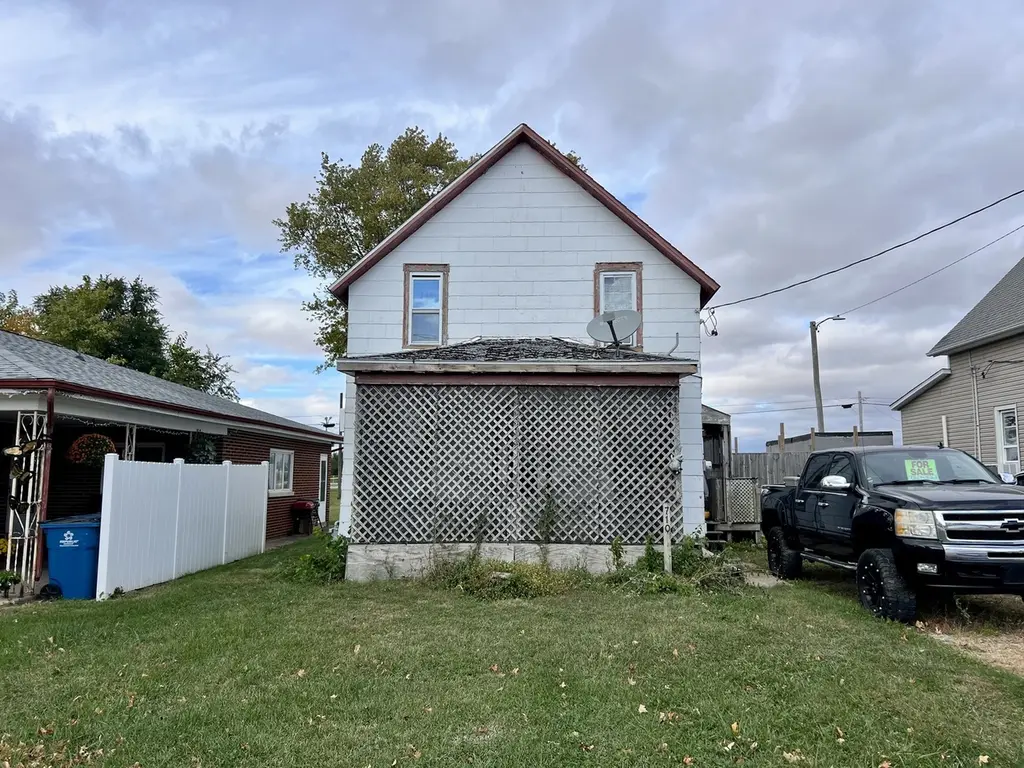
710 W Main St · Hoopeston, IL
Flood risk 1/10 · Minimal
- FEMA flood zone
- X (unshaded)
- Chance of flooding over 30 yrs
- 0.0%
- Est. flood insurance / yr
- $473 – $860
Fire risk 1/10 · Minimal
- Est. fire insurance / yr
- $804 – $1,492
Heat risk 3/10 · Minor
- Hot days now (above 103°F)
- 7 days/yr
- Hot days in 30 yrs
- 18 days/yr
Wind risk 2/10 · Minimal
- Chance of severe wind over 30 yrs
- 1.0%
Air-quality risk 2/10 · Minimal
- Unhealthy air days now
- 1 days/yr
- Unhealthy air days in 30 yrs
- 1 days/yr
Risk factors via First Street. Map © Google.
Why this score? — see what drove the A- grade
The composite is a weighted blend of 9 inputs, each scored 0–100. Each bar is that input's sub-score; the figure is the points it added to the 100-point composite (weight × sub-score).
- Cash flow +30.0/30.0
- ARV discount +15.0/15.0
- 1% rule +10.0/10.0
- DSCR +10.0/10.0
- Appreciation +6.4/10.0
- Livability +2.9/5.0
- Rent growth +2.5/5.0
- Condition / age +2.5/5.0
- Schools +1.0/10.0
$37,500
🖨 Deal sheet (PDF) 📄 Offer letter ✓ Due diligence
Listing remarks MLS
nvestor special in Hoopeston! Bring your creativity and tools to this charming home and make it your own or add to your portfolio. The flowing layout includes a spacious living room, large kitchen and separate laundry area. Take a look at the unfinished basement for bonus storage space. Outside, a deep backyard offers plenty of space to play! Sold as is.
Key facts
- 6,534 sq ft lot
- 2 parking spots
- Built 1930
Neighborhood map
What this means for you Summary
Snapshot
- This is a 1-bed/1.0-bath other listed at $38k.
Deal economics
- At list price, monthly cash flow is $223 ($3k/yr) — positive.
- The deal already cash-flows at list — no discount required.
- Meets the 1% rule at list price ($621 rent vs $38k).
- Recommended offer: $33k (12.0% below list) — sets the bar for market timing.
- Cap rate 13.4% vs local median 7.3% in Hoopeston — top-decile yield for the area; either an underpriced asset or a hidden risk that comps aren't pricing in. Stress-test before assuming the spread holds.
Location & tenants
- Location reads 57/100 on livability (#1,152 in IL) — a working-class tenant base; expect higher turnover. Strengths: cost of living A+, housing B+; Watch: crime D+, amenities F, commute F.
- Hoopeston Area CUSD 11 (town): math 9% / reading 15% proficiency, ranked #559 of 620 in IL (top 90%) — low school quality limits family demand, transient renter base, plan for 1-2y turnover.
- Zoned schools: Maple Elem School (311 students, 0% FRL); Hoopeston Area Middle School (math 5% / reading 11%, grade F, #608 of 665 statewide, top 92%, 249 students, 0% FRL); Hoopeston Area High School (math 17% / reading 17%, grade F, #430 of 693 statewide, top 66%, 338 students, 0% FRL) — zoned schools average 0% FRL vs 58% district-wide (58 pts lower); this property's tenant base skews higher-income than the district average.
- Market conditions: 41 active listings in the ZIP; 4 comparable units currently listed for rent nearby; rentals lingering (median 45d on market — plan ~5-8 weeks vacancy on turnover, expect pricing pressure); 50% of comp listings sitting > 30 days — soft ceiling on asking rent; 8 units permitted in Vermilion County in 2024 (0 in 5+ unit buildings).
Forward outlook
- In year one you build about $1k of equity ($259 loan paydown + $1k appreciation (2.8% local appreciation)).
- Vermilion County population projected at -24% by 2050 — secular population decline; favor cash flow + early exit over multi-decade hold.
- At projected returns (2.8% appreciation + 3.0% rent growth), your $10k cash investment doubles in ~3 years — after that, you're playing with house money.
Negotiation context
- It's been on market 240 days — a 12% lower offer ($33k) is reasonable based on typical stale-listing flexibility.
- 4 sale attempts since 4y ago with the ask held roughly flat each time — persistent listings suggest the price (not the market) is what's stuck; bring a comps-based counter.
- Current owner paid $15k; list at $38k implies a 150% gain — meaningful room to come down on a strong offer.
Risks & watch-outs
- Watch-outs: built in 1930 — expect roof / HVAC / electrical / plumbing capex.
Questions for the listing agent
- It's been on market 240 days. Have you received any prior offers? Is the seller open to a 12% concession, seller financing, or rate buy-down credit?
- Built in 1930 — when were the roof, HVAC, electrical panel, plumbing, and water heater last replaced?
- Why hasn't it sold? Are there any deal-killer items the seller is aware of (foundation, flood, title, zoning, code violations)?
- Is there a deadline driving the sale (1031 exchange, divorce, estate, relocation)? That informs how much negotiation room exists.
- Schools are F-rated, which usually means shorter tenancies and higher turnover. Who's the typical renter profile here, and what's been the actual vacancy rate?
- Crime grade is D in this area — have there been break-ins, vandalism, or insurance claims at this property in the last 3 years? What carrier currently insures it and at what premium?
- What's the average days-on-market for RENTAL listings here right now (not sales)? A rising rental-DOM trend means longer vacancies and softer asking-rent achievability than the comps imply.
- What's the recent tenant-quality profile in this submarket — average credit score on applications, eviction rate, late-payment / NSF rate, and stable-employment percentage? A property-management company in the area should have these aggregated.
- How much new for-sale + rental construction is in the pipeline within 1–3 miles? Heavy new supply typically softens prices + rents 12–24 months out; constrained supply supports both.
Investment metrics
- 1% rule
- 1.66% ✓
- Cap rate
- 13.43%
- Cash-on-cash
- 25.50%
- DSCR
- 2.13
- GRM
- 5.0
CMA / ARV
- ARV (median comp)
- $52,214
- List price
- $37,500
- Delta
- -28.18%
- Verdict
- UNDERPRICED
- Comps
- 20 within 1.0 mi
Projected returns pro-forma
2.77% appreciation · 3.0% rent growth · sell at horizon
- IRR
- 31.1%
- Equity multiple
- 2.74×
- Total profit
- $18,290
- Equity at exit
- $16,378
- IRR
- 31.7%
- Equity multiple
- 5.36×
- Total profit
- $45,787
- Equity at exit
- $24,871
Cash invested: $10,500 (down + closing). Projections, not guarantees.
Landlord ↔ Tenant lean methodology
- Overall (STATE)
- 43 Moderately Tenant-Leaning
- State Illinois
- 43 Moderately Tenant-Leaning · D+7
- County
- — inherits STATE
- City
- — inherits STATE
ZIP-level market 60942
- Home prices YoY
- 1.4%
- Active inventory
- 41
- Price-to-rent
- 5.0×
Monthly cashflow live
- Estimated rent
- $621 medium interval (Pro) →
- Mortgage (P&I)
- −$197
- Tax from tax record
- −$55 /mo · $660/yr
- Insurance
- −$16
- HOA
- −$0
- Vacancy / Maint / Mgmt
- −$130
- Net cashflow
- $223
Break-even live
Sensitivity live
| Price | -10% $244 | -5% $234 | +0% $223 | +5% $213 | +10% $202 |
|---|---|---|---|---|---|
| Rent | -10% $174 | -5% $199 | +0% $223 | +5% $248 | +10% $272 |
| Rate | -1.0pp $242 | -0.5pp $233 | base $223 | +0.5pp $213 | +1.0pp $204 |
UW: 25.0% down · 7.5% · 30yr · 1.5% tax · 5.0% vac · 8.0% maint · 8.0% mgmt
Financing live
Cash to close
- Down payment
- $9,375
- Closing costs
- $1,125
- Reserves months
- —
- Total cash needed
- —
Loan-product check · same deal, 3 products live
Conventional
25% down · 7.5% · 30yr
- Down + closing
- —
- Monthly P&I
- —
- Monthly cashflow
- —
- DSCR
- —
- Eligible?
- —
Personal DTI + credit; lowest rate.
DSCR
20% down · 8.5% · 30yr
- Down + closing
- —
- Monthly P&I
- —
- Monthly cashflow
- —
- DSCR
- —
- Eligible?
- —
No personal income docs; deal must DSCR.
Hard money
10% down · 12.0% · 12mo
- Down + closing
- —
- Monthly P&I
- —
- Monthly cashflow
- —
- DSCR
- —
- Eligible?
- —
Short-term bridge; refi at stabilization.
Rent comps 4 comps
| Address | Beds | Baths | Sqft | Rent | $/sqft | DOM | Units | Dist |
|---|---|---|---|---|---|---|---|---|
| 422 E Seminary Ave Unit 13 Hoopeston, IL | 2.0 | 1.0 | 750 | $675 | $0.90 | 15d | 1 | 0.82mi |
| 504 E Honeywell Ave Unit 1 Hoopeston, IL | 1.0 | 1.0 | 650 | $699 | $1.08 | 45d | 1 | 0.85mi |
| 824 E Wyman Ave Unit 5 Hoopeston, IL | 1.0 | 1.0 | 850 | $525 | $0.62 | 45d | 1 | 1.29mi |
| 824 E Wyman Ave Hoopeston, IL | 1.0 | 1.0 | 850 | $550 | $0.65 | 22d | 1 | 1.29mi |
Listing history 26 events
-
2026-06-21days on market $37,500 Active 240 DOM
-
2026-06-21days on market $37,500 Active 239 DOM
-
2026-06-18days on market $37,500 Active 237 DOM
-
2026-06-17days on market $37,500 Active 236 DOM
-
2026-06-16days on market $37,500 Active 235 DOM
-
2026-06-15days on market $37,500 Active 234 DOM
-
2026-06-13days on market $37,500 Active 232 DOM
-
2026-06-12days on market $37,500 Active 231 DOM
-
2026-06-09days on market $37,500 Active 228 DOM
-
2026-06-08days on market $37,500 Active 227 DOM
-
2026-06-07days on market $37,500 Active 226 DOM
-
2026-06-07days on market $37,500 Active 225 DOM
-
2026-06-04days on market $37,500 Active 222 DOM
-
2026-06-02days on market $37,500 Active 221 DOM
-
2026-06-01days on market $37,500 Active 220 DOM
-
2026-05-31days on market $37,500 Active 219 DOM
-
2026-05-31days on market $37,500 Active 218 DOM
-
2025-12-01$37,500 Active 356-char remark
Show marketing remark (356 chars)
nvestor special in Hoopeston! Bring your creativity and tools to this charming home and make it your own or add to your portfolio. The flowing layout includes a spacious living room, large kitchen and separate laundry area. Take a look at the unfinished basement for bonus storage space. Outside, a deep backyard offers plenty of space to play! Sold as is.
-
2025-10-24$37,500 Active 357-char remark
Show marketing remark (357 chars)
Investor special in Hoopeston! Bring your creativity and tools to this charming home and make it your own or add to your portfolio. The flowing layout includes a spacious living room, large kitchen and separate laundry area. Take a look at the unfinished basement for bonus storage space. Outside, a deep backyard offers plenty of space to play! Sold as is.
-
2022-05-24soldstatus $15,000
-
2022-05-24soldstatus $15,000
-
2022-04-28$19,900
-
2022-04-27$19,900
-
1992-11-16soldstatus $9,500
-
1982-11-16soldstatus $7,000
-
1971-07-08soldstatus $6,000
ⓘ Source: listings_history table (triggers on properties + properties_extension) + one-shot
backfill from property_details.listing_events for pre-trigger history.
Tax reassessment forecast IL · Partial reset (capped growth)
- Current annual tax
- $660 · $55/mo
- Projected year-2 tax
- $755 · $63/mo
- Expected delta
- +$96/yr (+$8/mo · 14.5%)
ⓘ Screening estimate from a state-policy table — verify with the county assessor before closing.
Climate risk First Street
- Flood 1/10 Low FEMA zone X (unshaded) · 0% chance over 30 yrs
- Wildfire 1/10 Low
- Heat 3/10 Moderate 7 d/yr ≥103°F today · 18 d/yr by 30 yrs out
- Wind 2/10 Low 100% chance of damaging wind over 30 yrs
- Air quality 2/10 Low 1 unhealthy d/yr today · 1 by 30 yrs out
Nearby sold comps map
Loading sold comps map…
Walkable amenities ~0.75 mi
Loading nearby amenities…
Taxation est. · year 1
- Rental income
- $7,449
- − Mortgage interest
- −$2,101
- − Property taxes
- −$660
- − Insurance
- −$188
- − Repairs & maintenance
- −$596
- − Management
- −$596
- − Depreciation
- −$1,091
- Taxable income
- $2,219
- Est. tax owed @ 24.0%
- −$532
- After-tax cash flow
- $2,145/yr
For passive investors: Depreciation is non-cash, so a rental often shows a tax loss while cash-flowing — sheltering income. Rental losses are passive: they offset passive income freely, and up to $25,000/yr can offset ordinary (W-2) income if you actively participate and your MAGI is under $100k (phasing out to $0 by $150k); unused losses carry forward. On sale, claimed depreciation is recaptured at up to 25%, and gains may owe capital-gains tax (a 1031 exchange can defer both). Figures are a year-1 estimate at your 24.0% rate — not tax advice; consult a CPA.
Schools (NCES district)
- District
- Hoopeston Area CUSD 11
- NCES district ID
- 1719660
- Math proficiency
- 9% ▼ -7.00%
- Reading proficiency
- 15% ▼ -3.00%
- Median HH income
- $40,897
- Composite
- 10.39/100
- National rank
- #9786
- State rank
- #559 of 620 in IL
Livability — Hoopeston
- Score
- 57/100
- State rank
- #1152
- US rank
- #21789
Category grades
Schools grade is shown separately in the Schools card above.
Census & demographics
- Census place
- Hoopeston, IL
- City population
- 5,635
- Population (ZIP)
- 5,635
Population outlook (Vermilion County) Hauer SSP2
- Today (2025)
- 72,775 people
- By 2030
- 69,235 · -4.9%
- By 2040
- 62,360 · -14.3%
- By 2050
- 55,539 · -23.7%
- By 2075
- 40,606 · -44.2%
- By 2100
- 26,985 · -62.9%
Race, ethnicity, and origin ACS 2023
- Neighborhood character
- Predominantly White (91%)
- Race & ethnicity
- White 91% Hispanic / Latino 5% Two or more races 4% Black 2% Asian 1%
- Common ancestry
- Portuguese 4% Slovak 2% Italian 2%
- Foreign-born
- 1% · Canada, South Korea
- Languages at home
- 96% English-only · Spanish 4% Other Indo-European 1%
Political lean MEDSL · Vermilion
- 2024 margin
- Solid R (+35.7) · D 31.4% · R 67.0% · Other 1.6%
- 2008→2024 swing
- -36.2pp toward R · 2008: 0.6pp · 2024: -35.7pp
- All cycles
- 2024: R+35.7 2020: R+32.9 2016: R+29.2 2012: R+15.7 2008: D+0.6
Not yet ingested
- Civics
- —
Market trends
- HPI YoY
- ▲ 2.77%
- Current HPI
- 193.4089
- Rent YoY
- —
- Metro
- —
- State GDP YoY
- ▲ 1.59%
- F500 in state
- 60
Industry mix (Fortune 500 HQ in IL)
| Industry | F500 HQs | Revenue |
|---|---|---|
| Insurance | 4 | $201B |
|
||
| Consumer Goods | 4 | $87B |
|
||
| Industrial Machinery | 3 | $64B |
|
||
| Healthcare | 2 | $55B |
|
||
| Retail / Pharmacy | 1 | $148B |
|
||
| Agriculture / Food | 1 | $86B |
|
||
Price history
+525.0% since first listed9 events — show timeline
- 2025-12-01 Listed $37,500 CIBR
- 2025-10-24 Listed $37,500 MRED as Distributed by MLS Grid
- 2022-05-24 Sold (MLS) $15,000 CIBR
- 2022-05-24 Sold (MLS) $15,000 MRED as Distributed by MLS Grid
- 2022-04-28 Listed $19,900 MRED as Distributed by MLS Grid
- 2022-04-27 Listed $19,900 CIBR
- 1992-11-16 Sold (Public Records) $9,500 Public Records
- 1982-11-16 Sold (Public Records) $7,000 Public Records
- 1971-07-08 Sold (Public Records) $6,000 Public Records
Property tax history
+145.5%/yrLatest (2024): $660 · +8.0% YoY. Source: county tax records.
Cash-flow waterfall
monthlySold comps — $/sqft
last 12 mo · ≤1 miLoading sold comps…