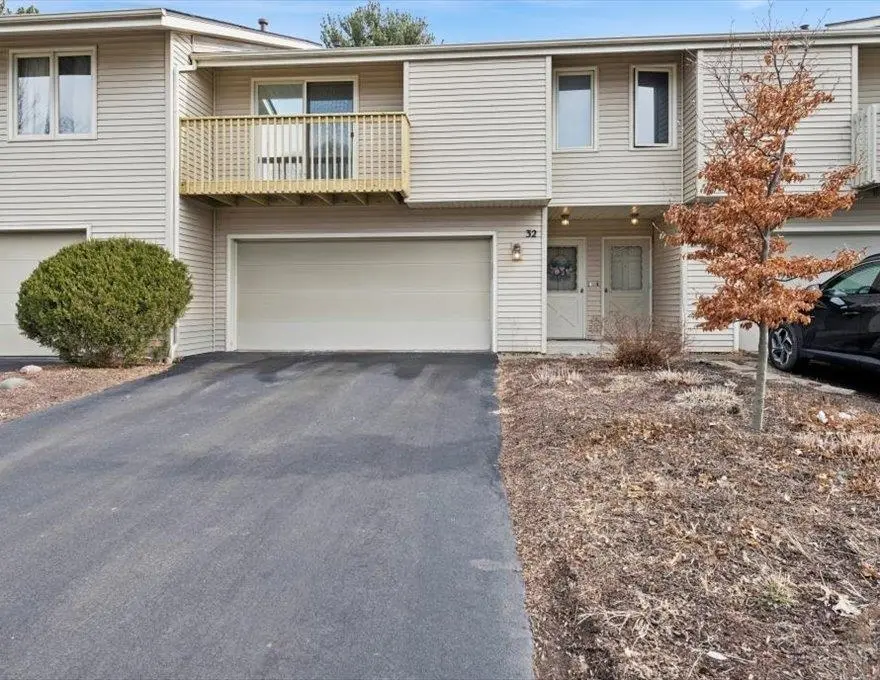
4657 High Point Dr · Rockford, IL
Flood risk No data
- FEMA flood zone
- —
- Chance of flooding over 30 yrs
- —
- Est. flood insurance / yr
- —
Fire risk No data
- Est. fire insurance / yr
- —
Heat risk No data
- Hot days now (above threshold)
- —
- Hot days in 30 yrs
- —
Wind risk No data
- Chance of severe wind over 30 yrs
- —
Air-quality risk No data
- Unhealthy air days now
- —
- Unhealthy air days in 30 yrs
- —
Risk factors via First Street. Map © Google.
Why this score? — see what drove the D grade
The composite is a weighted blend of 9 inputs, each scored 0–100. Each bar is that input's sub-score; the figure is the points it added to the 100-point composite (weight × sub-score).
- Cash flow +12.5/30.0
- ARV discount +9.4/15.0
- 1% rule +5.3/10.0
- Condition / age +3.8/5.0
- DSCR +3.7/10.0
- Livability +3.1/5.0
- Rent growth +2.5/5.0
- Schools +1.2/10.0
- Appreciation +0.0/10.0
$180,000
🖨 Deal sheet (PDF) 📄 Offer letter ✓ Due diligence
Listing remarks MLS
IDEAL NE LOCATION. END UNIT BACKS UP TO LUTHERAN HIGH SCHOOL BASEBALL DIAMOND/PARK. NICELY UPDATED, WOOD FLOORING, PARTIAL EXPOSED LOWER WITH BATH. MOVE IN READY. ASSOCIATION HAS ADDITIONAL $16.07 MONTHLY ASSESSMENT (5 YR) FOR REPAVING ROADS AND DRIVEWAYS. SELLER OFFERS HOME WARRANTY PLUS $2,000 CREDIT FOR 3 WINDOWS TO BE REPLACED ON LOWER LEVEL.
Key facts
- New furnace
- Walk-in closet
- Updated kitchen
Tags
Property features AI
Finance
- HOA & community: Homeowners association with a $240 monthly fee
Exterior
- Parking: Attached asphalt 2-car garage
- Utilities: Public water; Public sewer
- Home design: Residential townhouse (condominium)
- Exterior features: Shingle roof; Full basement (finished below grade area)
Interior
- Kitchen: Dishwasher; Disposal; Microwave; Refrigerator
- Bathrooms: 1 full bathroom
- Heating & cooling: Central air conditioning
- Interior features: Walk-in closet(s); One fireplace
- Laundry & utility: Dryer; Water softener; Gas water heater
Neighborhood map
What this means for you Summary
Snapshot
- This is a 2-bed/1.0-bath townhouse listed at $180k. Condition is rated good.
Deal economics
- At list price, monthly cash flow is $-26 ($-313/yr) — negative.
- To cash-flow at today's rent, offer at most $176k (2.1% below list).
- Meets the 1% rule at list price ($2k rent vs $180k).
- Recommended offer: $176k (2.1% below list) — sets the bar for cash-flow.
Location & tenants
- Location reads 62/100 on livability (#876 in IL) — a middle-class / working-renter tenant base. Strengths: cost of living A+, housing A+, health & safety A+; Watch: crime F, amenities F, commute F.
- Rockford SD 205 (urban): math 12% / reading 16% proficiency, ranked #533 of 620 in IL (top 86%) — low school quality limits family demand, transient renter base, plan for 1-2y turnover; 73% free/reduced lunch — lower-income household profile, screen leases tightly.
- Zoned schools: Spring Creek Elem School (math 17% / reading 22%, grade F, #1,054 of 2,056 statewide, top 54%, 501 students, 0% FRL); Eisenhower Middle School (math 9% / reading 17%, grade F, #540 of 665 statewide, top 82%, 961 students, 0% FRL); Guilford High School (math 15% / reading 28%, grade F, #345 of 693 statewide, top 50%, 2,071 students, 0% FRL) — zoned schools average 0% FRL vs 73% district-wide (73 pts lower); this property's tenant base skews higher-income than the district average.
- Market conditions: 74 active listings in the ZIP; 6 comparable units currently listed for rent nearby; rentals at typical pace (median 15d on market — plan ~3-4 weeks tenant-placement turnaround); 285 units permitted in Winnebago County in 2024 (0 in 5+ unit buildings).
Forward outlook
- Local home prices are declining (-3.0%/yr); year-one equity from $1k of loan paydown is wiped out by about $5k of value loss. Plan a longer hold.
- Winnebago County population projected at -20% by 2050 — secular population decline; favor cash flow + early exit over multi-decade hold.
Negotiation context
- It's been on market 24 days — a 2% lower offer ($177k) is reasonable based on typical stale-listing flexibility.
- 2 sale attempts since 7y ago; this cycle's ask has dropped $10k (5%) from the opening price — seller is motivated, your offer sets the floor, not the list.
- Current owner paid $91k; list at $180k implies a 98% gain — meaningful room to come down on a strong offer.
Questions for the listing agent
- What do current leases actually rent for vs. the listed asking? Can we see a recent rent roll and the last 12 months of T-12 income?
- What does the HOA fee cover, when was the last increase, and are there any pending special assessments or reserve-fund shortfalls?
- Is there a deadline driving the sale (1031 exchange, divorce, estate, relocation)? That informs how much negotiation room exists.
- Schools are F-rated, which usually means shorter tenancies and higher turnover. Who's the typical renter profile here, and what's been the actual vacancy rate?
- Crime grade is F in this area — have there been break-ins, vandalism, or insurance claims at this property in the last 3 years? What carrier currently insures it and at what premium?
- The area grade is low — what's the realistic commute time and amenity access for the typical tenant pool here? Any planned neighborhood developments (good or bad) we should know about?
- What's the average days-on-market for RENTAL listings here right now (not sales)? A rising rental-DOM trend means longer vacancies and softer asking-rent achievability than the comps imply.
- What's the recent tenant-quality profile in this submarket — average credit score on applications, eviction rate, late-payment / NSF rate, and stable-employment percentage? A property-management company in the area should have these aggregated.
- How much new for-sale + rental construction is in the pipeline within 1–3 miles? Heavy new supply typically softens prices + rents 12–24 months out; constrained supply supports both.
Investment metrics
- 1% rule
- 1.03% ✓
- Cap rate
- 6.12%
- Cash-on-cash
- -0.62%
- DSCR
- 0.97
- GRM
- 8.1
CMA / ARV
- ARV (median comp)
- $187,904
- List price
- $180,000
- Delta
- 1.12%
- Verdict
- FAIR
- Comps
- 18 within 1.0 mi
Show comp detail 12 sales within ~0.75 mi
| Address | Dist | Beds/Ba | Sqft | Sold | Price | $/sf | Match |
|---|---|---|---|---|---|---|---|
| 4653 High Point Dr #28 | 0.05mi | 2/1.5 | 1,381 (-1%) | 2mo | $180,000 | $130 | 92 |
| 4669 High Point Drive #56 Dr | 0.05mi | 2/2.0 | 1,367 (-2%) | 7mo | $179,000 | $131 | 84 |
| 4649 High Point Dr Apt#25 Dr | 0.05mi | 3/1.5 (+1) | 1,402 (+0%) | 8mo | $179,900 | $128 | 84 |
| 3527 Inglenook Ln #3527 | 0.25mi | 2/2.0 | 1,401 (0%) | 5mo | $190,000 | $136 | 80 |
| 4645 High Point Drive #15 | 0.05mi | 2/1.5 | 1,381 (-1%) | 20mo | $151,000 | $109 | 77 |
| 3516 Grandview Dr | 0.20mi | 2/2.0 | 1,401 (0%) | 14mo | $206,000 | $147 | 75 |
| 3518 Grandview Dr #3518 | 0.20mi | 2/3.0 | 1,401 (0%) | 16mo | $209,000 | $149 | 70 |
| 3518 Grandview Dr | 0.20mi | 2/3.0 | 1,401 (0%) | 16mo | $209,000 | $149 | 70 |
| 4641 High Point Dr | 0.08mi | 2/2.0 | 1,549 (+11%) | 8mo | $180,000 | $116 | 67 |
| 1845 Bright View Dr | 0.72mi | 2/1.5 | 1,340 (-4%) | 2mo | $165,000 | $123 | 55 |
| 5027 Woodlake Dr | 0.74mi | 1/1.5 (-1) | 1,480 (+6%) | 3mo | $116,000 | $78 | 47 |
| 3980 Pepper Dr #0 | 0.75mi | 3/3.0 (+1) | 1,228 (-12%) | 21mo | $200,000 | $163 | 14 |
Match score weights: distance 35% · size 25% · config 20% · recency 20%. Top-matched comps best support the ARV.
Projected returns pro-forma
-3.0% appreciation · 3.0% rent growth · sell at horizon
- IRR
- -17.2%
- Equity multiple
- 0.39×
- Total profit
- $-30,651
- Equity at exit
- $26,839
- IRR
- -9.0%
- Equity multiple
- 0.44×
- Total profit
- $-28,114
- Equity at exit
- $15,563
Cash invested: $50,400 (down + closing). Projections, not guarantees.
Landlord ↔ Tenant lean methodology
- Overall (STATE)
- 43 Moderately Tenant-Leaning
- State Illinois
- 43 Moderately Tenant-Leaning · D+7
- County
- — inherits STATE
- City
- — inherits STATE
ZIP-level market 61114
- Home prices YoY
- -27.1%
- Active inventory
- 74
- Price-to-rent
- 8.1×
Monthly cashflow live
- Estimated rent
- $1,845 high interval (Pro) →
- Mortgage (P&I)
- −$944
- Tax est. 1.5%
- −$225 /mo · $2,700/yr
- Insurance
- −$75
- HOA
- −$240
- Vacancy / Maint / Mgmt
- −$388
- Net cashflow
- $-26
Break-even live
Sensitivity live
| Price | -10% $98 | -5% $36 | +0% $-26 | +5% $-88 | +10% $-150 |
|---|---|---|---|---|---|
| Rent | -10% $-172 | -5% $-99 | +0% $-26 | +5% $47 | +10% $120 |
| Rate | -1.0pp $65 | -0.5pp $20 | base $-26 | +0.5pp $-73 | +1.0pp $-120 |
UW: 25.0% down · 7.5% · 30yr · 1.5% tax · 5.0% vac · 8.0% maint · 8.0% mgmt
Financing live
Cash to close
- Down payment
- $45,000
- Closing costs
- $5,400
- Reserves months
- —
- Total cash needed
- —
Loan-product check · same deal, 3 products live
Conventional
25% down · 7.5% · 30yr
- Down + closing
- —
- Monthly P&I
- —
- Monthly cashflow
- —
- DSCR
- —
- Eligible?
- —
Personal DTI + credit; lowest rate.
DSCR
20% down · 8.5% · 30yr
- Down + closing
- —
- Monthly P&I
- —
- Monthly cashflow
- —
- DSCR
- —
- Eligible?
- —
No personal income docs; deal must DSCR.
Hard money
10% down · 12.0% · 12mo
- Down + closing
- —
- Monthly P&I
- —
- Monthly cashflow
- —
- DSCR
- —
- Eligible?
- —
Short-term bridge; refi at stabilization.
Rent comps 6 comps
| Address | Beds | Baths | Sqft | Rent | $/sqft | DOM | Units | Dist |
|---|---|---|---|---|---|---|---|---|
| 3273 Kimball Rd Unit 1 Rockford, IL | 2.0 | 1.5 | 1100 | $1,600 | $1.45 | 45d | 1 | 0.30mi |
| 3273 Kimball Rd Rockford, IL | 2.0 | 1.0 | 1100 | $1,600 | $1.45 | 45d | 1 | 0.30mi |
| 4016 Eaton Dr Unit 1232695P Rockford, IL | 3.0 | 3.0 | 1722 | $4,169 | $2.42 | 14d | 1 | 0.83mi |
| 5548 Spring Brook Rd Unit 5548 Rockford, IL | 2.0 | 2.0 | 1730 | $1,650 | $0.95 | 14d | 1 | 0.92mi |
| 4112 Applewood Ln Loves Park, IL | 1.0 | 1.0 | 975 | $1,050 | $1.08 | 14d | 1 | 1.09mi |
| 4041 Rennhart Loves Park, IL | 1.0–2.0 | 1.0 | 1027 | $1,250 | $1.22 | 14d | 5 | 1.38mi |
HOA detail
- Monthly dues
- $240 · $2,880/yr
Listing history 20 events
-
2026-06-15status $180,000 Pending 24 DOM
-
2026-06-15days on market $180,000 Active 24 DOM
-
2026-06-14days on market $180,000 Active 22 DOM
-
2026-06-13days on market $180,000 Active 21 DOM
-
2026-06-10days on market $180,000 Active 19 DOM
-
2026-06-09days on market $180,000 Active 18 DOM
-
2026-06-08days on market $180,000 Active 17 DOM
-
2026-06-07pricedays on market $180,000 Active 16 DOM
-
2026-06-03days on market $185,000 Active 12 DOM
-
2026-06-02days on market $185,000 Active 11 DOM
-
2026-06-01days on market $185,000 Active 10 DOM
-
2026-05-31days on market $185,000 Active 9 DOM
-
2026-05-30days on market $185,000 Active 8 DOM
-
2026-05-09status Active 2318-char remark
-
2026-05-04status Pending 2318-char remark
-
2026-04-29status Active 2318-char remark
-
2026-04-21status Pending 2318-char remark
-
2026-04-01$190,000 Active 2318-char remark
-
2019-06-27soldstatus $91,000 348-char remark
Show marketing remark (348 chars)
IDEAL NE LOCATION. END UNIT BACKS UP TO LUTHERAN HIGH SCHOOL BASEBALL DIAMOND/PARK. NICELY UPDATED, WOOD FLOORING, PARTIAL EXPOSED LOWER WITH BATH. MOVE IN READY. ASSOCIATION HAS ADDITIONAL $16.07 MONTHLY ASSESSMENT (5 YR) FOR REPAVING ROADS AND DRIVEWAYS. SELLER OFFERS HOME WARRANTY PLUS $2,000 CREDIT FOR 3 WINDOWS TO BE REPLACED ON LOWER LEVEL.
-
2019-04-23$92,900 348-char remark
Show marketing remark (348 chars)
IDEAL NE LOCATION. END UNIT BACKS UP TO LUTHERAN HIGH SCHOOL BASEBALL DIAMOND/PARK. NICELY UPDATED, WOOD FLOORING, PARTIAL EXPOSED LOWER WITH BATH. MOVE IN READY. ASSOCIATION HAS ADDITIONAL $16.07 MONTHLY ASSESSMENT (5 YR) FOR REPAVING ROADS AND DRIVEWAYS. SELLER OFFERS HOME WARRANTY PLUS $2,000 CREDIT FOR 3 WINDOWS TO BE REPLACED ON LOWER LEVEL.
ⓘ Source: listings_history table (triggers on properties + properties_extension) + one-shot
backfill from property_details.listing_events for pre-trigger history.
Nearby sold comps map
Loading sold comps map…
Walkable amenities ~0.75 mi
Loading nearby amenities…
Taxation est. · year 1
- Rental income
- $22,145
- − Mortgage interest
- −$10,083
- − Property taxes
- −$2,700
- − Insurance
- −$900
- − Repairs & maintenance
- −$1,772
- − Management
- −$1,772
- − HOA
- −$2,880
- − Depreciation
- −$5,236
- Taxable loss
- −$3,197
- Est. tax savings @ 24.0%
- +$767
- After-tax cash flow
- $455/yr
For passive investors: Depreciation is non-cash, so a rental often shows a tax loss while cash-flowing — sheltering income. Rental losses are passive: they offset passive income freely, and up to $25,000/yr can offset ordinary (W-2) income if you actively participate and your MAGI is under $100k (phasing out to $0 by $150k); unused losses carry forward. On sale, claimed depreciation is recaptured at up to 25%, and gains may owe capital-gains tax (a 1031 exchange can defer both). Figures are a year-1 estimate at your 24.0% rate — not tax advice; consult a CPA.
Condition & rehab AI · 12 photos
This townhouse is in good condition with fresh updates and a move-in-ready appearance. It offers a spacious living area, updated kitchen, and two bedrooms. The property is well-maintained and ready for new owners.
Value-add opportunities
- Both paint interior walls — fresh paint enhances curb appeal and interior aesthetics
- Both replace carpet in bedrooms — carpet can be worn and is not as durable as other flooring options
- Both install new window treatments — new window treatments can improve energy efficiency and enhance curb appeal
Renovation cost estimate screening
Value-add ROI direction
- Both paint interior walls — fresh paint enhances curb appeal and interior aesthetics ↑
- Both replace carpet in bedrooms — carpet can be worn and is not as durable as other flooring options ↑
- Both install new window treatments — new window treatments can improve energy efficiency and enhance curb appeal ↑
ⓘ Cost ranges are severity-bucket heuristics (US national rule-of-thumb). Get contractor quotes + a written scope before underwriting a rehab budget.
Schools (NCES district)
- District
- Rockford SD 205
- NCES district ID
- 1734510
- Math proficiency
- 12% ▼ -2.00%
- Reading proficiency
- 16% ▼ -3.00%
- Median HH income
- $42,533
- Composite
- 12.21/100
- National rank
- #9649
- State rank
- #533 of 620 in IL
Livability — Rockford
- Score
- 62/100
- State rank
- #876
- US rank
- #17035
Category grades
Schools grade is shown separately in the Schools card above.
Census & demographics
- Census place
- Rockford, IL
- City population
- 147,297
- Population (ZIP)
- 15,026
Population outlook (Winnebago County) Hauer SSP2
- Today (2025)
- 271,080 people
- By 2030
- 260,684 · -3.8%
- By 2040
- 238,405 · -12.1%
- By 2050
- 216,129 · -20.3%
- By 2075
- 172,882 · -36.2%
- By 2100
- 135,336 · -50.1%
Race, ethnicity, and origin ACS 2023
- Neighborhood character
- Predominantly White (72%)
- Race & ethnicity
- White 72% Hispanic / Latino 11% Black 10% Two or more races 6% Asian 4%
- Hispanic origin (detail)
- Mexican 10%
- Common ancestry
- Romanian 5% Portuguese 3% Lithuanian 2%
- Foreign-born
- 10% · Canada, Vietnam
- Languages at home
- 85% English-only · Spanish 7% Russian/Polish/Slavic 2% Other Indo-European 2%
Political lean MEDSL · Winnebago
- 2024 margin
- Toss-up / Even · D 49.5% · R 49.0% · Other 1.5%
- 2008→2024 swing
- -12.2pp toward R · 2008: 12.8pp · 2024: 0.6pp
- All cycles
- 2024: D+0.6 2020: D+2.5 2016: R+1.2 2012: D+5.7 2008: D+12.8
Not yet ingested
- Civics
- —
Market trends
- HPI YoY
- ▼ -84.00%
- Current HPI
- 225.8485
- Rent YoY
- —
- Metro
- —
- State GDP YoY
- ▲ 1.59%
- F500 in state
- 60
Industry mix (Fortune 500 HQ in IL)
| Industry | F500 HQs | Revenue |
|---|---|---|
| Insurance | 4 | $201B |
|
||
| Consumer Goods | 4 | $87B |
|
||
| Industrial Machinery | 3 | $64B |
|
||
| Healthcare | 2 | $55B |
|
||
| Retail / Pharmacy | 1 | $148B |
|
||
| Agriculture / Food | 1 | $86B |
|
||
Price history
+93.8% since first listed6 events — show timeline
- 2026-06-15 Pending — NWIAR
- 2026-06-05 Price Changed $180,000 NWIAR
- 2026-05-26 Price Changed $185,000 NWIAR
- 2026-05-22 Listed $190,000 NWIAR
- 2019-06-27 Sold (MLS) $91,000 NWIAR
- 2019-04-23 Listed $92,900 NWIAR
Cash-flow waterfall
monthlySold comps — $/sqft
last 12 mo · ≤1 miLoading sold comps…