500 Deer Creek Rd · Havana, FL
Flood risk 1/10 · Minimal
- FEMA flood zone
- X (unshaded)
- Chance of flooding over 30 yrs
- 0.0%
- Est. flood insurance / yr
- $507 – $1,088
Fire risk 4/10 · Minor
- Est. fire insurance / yr
- $947 – $1,759
Heat risk 8/10 · Major
- Hot days now (above 107°F)
- 7 days/yr
- Hot days in 30 yrs
- 20 days/yr
Wind risk 9/10 · Severe
- Chance of severe wind over 30 yrs
- 99.0%
Air-quality risk 5/10 · Moderate
- Unhealthy air days now
- 7 days/yr
- Unhealthy air days in 30 yrs
- 7 days/yr
Risk factors via First Street. Map © Google.
Why this score? — see what drove the C+ grade
The composite is a weighted blend of 9 inputs, each scored 0–100. Each bar is that input's sub-score; the figure is the points it added to the 100-point composite (weight × sub-score).
- Cash flow +22.0/30.0
- ARV discount +15.0/15.0
- DSCR +7.0/10.0
- 1% rule +4.7/10.0
- Livability +3.7/5.0
- Schools +2.6/10.0
- Rent growth +2.5/5.0
- Condition / age +2.5/5.0
- Appreciation +0.0/10.0
$149,900
🖨 Deal sheet 📄 Offer letter ✓ Due diligence
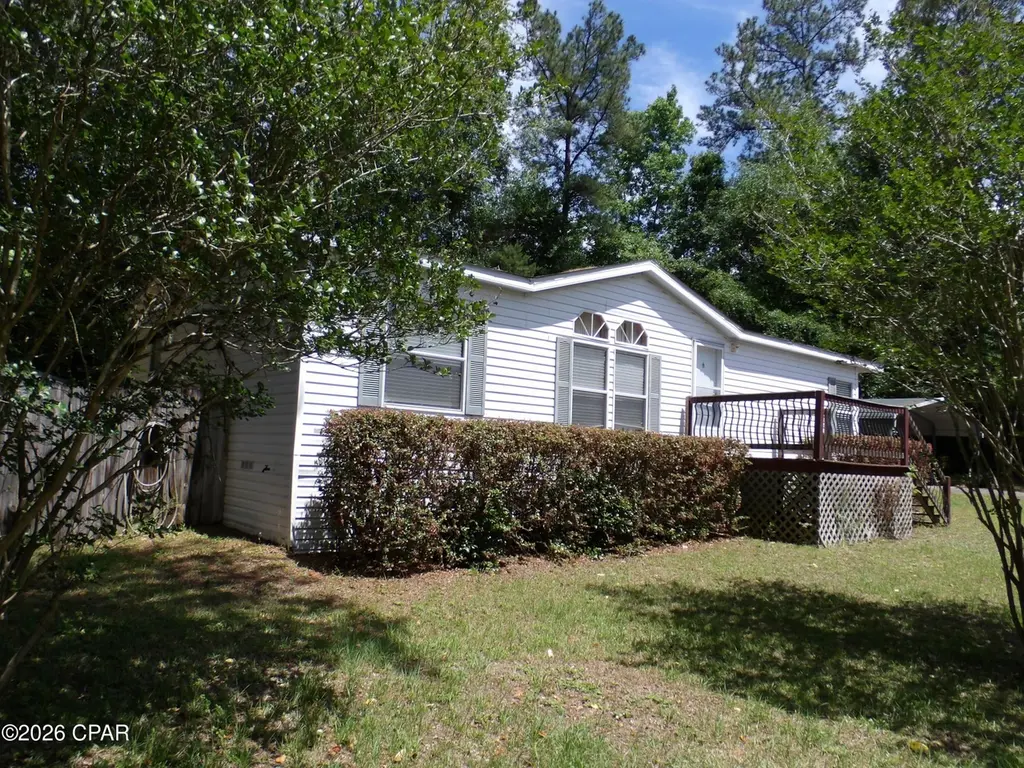
Listing remarks MLS
Three bedroom two bathroom manufactured home with carport and 10x14 shed offered as is. The home a deck on the side, a master bedroom walk in shower. The home sits on a larger triangular lot.
Key facts
- Deck on the side
- 0.42 acre lot
- 2 parking spots
Tags
Neighborhood map
What this means for you Summary
Snapshot
- This is a 3-bed/2.0-bath manufactured listed at $150k.
Deal economics
- At list price, monthly cash flow is $239 ($3k/yr) — positive.
- The deal already cash-flows at list — no discount required.
- To meet the 1% rule (rent ≥ 1% of price), the offer needs to be $146k (2.7% below list).
- Recommended offer: $136k (9.0% below list) — sets the bar for market timing.
- Cap rate 8.2% vs local median 4.1% in Havana — top-decile yield for the area; either an underpriced asset or a hidden risk that comps aren't pricing in. Stress-test before assuming the spread holds.
Location & tenants
- Location reads 74/100 on livability (#272 in FL, #4,420 nationally) — a middle-class / working-renter tenant base. Strengths: crime A+, cost of living A+, housing A+; Watch: schools D-, amenities F, commute F.
- Gadsden (rural): math 31% / reading 31% proficiency, ranked #70 of 73 in FL (top 96%) — families likely to look elsewhere, expect single-tenant / working-renter base with shorter leases; 83% free/reduced lunch — lower-income household profile, screen leases tightly.
- Market conditions: 67 active listings in the ZIP; 107 units permitted in Gadsden County in 2024 (36 in 5+ unit buildings).
Forward outlook
- Local home prices are declining (-3.0%/yr); year-one equity from $1k of loan paydown is wiped out by about $4k of value loss. Plan a longer hold.
- Gadsden County population projected at -27% by 2050 — secular population decline; favor cash flow + early exit over multi-decade hold.
Negotiation context
- It's been on market 99 days — a 9% lower offer ($136k) is reasonable based on typical stale-listing flexibility.
- 2 sale attempts since 16y ago; this cycle's ask has dropped $19k (11%) from the opening price — seller is motivated, your offer sets the floor, not the list.
- Current owner paid $69k; list at $150k implies a 117% gain — meaningful room to come down on a strong offer.
Risks & watch-outs
- Climate carrying-cost: severe wind risk, 99% chance of damaging wind over 30y; extreme-heat days projected 7→20/yr by 2055 (HVAC capex compounding) — expect insurance premiums to compound above CPI over the hold.
Questions for the listing agent
- It's been on market 99 days. Have you received any prior offers? Is the seller open to a 9% concession, seller financing, or rate buy-down credit?
- Why hasn't it sold? Are there any deal-killer items the seller is aware of (foundation, flood, title, zoning, code violations)?
- Is there a deadline driving the sale (1031 exchange, divorce, estate, relocation)? That informs how much negotiation room exists.
- Schools are D-rated, which usually means shorter tenancies and higher turnover. Who's the typical renter profile here, and what's been the actual vacancy rate?
- What's the average days-on-market for RENTAL listings here right now (not sales)? A rising rental-DOM trend means longer vacancies and softer asking-rent achievability than the comps imply.
- What's the recent tenant-quality profile in this submarket — average credit score on applications, eviction rate, late-payment / NSF rate, and stable-employment percentage? A property-management company in the area should have these aggregated.
- How much new for-sale + rental construction is in the pipeline within 1–3 miles? Heavy new supply typically softens prices + rents 12–24 months out; constrained supply supports both.
Investment metrics
- 1% rule
- 0.97% ✗
- Cap rate
- 8.21%
- Cash-on-cash
- 6.84%
- DSCR
- 1.30
- GRM
- 8.6
CMA / ARV
- ARV (median comp)
- $221,835
- List price
- $149,900
- Delta
- -32.43%
- Verdict
- UNDERPRICED
- Comps
- 1 within 2.0 mi
Show comp detail 2 sales within ~0.75 mi
| Address | Dist | Beds/Ba | Sqft | Sold | Price | $/sf | Match |
|---|---|---|---|---|---|---|---|
| 233 Carol Ct | 0.52mi | 3/2.0 | 1,216 (+5%) | 7mo | $224,000 | $184 | 61 |
| 80 Deer Creek Rd | 0.47mi | 3/2.0 | 1,296 (+12%) | 17mo | $130,000 | $100 | 44 |
Match score weights: distance 35% · size 25% · config 20% · recency 20%. Top-matched comps best support the ARV.
Projected returns pro-forma
-3.0% appreciation · 3.0% rent growth · sell at horizon
- IRR
- -5.8%
- Equity multiple
- 0.78×
- Total profit
- $-9,113
- Equity at exit
- $22,351
- IRR
- 3.8%
- Equity multiple
- 1.27×
- Total profit
- $11,459
- Equity at exit
- $12,961
Cash invested: $41,972 (down + closing). Projections, not guarantees.
Landlord ↔ Tenant lean methodology
- Overall (STATE)
- 87 Strongly Landlord-Friendly
- State Florida
- 87 Strongly Landlord-Friendly · R+3
- County
- — inherits STATE
- City
- — inherits STATE
ZIP-level market 32333
- Home prices YoY
- -24.2%
- Active inventory
- 67
- Price-to-rent
- 8.6×
Monthly cashflow live
- Estimated rent
- $1,459 medium interval (Pro) →
- Mortgage (P&I)
- −$786
- Tax from tax record
- −$65 /mo · $776/yr
- Insurance
- −$62
- HOA
- −$0
- Vacancy / Maint / Mgmt
- −$306
- Net cashflow
- $239
Break-even live
UW: 25.0% down · 7.5% · 30yr · 1.5% tax · 5.0% vac · 8.0% maint · 8.0% mgmt
Financing live
Cash to close
- Down payment
- $37,475
- Closing costs
- $4,497
- Reserves months
- —
- Total cash needed
- —
Loan-product check · same deal, 3 products live
Conventional
25% down · 7.5% · 30yr
- Down + closing
- —
- Monthly P&I
- —
- Monthly cashflow
- —
- DSCR
- —
- Eligible?
- —
Personal DTI + credit; lowest rate.
DSCR
20% down · 8.5% · 30yr
- Down + closing
- —
- Monthly P&I
- —
- Monthly cashflow
- —
- DSCR
- —
- Eligible?
- —
No personal income docs; deal must DSCR.
Hard money
10% down · 12.0% · 12mo
- Down + closing
- —
- Monthly P&I
- —
- Monthly cashflow
- —
- DSCR
- —
- Eligible?
- —
Short-term bridge; refi at stabilization.
Listing history 21 events
-
2026-06-18days on market $149,900 Active 99 DOM
-
2026-06-17days on market $149,900 Active 98 DOM
-
2026-06-16days on market $149,900 Active 97 DOM
-
2026-06-15days on market $149,900 Active 96 DOM
-
2026-06-14days on market $149,900 Active 94 DOM
-
2026-06-13days on market $149,900 Active 93 DOM
-
2026-06-10pricedays on market $149,900 Active 91 DOM
-
2026-06-09days on market $159,900 Active 90 DOM
-
2026-06-08days on market $159,900 Active 89 DOM
-
2026-06-07days on market $159,900 Active 88 DOM
-
2026-06-05days on market $159,900 Active 85 DOM
-
2026-06-03days on market $159,900 Active 84 DOM
-
2026-06-02days on market $159,900 Active 83 DOM
-
2026-06-01days on market $159,900 Active 82 DOM
-
2026-05-31days on market $159,900 Active 81 DOM
-
2026-05-30days on market $159,900 Active 80 DOM
-
2026-05-05price $159,900 192-char remark
Show marketing remark (192 chars)
Three bedroom two bathroom manufactured home with carport and 10x14 shed offered as is. The home a deck on the side, a master bedroom walk in shower. The home sits on a larger triangular lot.
-
2026-03-11$169,000 Active 192-char remark
Show marketing remark (192 chars)
Three bedroom two bathroom manufactured home with carport and 10x14 shed offered as is. The home a deck on the side, a master bedroom walk in shower. The home sits on a larger triangular lot.
-
2010-01-29soldstatus $68,995 121-char remark
Show marketing remark (121 chars)
Great shape still under warranty till 2012. 2 decks, pave driveway with covered carport, large shed, and partially fenced
-
2010-01-01$79,000 121-char remark
Show marketing remark (121 chars)
Great shape still under warranty till 2012. 2 decks, pave driveway with covered carport, large shed, and partially fenced
-
2005-11-28soldstatus $26,000
ⓘ Source: listings_history table (triggers on properties + properties_extension) + one-shot
backfill from property_details.listing_events for pre-trigger history.
Tax reassessment forecast FL · Resets to sale price
- Current annual tax
- $776 · $65/mo
- Projected year-2 tax
- $1,244 · $104/mo
- Expected delta
- +$468/yr (+$39/mo · 60.3%)
ⓘ Screening estimate from a state-policy table — verify with the county assessor before closing.
Climate risk First Street
- Flood 1/10 Low FEMA zone X (unshaded) · 0% chance over 30 yrs
- Wildfire 4/10 Moderate
- Heat 8/10 Severe 7 d/yr ≥107°F today · 20 d/yr by 30 yrs out
- Wind 9/10 Extreme 99% chance of damaging wind over 30 yrs
- Air quality 5/10 Major 7 unhealthy d/yr today · 7 by 30 yrs out
Nearby sold comps map
Loading sold comps map…
Walkable amenities ~0.75 mi
Loading nearby amenities…
Taxation est. · year 1
- Rental income
- $17,504
- − Mortgage interest
- −$8,397
- − Property taxes
- −$776
- − Insurance
- −$750
- − Repairs & maintenance
- −$1,400
- − Management
- −$1,400
- − Depreciation
- −$4,361
- Taxable income
- $420
- Est. tax owed @ 24.0%
- −$101
- After-tax cash flow
- $2,769/yr
For passive investors: Depreciation is non-cash, so a rental often shows a tax loss while cash-flowing — sheltering income. Rental losses are passive: they offset passive income freely, and up to $25,000/yr can offset ordinary (W-2) income if you actively participate and your MAGI is under $100k (phasing out to $0 by $150k); unused losses carry forward. On sale, claimed depreciation is recaptured at up to 25%, and gains may owe capital-gains tax (a 1031 exchange can defer both). Figures are a year-1 estimate at your 24.0% rate — not tax advice; consult a CPA.
Schools (NCES district)
- District
- Gadsden
- NCES district ID
- 1200600
- Math proficiency
- 31% ▼ -16.00%
- Reading proficiency
- 31% ▼ -7.00%
- Median HH income
- $36,470
- Composite
- 25.75/100
- National rank
- #7373
- State rank
- #70 of 73 in FL
Livability — Havana
- Score
- 74/100
- State rank
- #272
- US rank
- #4420
Category grades
Schools grade is shown separately in the Schools card above.
Census & demographics
- Population (ZIP)
- 11,379
Population outlook (Gadsden County) Hauer SSP2
- Today (2025)
- 42,956 people
- By 2030
- 40,878 · -4.8%
- By 2040
- 36,218 · -15.7%
- By 2050
- 31,502 · -26.7%
- By 2075
- 21,828 · -49.2%
- By 2100
- 14,480 · -66.3%
Race, ethnicity, and origin ACS 2023
- Neighborhood character
- Diverse neighborhood (Simpson 0.57)
- Race & ethnicity
- White 54% Black 36% Hispanic / Latino 8% Two or more races 3% Native American 2%
- Hispanic origin (detail)
- Mexican 6%
- Common ancestry
- Italian 3% Slovak 2% Romanian 2%
- Foreign-born
- 3% · Canada
- Languages at home
- 93% English-only · Spanish 6%
Political lean MEDSL · Gadsden
- 2024 margin
- Solid D (+30.7) · D 65.0% · R 34.3%
- 2008→2024 swing
- -8.3pp toward R · 2008: 39.0pp · 2024: 30.7pp
- All cycles
- 2024: D+30.7 2020: D+36.6 2016: D+37.5 2012: D+40.6 2008: D+39.0
Not yet ingested
- Civics
- —
Market trends
- HPI YoY
- ▼ -49.83%
- Current HPI
- 155.9185
- Rent YoY
- —
- Metro
- —
- State GDP YoY
- ▲ 3.28%
- F500 in state
- 36
Industry mix (Fortune 500 HQ in FL)
| Industry | F500 HQs | Revenue |
|---|---|---|
| Industrial Technology | 2 | $29B |
|
||
| Insurance | 2 | $17B |
|
||
| Retail | 1 | $60B |
|
||
| Technology Distribution | 1 | $58B |
|
||
| Homebuilding | 1 | $35B |
|
||
| Technology Manufacturing | 1 | $35B |
|
||
Price history
+515.0% since first listed5 events — show timeline
- 2026-05-05 Price Changed $159,900 CPARMLS
- 2026-03-11 Listed $169,000 CPARMLS
- 2010-01-29 Sold (MLS) $68,995 CATRS
- 2010-01-01 Listed $79,000 CATRS
- 2005-11-28 Sold (Public Records) $26,000 Public Records
Property tax history
+3.7%/yrLatest (2025): $776 · +109.5% YoY. Source: county tax records.
Cash-flow waterfall
monthlySold comps — $/sqft
last 12 mo · ≤1 miLoading sold comps…