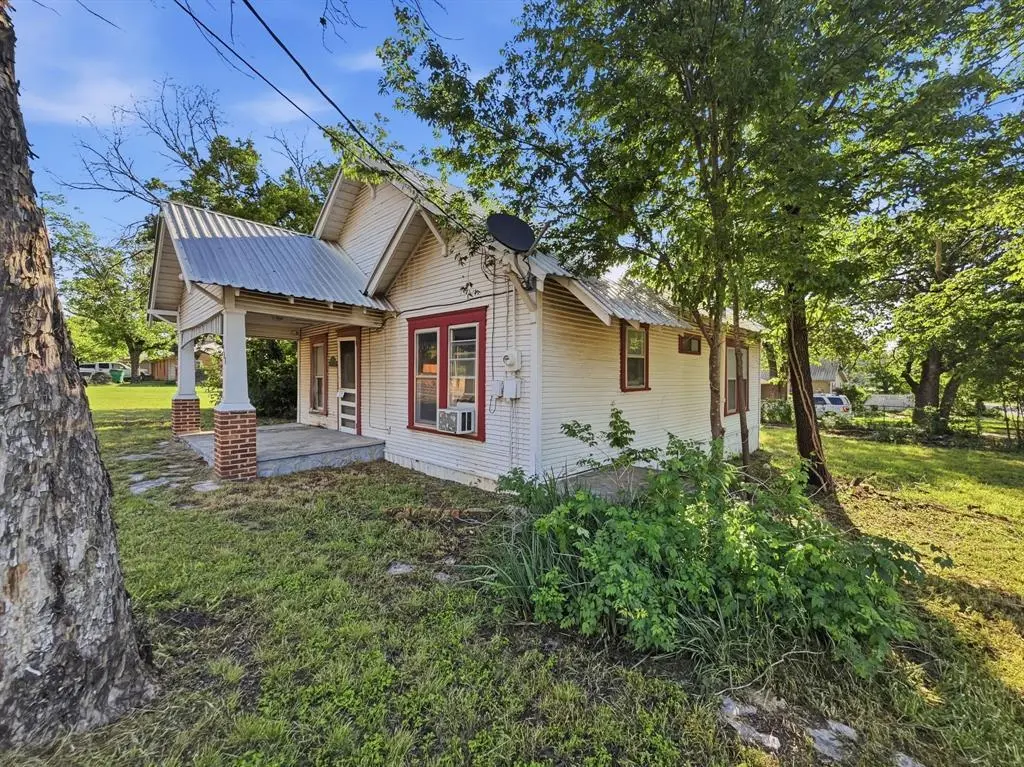
908 S Rice St · Hamilton, TX
Flood risk 1/10 · Minimal
- FEMA flood zone
- —
- Chance of flooding over 30 yrs
- 0.0%
- Est. flood insurance / yr
- —
Fire risk 6/10 · Moderate
- Est. fire insurance / yr
- $1,222 – $2,270
Heat risk 6/10 · Moderate
- Hot days now (above 105°F)
- 6 days/yr
- Hot days in 30 yrs
- 20 days/yr
Wind risk 6/10 · Moderate
- Chance of severe wind over 30 yrs
- 27.0%
Air-quality risk 1/10 · Minimal
- Unhealthy air days now
- 0 days/yr
- Unhealthy air days in 30 yrs
- 0 days/yr
Risk factors via First Street. Map © Google.
Why this score? — see what drove the C+ grade
The composite is a weighted blend of 9 inputs, each scored 0–100. Each bar is that input's sub-score; the figure is the points it added to the 100-point composite (weight × sub-score).
- Cash flow +24.1/30.0
- Appreciation +10.0/10.0
- DSCR +7.8/10.0
- 1% rule +6.6/10.0
- Schools +4.2/10.0
- Livability +3.7/5.0
- ARV discount +2.9/15.0
- Rent growth +2.5/5.0
- Condition / age +2.5/5.0
$120,000
🖨 Deal sheet (PDF) 📄 Offer letter ✓ Due diligence
Listing remarks
COMMERCIAL POTENTIAL WITH HIGHWAY 281 FRONTAGE! Situated on a high-visibility corner lot at 908 S Rice St, this property offers approximately 125 feet of frontage on State Hwy 281. Currently a 1,032 sq. ft. 3 bedroom, 1-bath frame home, the property is being sold as is and is a prime candidate for a full remodel or a commercial conversion. Built in 1945 the home features a durable metal roof, hardwood floors un exiting flooring and a pier-and-beam foundation. The oversized corner lot provides ample space for parking or expansion. Whether you’re looking for a residential fixer-upper with a massive yard or a strategic business location in the heart of Hamilton, this property offers endl
Key facts
- 0.26 acre lot
- Parking
- Built 1945
Property features AI
Finance
- Other: Possession at closing/funding; For sale (active)
- Financial info: Listing terms: Cash or Conventional; Treat as clear loan type; No second mortgage
- HOA & community: No association
Exterior
- Parking: Covered parking (1 space); Carport (1 space); Additional parking available
- Utilities: City water; City sewer; Not in a municipal utility district
- Home design: Single family residence; Residential property; One story; Attached property
- Construction: Metal roof; Pillar/post/pier foundation; Built in 1945
- Exterior features: Accessible approach with ramp; Lot less than 0.5 acre; Subdivision: Hamilton
Interior
- Kitchen: Built-in cabinets
- Bedrooms: 3 bedrooms (all on main level); Primary bedroom approximately 12 x 13 (main level); Second bedroom approximately 12 x 12 (main level); Third bedroom approximately 10 x 15 with walk-in closet (main level)
- Flooring: Linoleum; Wood under carpet
- Bathrooms: 1 full bathroom (main level) with medicine cabinet
- Interior features: Walk-in closet(s); One living area; One dining area; 7 total rooms; One-level home
- Laundry & utility: No appliances included
Neighborhood map
What this means for you Summary
Snapshot
- This is a 3-bed/1.0-bath single-family listed at $120k.
Deal economics
- At list price, monthly cash flow is $238 ($3k/yr) — positive.
- The deal already cash-flows at list — no discount required.
- Meets the 1% rule at list price ($1k rent vs $120k).
- Recommended offer: $116k (3.0% below list) — sets the bar for market timing.
- Cap rate 8.7% vs local median 2.7% in Hamilton — top-decile yield for the area; either an underpriced asset or a hidden risk that comps aren't pricing in. Stress-test before assuming the spread holds.
Location & tenants
- Location reads 73/100 on livability (#210 in TX) — a middle-class / working-renter tenant base. Strengths: cost of living A+, housing A+, health & safety A+; Watch: employment D, amenities F, commute F.
- Hamilton ISD (town): math 50% / reading 50% proficiency, ranked #192 of 826 in TX (top 23%) — acceptable for families but not a draw, mixed tenant base, ~2y average lease.
- Zoned schools: Ann Whitney El (math 42% / reading 42%, grade F, #1,335 of 4,322 statewide, top 33%, 397 students, 60% FRL).
- Market conditions: 117 active listings in the ZIP; 1 comparable units currently listed for rent nearby; 24 units permitted in Hamilton County in 2024 (0 in 5+ unit buildings).
Forward outlook
- In year one you build about $13k of equity ($830 loan paydown + $12k appreciation (10.0% local appreciation)).
- Hamilton County population projected at -21% by 2050 — secular population decline; favor cash flow + early exit over multi-decade hold.
- At projected returns (10.0% appreciation + 3.0% rent growth), your $34k cash investment doubles in ~3 years — after that, you're playing with house money.
- By year 3, paydown + projected appreciation supports a ~$32k cash-out refi (75% LTV) — recoverable capital for the next deal without selling this one.
Negotiation context
- It's been on market 54 days — a 3% lower offer ($116k) is reasonable based on typical stale-listing flexibility.
- 3 sale attempts since 4y ago with the ask held roughly flat each time — persistent listings suggest the price (not the market) is what's stuck; bring a comps-based counter.
Risks & watch-outs
- Watch-outs: built in 1945 — expect roof / HVAC / electrical / plumbing capex.
- Climate carrying-cost: major wind risk, 27% chance of damaging wind over 30y; major wildfire risk; extreme-heat days projected 6→20/yr by 2055 (HVAC capex compounding) — expect insurance premiums to compound above CPI over the hold.
Questions for the listing agent
- It's been on market 54 days. Have you received any prior offers? Is the seller open to a 3% concession, seller financing, or rate buy-down credit?
- Built in 1945 — when were the roof, HVAC, electrical panel, plumbing, and water heater last replaced?
- Is there a deadline driving the sale (1031 exchange, divorce, estate, relocation)? That informs how much negotiation room exists.
- What's the average days-on-market for RENTAL listings here right now (not sales)? A rising rental-DOM trend means longer vacancies and softer asking-rent achievability than the comps imply.
- What's the recent tenant-quality profile in this submarket — average credit score on applications, eviction rate, late-payment / NSF rate, and stable-employment percentage? A property-management company in the area should have these aggregated.
- How much new for-sale + rental construction is in the pipeline within 1–3 miles? Heavy new supply typically softens prices + rents 12–24 months out; constrained supply supports both.
Investment metrics
- 1% rule
- 1.16% ✓
- Cap rate
- 8.67%
- Cash-on-cash
- 8.49%
- DSCR
- 1.38
- GRM
- 7.2
CMA / ARV
- ARV (median comp)
- $108,780
- List price
- $120,000
- Delta
- 10.31%
- Verdict
- OVERPRICED
- Comps
- 20 within 1.0 mi
Show comp detail 3 sales within ~0.75 mi
| Address | Dist | Beds/Ba | Sqft | Sold | Price | $/sf | Match |
|---|---|---|---|---|---|---|---|
| 415 W Grogan St | 0.27mi | 3/2.0 | 1,014 (-2%) | 6mo | $179,000 | $177 | 76 |
| 1206 S Dempster St | 0.31mi | 2/1.0 (-1) | 964 (-7%) | 20mo | $107,000 | $111 | 53 |
| 316 S Price | 0.51mi | 3/2.0 | 1,177 (+14%) | 21mo | $135,000 | $115 | 31 |
Match score weights: distance 35% · size 25% · config 20% · recency 20%. Top-matched comps best support the ARV.
Projected returns pro-forma
10.0% appreciation · 3.0% rent growth · sell at horizon
- IRR
- 30.5%
- Equity multiple
- 3.40×
- Total profit
- $80,532
- Equity at exit
- $108,106
- IRR
- 26.4%
- Equity multiple
- 7.71×
- Total profit
- $225,336
- Equity at exit
- $233,134
Cash invested: $33,600 (down + closing). Projections, not guarantees.
Landlord ↔ Tenant lean methodology
- Overall (STATE)
- 87 Strongly Landlord-Friendly
- State Texas
- 87 Strongly Landlord-Friendly · R+5
- County
- — inherits STATE
- City
- — inherits STATE
ZIP-level market 76531
- Home prices YoY
- 17.5%
- Active inventory
- 117
- Price-to-rent
- 7.2×
Monthly cashflow live
- Estimated rent
- $1,395 medium interval (Pro) →
- Mortgage (P&I)
- −$629
- Tax from tax record
- −$185 /mo · $2,222/yr
- Insurance
- −$50
- HOA
- −$0
- Vacancy / Maint / Mgmt
- −$293
- Net cashflow
- $238
Break-even live
Sensitivity live
| Price | -10% $306 | -5% $272 | +0% $238 | +5% $204 | +10% $170 |
|---|---|---|---|---|---|
| Rent | -10% $127 | -5% $183 | +0% $238 | +5% $293 | +10% $348 |
| Rate | -1.0pp $298 | -0.5pp $268 | base $238 | +0.5pp $207 | +1.0pp $175 |
UW: 25.0% down · 7.5% · 30yr · 1.5% tax · 5.0% vac · 8.0% maint · 8.0% mgmt
Financing live
Cash to close
- Down payment
- $30,000
- Closing costs
- $3,600
- Reserves months
- —
- Total cash needed
- —
Loan-product check · same deal, 3 products live
Conventional
25% down · 7.5% · 30yr
- Down + closing
- —
- Monthly P&I
- —
- Monthly cashflow
- —
- DSCR
- —
- Eligible?
- —
Personal DTI + credit; lowest rate.
DSCR
20% down · 8.5% · 30yr
- Down + closing
- —
- Monthly P&I
- —
- Monthly cashflow
- —
- DSCR
- —
- Eligible?
- —
No personal income docs; deal must DSCR.
Hard money
10% down · 12.0% · 12mo
- Down + closing
- —
- Monthly P&I
- —
- Monthly cashflow
- —
- DSCR
- —
- Eligible?
- —
Short-term bridge; refi at stabilization.
Rent comps 1 comps
| Address | Beds | Baths | Sqft | Rent | $/sqft | DOM | Units | Dist |
|---|---|---|---|---|---|---|---|---|
| 1115 E Ross St Hamilton, TX | 3.0 | 2.0 | 1341 | $1,395 | $1.04 | 14d | 1 | 1.13mi |
Listing history 21 events
-
2026-06-21days on market $120,000 Active 54 DOM
-
2026-06-18days on market $120,000 Active 52 DOM
-
2026-06-17days on market $120,000 Active 51 DOM
-
2026-06-16days on market $120,000 Active 50 DOM
-
2026-06-15days on market $120,000 Active 49 DOM
-
2026-06-13days on market $120,000 Active 47 DOM
-
2026-06-12days on market $120,000 Active 46 DOM
-
2026-06-09days on market $120,000 Active 43 DOM
-
2026-06-08days on market $120,000 Active 42 DOM
-
2026-06-08days on market $120,000 Active 41 DOM
-
2026-06-05days on market $120,000 Active 39 DOM
-
2026-06-03days on market $120,000 Active 37 DOM
-
2026-06-02days on market $120,000 Active 36 DOM
-
2026-06-01days on market $120,000 Active 35 DOM
-
2026-05-31days on market $120,000 Active 34 DOM
-
2026-04-27$120,000 Active 792-char remark
-
2023-05-31historical
-
2022-12-01status Active
-
2022-11-02historical
-
2022-05-03$199,000 Active
-
2013-10-07soldstatus
ⓘ Source: listings_history table (triggers on properties + properties_extension) + one-shot
backfill from property_details.listing_events for pre-trigger history.
Tax reassessment forecast TX · Resets to sale price
- Current annual tax
- $2,222 · $185/mo
- Projected year-2 tax
- $2,222 · $185/mo
- Expected delta
- $0/yr ($0/mo · 0.0%)
ⓘ Screening estimate from a state-policy table — verify with the county assessor before closing.
Climate risk First Street
- Flood 1/10 Low 0% chance over 30 yrs
- Wildfire 6/10 Major
- Heat 6/10 Major 6 d/yr ≥105°F today · 20 d/yr by 30 yrs out
- Wind 6/10 Major 27% chance of damaging wind over 30 yrs
- Air quality 1/10 Low 0 unhealthy d/yr today · 0 by 30 yrs out
Nearby sold comps map
Loading sold comps map…
Walkable amenities ~0.75 mi
Loading nearby amenities…
Taxation est. · year 1
- Rental income
- $16,740
- − Mortgage interest
- −$6,722
- − Property taxes
- −$2,222
- − Insurance
- −$600
- − Repairs & maintenance
- −$1,339
- − Management
- −$1,339
- − Depreciation
- −$3,491
- Taxable income
- $1,027
- Est. tax owed @ 24.0%
- −$247
- After-tax cash flow
- $2,605/yr
For passive investors: Depreciation is non-cash, so a rental often shows a tax loss while cash-flowing — sheltering income. Rental losses are passive: they offset passive income freely, and up to $25,000/yr can offset ordinary (W-2) income if you actively participate and your MAGI is under $100k (phasing out to $0 by $150k); unused losses carry forward. On sale, claimed depreciation is recaptured at up to 25%, and gains may owe capital-gains tax (a 1031 exchange can defer both). Figures are a year-1 estimate at your 24.0% rate — not tax advice; consult a CPA.
Schools (NCES district)
- District
- Hamilton ISD
- NCES district ID
- 4822230
- Math proficiency
- 50% ▲ 1.00%
- Reading proficiency
- 50% ▼ -1.00%
- Median HH income
- $43,597
- Composite
- 42.18/100
- National rank
- #3293
- State rank
- #192 of 826 in TX
Livability — Hamilton
- Score
- 73/100
- State rank
- #210
- US rank
- #5259
Category grades
Schools grade is shown separately in the Schools card above.
Census & demographics
- Census place
- Hamilton, TX
- Population (ZIP)
- 4,673
Population outlook (Hamilton County) Hauer SSP2
- Today (2025)
- 7,553 people
- By 2030
- 7,212 · -4.5%
- By 2040
- 6,566 · -13.1%
- By 2050
- 5,976 · -20.9%
- By 2075
- 5,077 · -32.8%
- By 2100
- 4,196 · -44.4%
Race, ethnicity, and origin ACS 2023
- Neighborhood character
- Predominantly White (84%)
- Race & ethnicity
- White 84% Hispanic / Latino 13% Two or more races 11% Black 1%
- Hispanic origin (detail)
- Mexican 12%
- Common ancestry
- Italian 9% Lithuanian 3% Slovak 2%
- Foreign-born
- 5% · Canada
- Languages at home
- 90% English-only · Spanish 9% Russian/Polish/Slavic 1%
Political lean MEDSL · Hamilton
- 2024 margin
- Solid R (+71.3) · D 14.0% · R 85.3%
- 2008→2024 swing
- -18.0pp toward R · 2008: -53.3pp · 2024: -71.3pp
- All cycles
- 2024: R+71.3 2020: R+68.4 2016: R+71.4 2012: R+65.5 2008: R+53.3
Not yet ingested
- Civics
- —
Market trends
- HPI YoY
- ▲ 33.83%
- Current HPI
- 226.8273
- Rent YoY
- —
- Metro
- —
- State GDP YoY
- ▲ 3.95%
- F500 in state
- 110
Industry mix (Fortune 500 HQ in TX)
| Industry | F500 HQs | Revenue |
|---|---|---|
| Energy | 16 | $1,198B |
|
||
| Technology | 5 | $198B |
|
||
| Engineering / Construction | 4 | $72B |
|
||
| Energy Services | 3 | $60B |
|
||
| Utilities | 3 | $41B |
|
||
| Healthcare | 2 | $330B |
|
||
Price history
-39.7% since first listed6 events — show timeline
- 2026-04-27 Listed $120,000 NTREIS
- 2023-05-31 Listing Removed — NTREIS
- 2022-12-01 Relisted — NTREIS
- 2022-11-02 Listing Removed — NTREIS
- 2022-05-03 Listed $199,000 NTREIS
- 2013-10-07 Sold (Public Records) — Public Records
Property tax history
+9.2%/yrLatest (2025): $2,222 · +13.3% YoY. Source: county tax records.
Cash-flow waterfall
monthlySold comps — $/sqft
last 12 mo · ≤1 miLoading sold comps…