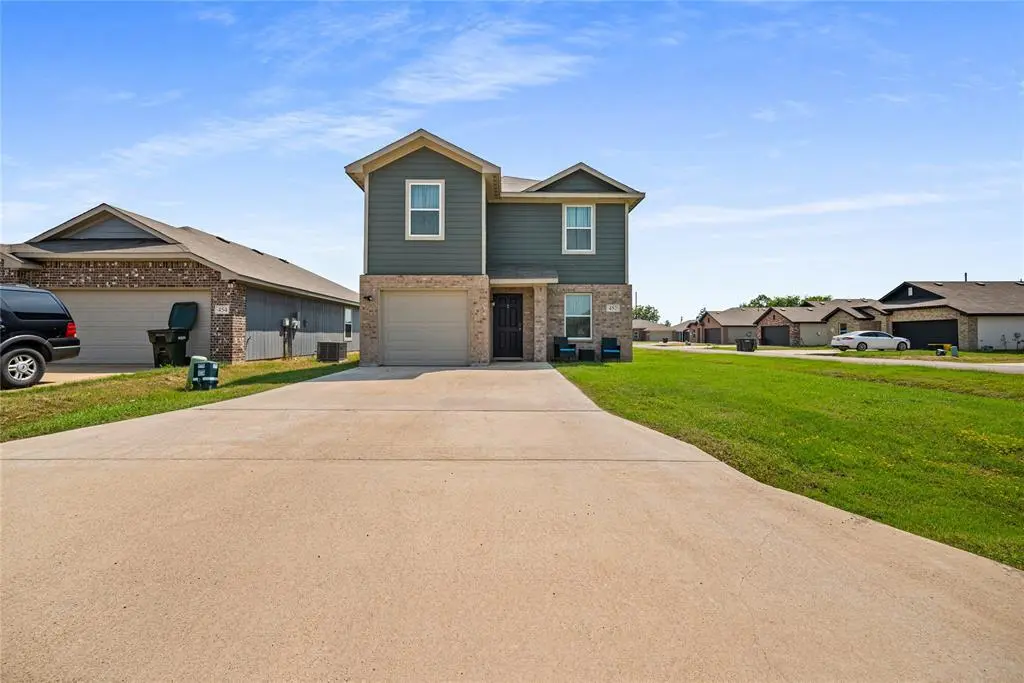
452 Bobbie St · Mabank, TX
Flood risk 1/10 · Minimal
- FEMA flood zone
- X (unshaded)
- Chance of flooding over 30 yrs
- 0.0%
- Est. flood insurance / yr
- $507 – $1,088
Fire risk 4/10 · Minor
- Est. fire insurance / yr
- $1,222 – $2,270
Heat risk 7/10 · Major
- Hot days now (above 110°F)
- 7 days/yr
- Hot days in 30 yrs
- 25 days/yr
Wind risk 6/10 · Moderate
- Chance of severe wind over 30 yrs
- 62.0%
Air-quality risk 2/10 · Minimal
- Unhealthy air days now
- 0 days/yr
- Unhealthy air days in 30 yrs
- 1 days/yr
Risk factors via First Street. Map © Google.
Why this score? — see what drove the C- grade
The composite is a weighted blend of 9 inputs, each scored 0–100. Each bar is that input's sub-score; the figure is the points it added to the 100-point composite (weight × sub-score).
- ARV discount +15.0/15.0
- Appreciation +10.0/10.0
- Cash flow +8.0/30.0
- Rent growth +4.5/5.0
- Condition / age +4.0/5.0
- Schools +3.8/10.0
- Livability +3.5/5.0
- 1% rule +2.9/10.0
- DSCR +2.1/10.0
$218,900
🖨 Deal sheet (PDF) 📄 Offer letter ✓ Due diligence
Listing remarks MLS
Welcome home to modern comfort in Mabank, TX! Built in 2023, this like-new two-story home features 3 bedrooms, 2.5 bathrooms, and approximately 1,300 sq ft of thoughtfully designed space. The open-concept layout connects the living, dining, and kitchen areas for an easy flow that suits everyday life. The kitchen includes modern cabinetry, stainless-steel appliances, and durable finishes, offering both style and function. Upstairs, all three bedrooms provide privacy and comfort, including a primary suite with ensuite bath and walk-in closet. Located on a spacious corner lot, this home offers great curb appeal and room to enjoy the outdoors. Just minutes from Cedar Creek Lake, local schools, shopping, and Hwy 175, it blends modern design with small-town charm — move-in ready and waiting for its next chapter.
Key facts
- Great curb appeal
- Modern cabinetry
- Walk-in closet
Tags
Neighborhood map
What this means for you Summary
Snapshot
- This is a 3-bed/2.5-bath single-family listed at $219k. Condition is rated good.
Deal economics
- At list price, monthly cash flow is $-219 ($-3k/yr) — negative.
- To cash-flow at today's rent, offer at most $180k (17.7% below list).
- To meet the 1% rule (rent ≥ 1% of price), the offer needs to be $172k (21.3% below list).
- Recommended offer: $172k (21.3% below list) — sets the bar for 1% rule.
- Cap rate 5.1% vs local median 3.1% in Mabank — top-decile yield for the area; either an underpriced asset or a hidden risk that comps aren't pricing in. Stress-test before assuming the spread holds.
Location & tenants
- Location reads 69/100 on livability (#446 in TX) — a middle-class / working-renter tenant base. Strengths: cost of living A+, housing A+, crime B+; Watch: amenities F, commute F, employment D-.
- Mabank ISD (town): math 47% / reading 44% proficiency, ranked #273 of 826 in TX (top 33%) — families likely to look elsewhere, expect single-tenant / working-renter base with shorter leases.
- Market conditions: Rents rising fast (+8.1%/yr); 214 active listings in the ZIP; 10 comparable units currently listed for rent nearby; rentals lingering (median 45d on market — plan ~5-8 weeks vacancy on turnover, expect pricing pressure); 90% of comp listings sitting > 30 days — soft ceiling on asking rent; 1,747 units permitted in Kaufman County in 2024 (180 in 5+ unit buildings).
- This rent runs 36% of the median local income ($57k/yr) — at the standard rent-burdened threshold; future hikes will face affordability resistance.
Forward outlook
- In year one you build about $23k of equity ($2k loan paydown + $22k appreciation (10.0% local appreciation)).
- Kaufman County population projected at +43% by 2050 — long-run rental-demand tailwind backs the buy-and-hold thesis.
- By year 2, paydown + projected appreciation supports a ~$38k cash-out refi (75% LTV) — recoverable capital for the next deal without selling this one.
Negotiation context
- It's been on market 99 days — a 9% lower offer ($199k) is reasonable based on typical stale-listing flexibility.
- 4 sale attempts since 3y ago with the ask held roughly flat each time — persistent listings suggest the price (not the market) is what's stuck; bring a comps-based counter.
Risks & watch-outs
- Climate carrying-cost: major wind risk, 62% chance of damaging wind over 30y; extreme-heat days projected 7→25/yr by 2055 (HVAC capex compounding) — expect insurance premiums to compound above CPI over the hold.
Questions for the listing agent
- What do current leases actually rent for vs. the listed asking? Can we see a recent rent roll and the last 12 months of T-12 income?
- It's been on market 99 days. Have you received any prior offers? Is the seller open to a 21% concession, seller financing, or rate buy-down credit?
- Why hasn't it sold? Are there any deal-killer items the seller is aware of (foundation, flood, title, zoning, code violations)?
- Is there a deadline driving the sale (1031 exchange, divorce, estate, relocation)? That informs how much negotiation room exists.
- What's the average days-on-market for RENTAL listings here right now (not sales)? A rising rental-DOM trend means longer vacancies and softer asking-rent achievability than the comps imply.
- What's the recent tenant-quality profile in this submarket — average credit score on applications, eviction rate, late-payment / NSF rate, and stable-employment percentage? A property-management company in the area should have these aggregated.
- How much new for-sale + rental construction is in the pipeline within 1–3 miles? Heavy new supply typically softens prices + rents 12–24 months out; constrained supply supports both.
Investment metrics
- 1% rule
- 0.79% ✗
- Cap rate
- 5.09%
- Cash-on-cash
- -4.30%
- DSCR
- 0.81
- GRM
- 10.6
CMA / ARV
- ARV (median comp)
- $270,454
- List price
- $218,900
- Delta
- -19.06%
- Verdict
- UNDERPRICED
- Comps
- 20 within 1.0 mi
Show comp detail 12 sales within ~0.75 mi
| Address | Dist | Beds/Ba | Sqft | Sold | Price | $/sf | Match |
|---|---|---|---|---|---|---|---|
| 220 E Glenwood St | 0.17mi | 3/2.0 | 1,345 (+3%) | 6mo | $190,000 | $141 | 81 |
| 116 Mcanally Dr | 0.47mi | 3/1.5 | 1,316 (+0%) | 6mo | $189,000 | $144 | 69 |
| 115 Mcanally Dr | 0.52mi | 3/1.5 | 1,288 (-2%) | 2mo | $160,000 | $124 | 68 |
| 306 E Pine St | 0.13mi | 3/2.0 | 1,477 (+13%) | 7mo | $319,000 | $216 | 65 |
| 212 E Pine St | 0.16mi | 3/2.0 | 1,448 (+10%) | 12mo | $257,500 | $178 | 62 |
| 108 E Eubank St | 0.43mi | 2/1.0 (-1) | 1,295 (-1%) | 8mo | $100,000 | $77 | 61 |
| 106 Mcanally Dr | 0.53mi | 4/1.5 (+1) | 1,316 (+0%) | 11mo | $194,500 | $148 | 56 |
| 205 N Canton St | 0.67mi | 4/3.0 (+1) | 1,321 (+1%) | 11mo | $265,000 | $201 | 51 |
| 111 Bexar St | 0.58mi | 2/1.5 (-1) | 1,401 (+7%) | 4mo | $289,900 | $207 | 49 |
| 211 W Mcafee Dr | 0.70mi | 3/2.0 | 1,438 (+10%) | 2mo | $209,000 | $145 | 47 |
| 221 N 1st St | 0.67mi | 3/2.0 | 1,466 (+12%) | 7mo | $185,000 | $126 | 41 |
| 204 W Mount Vernon St | 0.73mi | 2/1.5 (-1) | 1,440 (+10%) | 8mo | $114,000 | $79 | 34 |
Match score weights: distance 35% · size 25% · config 20% · recency 20%. Top-matched comps best support the ARV.
Projected returns pro-forma
10.0% appreciation · 8.0% rent growth · sell at horizon
- IRR
- 22.8%
- Equity multiple
- 2.87×
- Total profit
- $114,411
- Equity at exit
- $197,202
- IRR
- 21.7%
- Equity multiple
- 7.05×
- Total profit
- $370,590
- Equity at exit
- $425,275
Cash invested: $61,292 (down + closing). Projections, not guarantees.
Landlord ↔ Tenant lean methodology
- Overall (STATE)
- 87 Strongly Landlord-Friendly
- State Texas
- 87 Strongly Landlord-Friendly · R+5
- County
- — inherits STATE
- City
- — inherits STATE
ZIP-level market 75147
- Home prices YoY
- 4.6%
- Rents YoY
- 8.1%
- Active inventory
- 214
- Price-to-rent
- 10.6×
Monthly cashflow live
- Estimated rent
- $1,722 high interval (Pro) →
- Mortgage (P&I)
- −$1,148
- Tax from tax record
- −$341 /mo · $4,087/yr
- Insurance
- −$91
- HOA
- −$0
- Vacancy / Maint / Mgmt
- −$362
- Net cashflow
- $-219
Break-even live
Sensitivity live
| Price | -10% $-95 | -5% $-157 | +0% $-219 | +5% $-281 | +10% $-343 |
|---|---|---|---|---|---|
| Rent | -10% $-355 | -5% $-287 | +0% $-219 | +5% $-151 | +10% $-83 |
| Rate | -1.0pp $-109 | -0.5pp $-164 | base $-219 | +0.5pp $-276 | +1.0pp $-334 |
UW: 25.0% down · 7.5% · 30yr · 1.5% tax · 5.0% vac · 8.0% maint · 8.0% mgmt
Financing live
Cash to close
- Down payment
- $54,725
- Closing costs
- $6,567
- Reserves months
- —
- Total cash needed
- —
Loan-product check · same deal, 3 products live
Conventional
25% down · 7.5% · 30yr
- Down + closing
- —
- Monthly P&I
- —
- Monthly cashflow
- —
- DSCR
- —
- Eligible?
- —
Personal DTI + credit; lowest rate.
DSCR
20% down · 8.5% · 30yr
- Down + closing
- —
- Monthly P&I
- —
- Monthly cashflow
- —
- DSCR
- —
- Eligible?
- —
No personal income docs; deal must DSCR.
Hard money
10% down · 12.0% · 12mo
- Down + closing
- —
- Monthly P&I
- —
- Monthly cashflow
- —
- DSCR
- —
- Eligible?
- —
Short-term bridge; refi at stabilization.
Rent comps 10 comps
| Address | Beds | Baths | Sqft | Rent | $/sqft | DOM | Units | Dist |
|---|---|---|---|---|---|---|---|---|
| 813 S Sutton St Mabank, TX | 3.0 | 2.0 | 1197 | $1,399 | $1.17 | 44d | 1 | 0.06mi |
| 425 Shorty St Mabank, TX | 4.0 | 2.0 | 1788 | $1,614 | $0.90 | 44d | 1 | 0.06mi |
| 414 Shorty St Mabank, TX | 3.0 | 2.0 | 1405 | $1,564 | $1.11 | 44d | 1 | 0.07mi |
| 427 Shorty St Mabank, TX | 3.0 | 2.0 | 1571 | $1,664 | $1.06 | 44d | 1 | 0.07mi |
| 429 Shorty St Mabank, TX | 3.0 | 2.0 | 1405 | $1,499 | $1.07 | 44d | 1 | 0.08mi |
| 471 Bobbie St Mabank, TX | 3.0 | 2.0 | 1571 | $1,664 | $1.06 | 44d | 1 | 0.09mi |
| 433 Shorty St Mabank, TX | 3.0 | 2.0 | 1571 | $1,664 | $1.06 | 44d | 1 | 0.10mi |
| 430 Shorty St Mabank, TX | 3.0 | 2.0 | 1571 | $1,614 | $1.03 | 44d | 1 | 0.10mi |
| 101 Pharm Hls Unit 1303 Mabank, TX | 2.0 | 2.0 | 1041 | $1,064 | $1.02 | 44d | 1 | 0.99mi |
| 112 Spring Crest St Mabank, TX | 3.0–4.0 | 2.0 | 1750 | $1,749 | $1.00 | 2d | 1 | 1.13mi |
Listing history 32 events
-
2026-06-19days on market $218,900 Active 99 DOM
-
2026-06-18days on market $218,900 Active 98 DOM
-
2026-06-17days on market $218,900 Active 97 DOM
-
2026-06-16days on market $218,900 Active 96 DOM
-
2026-06-15days on market $218,900 Active 95 DOM
-
2026-06-14days on market $218,900 Active 93 DOM
-
2026-06-12days on market $218,900 Active 92 DOM
-
2026-06-09days on market $218,900 Active 89 DOM
-
2026-06-08days on market $218,900 Active 88 DOM
-
2026-06-07days on market $218,900 Active 87 DOM
-
2026-06-05days on market $218,900 Active 84 DOM
-
2026-06-03days on market $218,900 Active 83 DOM
-
2026-06-02days on market $218,900 Active 82 DOM
-
2026-06-01days on market $218,900 Active 81 DOM
-
2026-05-31days on market $218,900 Active 80 DOM
-
2026-05-30days on market $218,900 Active 79 DOM
-
2026-03-12historical
Show marketing remark (826 chars)
Welcome home to modern comfort in Mabank, TX! Built in 2023, this like-new two-story home features 3 bedrooms, 2.5 bathrooms, and approximately 1,300 sq ft of thoughtfully designed space. The open-concept layout connects the living, dining, and kitchen areas for an easy flow that suits everyday life. The kitchen includes modern cabinetry, stainless-steel appliances, and durable finishes, offering both style and function. Upstairs, all three bedrooms provide privacy and comfort, including a primary suite with ensuite bath and walk-in closet. Located on a spacious corner lot, this home offers great curb appeal and room to enjoy the outdoors. Just minutes from Cedar Creek Lake, local schools, shopping, and Hwy 175, it blends modern design with small-town charm — move-in ready and waiting for its next chapter.
-
2026-03-12$218,900 Active 826-char remark
Show marketing remark (826 chars)
Welcome home to modern comfort in Mabank, TX! Built in 2023, this like-new two-story home features 3 bedrooms, 2.5 bathrooms, and approximately 1,300 sq ft of thoughtfully designed space. The open-concept layout connects the living, dining, and kitchen areas for an easy flow that suits everyday life. The kitchen includes modern cabinetry, stainless-steel appliances, and durable finishes, offering both style and function. Upstairs, all three bedrooms provide privacy and comfort, including a primary suite with ensuite bath and walk-in closet. Located on a spacious corner lot, this home offers great curb appeal and room to enjoy the outdoors. Just minutes from Cedar Creek Lake, local schools, shopping, and Hwy 175, it blends modern design with small-town charm — move-in ready and waiting for its next chapter.
-
2026-03-09price $218,900
-
2026-03-09price $118,900
-
2026-01-13price $225,000
-
2025-09-29price $235,000
-
2025-09-20price $240,000
-
2025-09-06$244,000 Active
-
2023-05-24soldstatus Closed
-
2023-05-02status Pending
-
2023-04-24historical Active Option Contract
-
2023-04-15price $214,990
-
2023-04-03status Active
-
2023-03-28historical Active Option Contract
-
2023-03-16price $219,990
-
2023-02-14$224,990 Active
ⓘ Source: listings_history table (triggers on properties + properties_extension) + one-shot
backfill from property_details.listing_events for pre-trigger history.
Tax reassessment forecast TX · Resets to sale price
- Current annual tax
- $4,087 · $341/mo
- Projected year-2 tax
- $4,087 · $341/mo
- Expected delta
- $0/yr ($0/mo · 0.0%)
ⓘ Screening estimate from a state-policy table — verify with the county assessor before closing.
Climate risk First Street
- Flood 1/10 Low FEMA zone X (unshaded) · 0% chance over 30 yrs
- Wildfire 4/10 Moderate
- Heat 7/10 Severe 7 d/yr ≥110°F today · 25 d/yr by 30 yrs out
- Wind 6/10 Major 62% chance of damaging wind over 30 yrs
- Air quality 2/10 Low 0 unhealthy d/yr today · 1 by 30 yrs out
Nearby sold comps map
Loading sold comps map…
Walkable amenities ~0.75 mi
Loading nearby amenities…
Taxation est. · year 1
- Rental income
- $20,663
- − Mortgage interest
- −$12,262
- − Property taxes
- −$4,087
- − Insurance
- −$1,094
- − Repairs & maintenance
- −$1,653
- − Management
- −$1,653
- − Depreciation
- −$6,368
- Taxable loss
- −$6,454
- Est. tax savings @ 24.0%
- +$1,549
- After-tax cash flow
- $-1,084/yr
For passive investors: Depreciation is non-cash, so a rental often shows a tax loss while cash-flowing — sheltering income. Rental losses are passive: they offset passive income freely, and up to $25,000/yr can offset ordinary (W-2) income if you actively participate and your MAGI is under $100k (phasing out to $0 by $150k); unused losses carry forward. On sale, claimed depreciation is recaptured at up to 25%, and gains may owe capital-gains tax (a 1031 exchange can defer both). Figures are a year-1 estimate at your 24.0% rate — not tax advice; consult a CPA.
Condition & rehab AI · 12 photos
This modern, two-story home in Mabank, TX, built in 2023, is in excellent condition with no visible repairs needed. It offers a spacious layout, modern finishes, and a well-maintained exterior, making it a great investment opportunity.
Value-add opportunities
- Both Painting exterior and interior walls — Enhances curb appeal and interior aesthetics.
- Both Landscaping improvements — Enhances curb appeal and adds value.
- Resale Kitchen appliances maintenance — Keeps appliances in top condition for potential buyers.
- Resale Bathroom fixtures maintenance — Keeps bathrooms in top condition for potential buyers.
Renovation cost estimate screening
Value-add ROI direction
- Both Painting exterior and interior walls — Enhances curb appeal and interior aesthetics. ↑
- Both Landscaping improvements — Enhances curb appeal and adds value. ↑
- Resale Kitchen appliances maintenance — Keeps appliances in top condition for potential buyers. ↑
- Resale Bathroom fixtures maintenance — Keeps bathrooms in top condition for potential buyers. ↑
ⓘ Cost ranges are severity-bucket heuristics (US national rule-of-thumb). Get contractor quotes + a written scope before underwriting a rehab budget.
Schools (NCES district)
- District
- Mabank ISD
- NCES district ID
- 4828680
- Math proficiency
- 47% ▼ -19.00%
- Reading proficiency
- 44% ▼ -11.00%
- Median HH income
- $40,321
- Composite
- 38.15/100
- National rank
- #4267
- State rank
- #273 of 826 in TX
Livability — Mabank
- Score
- 69/100
- State rank
- #446
- US rank
- #9068
Category grades
Schools grade is shown separately in the Schools card above.
Census & demographics
- Census place
- Mabank, TX
- County
- Van Zandt County · 9,177 people
- Metro
- Dallas-Fort Worth-Arlington, TX
- Population (ZIP)
- 9,177
- Household income
- $56,940
- Rent vs Own
- Severe rent burden
- 279.0
Population outlook (Kaufman County) Hauer SSP2
- Today (2025)
- 138,716 people
- By 2030
- 150,815 · +8.7%
- By 2040
- 174,877 · +26.1%
- By 2050
- 198,020 · +42.8%
- By 2075
- 251,908 · +81.6%
- By 2100
- 285,325 · +105.7%
Race, ethnicity, and origin ACS 2023
- Neighborhood character
- Predominantly White (86%)
- Race & ethnicity
- White 86% Hispanic / Latino 10% Two or more races 8% Black 2%
- Hispanic origin (detail)
- Mexican 10%
- Common ancestry
- Lithuanian 2% Serbian 2% Romanian 1%
- Foreign-born
- 2% · Canada
- Languages at home
- 95% English-only · Spanish 4%
Political lean MEDSL · Kaufman
- 2024 margin
- Strong R (+27.9) · D 35.6% · R 63.5%
- 2008→2024 swing
- +7.9pp toward D · 2008: -35.8pp · 2024: -27.9pp
- All cycles
- 2024: R+27.9 2020: R+33.9 2016: R+47.0 2012: R+44.4 2008: R+35.8
Not yet ingested
- Civics
- —
Market trends
- HPI YoY
- ▲ 11.14%
- Current HPI
- 254.32
- Rent YoY
- ▲ 8.13%
- Metro
- Dallas-Fort Worth-Arlington, TX
- State GDP YoY
- ▲ 3.95%
- F500 in state
- 110
Industry mix (Fortune 500 HQ in TX)
| Industry | F500 HQs | Revenue |
|---|---|---|
| Energy | 16 | $1,198B |
|
||
| Technology | 5 | $198B |
|
||
| Engineering / Construction | 4 | $72B |
|
||
| Energy Services | 3 | $60B |
|
||
| Utilities | 3 | $41B |
|
||
| Healthcare | 2 | $330B |
|
||
Price history
-2.7% since first listed16 events — show timeline
- 2026-03-12 Listed $218,900 NTREIS
- 2026-03-12 Listing Removed — NTREIS
- 2026-03-09 Price Changed $218,900 NTREIS
- 2026-03-09 Price Changed $118,900 NTREIS
- 2026-01-13 Price Changed $225,000 NTREIS
- 2025-09-29 Price Changed $235,000 NTREIS
- 2025-09-20 Price Changed $240,000 NTREIS
- 2025-09-06 Listed $244,000 NTREIS
- 2023-05-24 Sold (MLS) — NTREIS
- 2023-05-02 Pending — NTREIS
- 2023-04-24 Contingent — NTREIS
- 2023-04-15 Price Changed $214,990 NTREIS
- 2023-04-03 Relisted — NTREIS
- 2023-03-28 Contingent — NTREIS
- 2023-03-16 Price Changed $219,990 NTREIS
- 2023-02-14 Listed $224,990 NTREIS
Property tax history
+88.5%/yrLatest (2025): $4,087 · +1.8% YoY. Source: county tax records.
Cash-flow waterfall
monthlySold comps — $/sqft
last 12 mo · ≤1 miLoading sold comps…