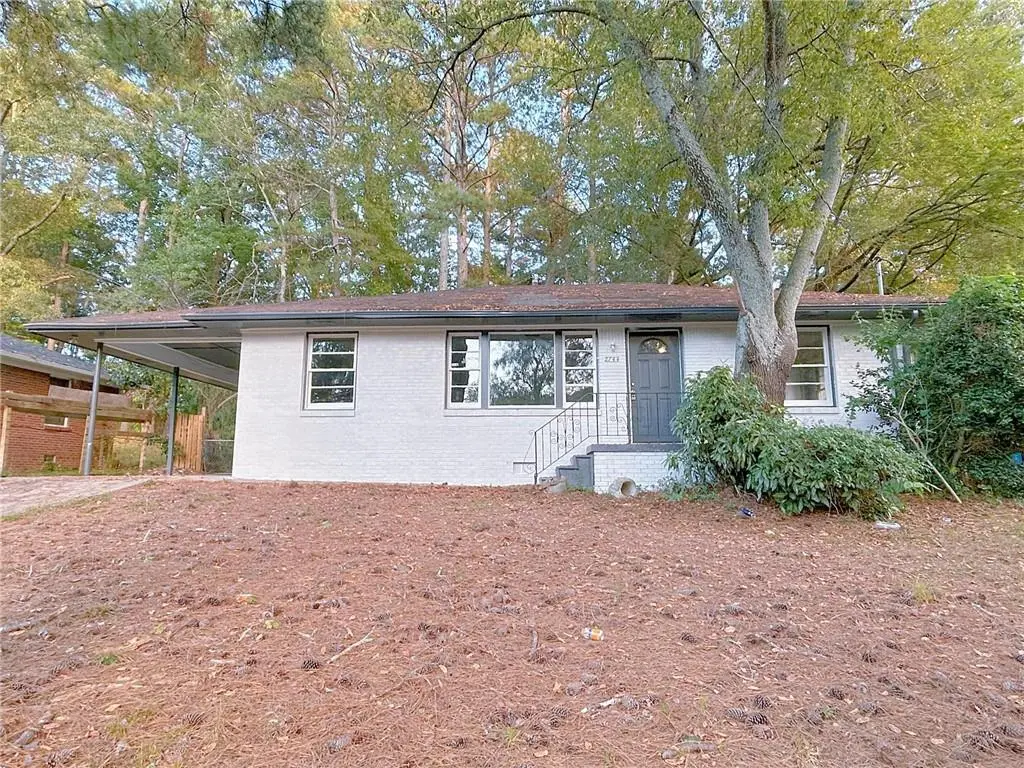
2744 Fairlane Dr SE · Atlanta, GA
Flood risk 1/10 · Minimal
- FEMA flood zone
- X (unshaded)
- Chance of flooding over 30 yrs
- 0.0%
- Est. flood insurance / yr
- $473 – $860
Fire risk 3/10 · Minor
- Est. fire insurance / yr
- $963 – $1,789
Heat risk 6/10 · Moderate
- Hot days now (above 104°F)
- 7 days/yr
- Hot days in 30 yrs
- 18 days/yr
Wind risk 5/10 · Moderate
- Chance of severe wind over 30 yrs
- 26.0%
Air-quality risk 4/10 · Minor
- Unhealthy air days now
- 4 days/yr
- Unhealthy air days in 30 yrs
- 6 days/yr
Risk factors via First Street. Map © Google.
Why this score? — see what drove the B- grade
The composite is a weighted blend of 9 inputs, each scored 0–100. Each bar is that input's sub-score; the figure is the points it added to the 100-point composite (weight × sub-score).
- Cash flow +25.4/30.0
- ARV discount +15.0/15.0
- DSCR +8.4/10.0
- 1% rule +6.9/10.0
- Livability +4.2/5.0
- Rent growth +3.9/5.0
- Schools +2.7/10.0
- Condition / age +2.5/5.0
- Appreciation +0.0/10.0
$162,500
🖨 Deal sheet (PDF) 📄 Offer letter ✓ Due diligence
Listing remarks MLS
Brand Bathroom and New LVP Through out the house Fully refreshed and move-in ready! This charming home features brand-new flooring, fresh interior paint, and a modern double vanity in the bathroom for a sleek, updated look. Enjoy a bright, open layout that's perfect for everyday living and entertaining. Conveniently located near downtown Atlanta and major highways, this property offers both comfort and accessibility-whether you're a first-time buyer or investor.
Key facts
- New flooring
- Modern double vanity
- Open layout
Tags
Neighborhood map
What this means for you Summary
Snapshot
- This is a 3-bed/1.0-bath single-family listed at $162k.
Deal economics
- At list price, monthly cash flow is $374 ($4k/yr) — positive.
- The deal already cash-flows at list — no discount required.
- Meets the 1% rule at list price ($2k rent vs $162k).
- Recommended offer: $148k (9.0% below list) — sets the bar for market timing.
- Cap rate 9.1% vs local median 3.1% in Atlanta — top-decile yield for the area; either an underpriced asset or a hidden risk that comps aren't pricing in. Stress-test before assuming the spread holds.
Location & tenants
- Location reads 83/100 on livability (#6 in GA, #919 nationally) — a professional / high-income tenant draw. Strengths: amenities A+, commute A+, housing A+; Watch: cost of living C-.
- Atlanta Public Schools (urban): math 28% / reading 35% proficiency, ranked #80 of 174 in GA (top 46%) — families likely to look elsewhere, expect single-tenant / working-renter base with shorter leases; 71% free/reduced lunch — lower-income household profile, screen leases tightly.
- Zoned schools: Kipp Ways Primary Charter School (math 5% / reading 5%, grade F, #1,160 of 1,228 statewide, top 98%, 477 students, 100% FRL, charter); Crawford Long Middle School (math 2% / reading 8%, grade F, #462 of 470 statewide, top 99%, 705 students, 100% FRL) — zoned schools average 100% FRL vs 71% district-wide (29 pts higher); higher-poverty schools than district average — tighter screening recommended.
- Zoned-school proficiency averages 5% at this address vs 32% district-wide (-26 pts) — the specific schools serving this property underperform the Atlanta Public Schools average; the district grade overstates school quality for this exact location.
- Market conditions: Rents rising fast (+5.5%/yr); 179 active listings in the ZIP; 38 comparable units currently listed for rent nearby; rentals at typical pace (median 22d on market — plan ~3-4 weeks tenant-placement turnaround); 11,565 units permitted in Fulton County in 2024 (8,159 in 5+ unit buildings).
Forward outlook
- Local home prices are declining (-3.0%/yr); year-one equity from $1k of loan paydown is wiped out by about $5k of value loss. Plan a longer hold.
- Fulton County population projected at +38% by 2050 — long-run rental-demand tailwind backs the buy-and-hold thesis.
- At projected returns (-3.0% appreciation + 5.5% rent growth), your $46k cash investment doubles in ~9 years — after that, you're playing with house money.
Negotiation context
- It's been on market 93 days — a 9% lower offer ($148k) is reasonable based on typical stale-listing flexibility.
- 7 sale attempts since 17y ago; this cycle's ask is 11549% above the opening price — seller raised mid-cycle; expect resistance to lowballs.
Risks & watch-outs
- Watch-outs: built in 1958 — expect roof / HVAC / electrical / plumbing capex.
- Climate carrying-cost: moderate wind risk, 26% chance of damaging wind over 30y; extreme-heat days projected 7→18/yr by 2055 (HVAC capex compounding) — expect insurance premiums to compound above CPI over the hold.
Questions for the listing agent
- It's been on market 93 days. Have you received any prior offers? Is the seller open to a 9% concession, seller financing, or rate buy-down credit?
- Built in 1958 — when were the roof, HVAC, electrical panel, plumbing, and water heater last replaced?
- Why hasn't it sold? Are there any deal-killer items the seller is aware of (foundation, flood, title, zoning, code violations)?
- Is there a deadline driving the sale (1031 exchange, divorce, estate, relocation)? That informs how much negotiation room exists.
- What's the average days-on-market for RENTAL listings here right now (not sales)? A rising rental-DOM trend means longer vacancies and softer asking-rent achievability than the comps imply.
- What's the recent tenant-quality profile in this submarket — average credit score on applications, eviction rate, late-payment / NSF rate, and stable-employment percentage? A property-management company in the area should have these aggregated.
- How much new for-sale + rental construction is in the pipeline within 1–3 miles? Heavy new supply typically softens prices + rents 12–24 months out; constrained supply supports both.
Investment metrics
- 1% rule
- 1.19% ✓
- Cap rate
- 9.05%
- Cash-on-cash
- 9.86%
- DSCR
- 1.44
- GRM
- 7.0
CMA / ARV
- ARV (median comp)
- $205,473
- List price
- $162,500
- Delta
- -20.91%
- Verdict
- UNDERPRICED
- Comps
- 20 within 1.0 mi
Show comp detail 12 sales within ~0.75 mi
| Address | Dist | Beds/Ba | Sqft | Sold | Price | $/sf | Match |
|---|---|---|---|---|---|---|---|
| 2786 Altaview Dr SE | 0.11mi | 4/2.0 (+1) | 990 (-2%) | 7mo | $225,400 | $228 | 76 |
| 305 Banberry Dr SE | 0.51mi | 3/1.0 | 1,000 (-1%) | 3mo | $135,000 | $135 | 72 |
| 287 Banberry Dr | 0.53mi | 3/2.0 | 1,025 (+1%) | 0mo | $225,000 | $220 | 69 |
| 233 Banberry Dr SE | 0.57mi | 3/2.0 | 1,025 (+1%) | 5mo | $185,000 | $180 | 64 |
| 2599 Browns Mill Rd SE | 0.30mi | 3/1.5 | 1,080 (+6%) | 12mo | $200,000 | $185 | 63 |
| 2651 Lois Ln SE | 0.48mi | 3/1.5 | 986 (-3%) | 11mo | $195,000 | $198 | 62 |
| 51 Springside Dr SE | 0.49mi | 2/1.0 (-1) | 1,000 (-1%) | 10mo | $165,000 | $165 | 61 |
| 251 Banberry Dr SE | 0.56mi | 3/1.0 | 1,025 (+1%) | 14mo | $135,000 | $132 | 61 |
| 2608 Macon Dr SW | 0.55mi | 3/1.5 | 1,080 (+6%) | 13mo | $204,000 | $189 | 51 |
| 2920 Springside Pl SE | 0.46mi | 3/2.0 | 1,100 (+8%) | 14mo | $196,000 | $178 | 48 |
| 245 Bromack Dr SE | 0.62mi | 3/2.0 | 1,100 (+8%) | 10mo | $170,000 | $155 | 45 |
| 2800 Macon Dr SE | 0.45mi | 3/2.0 | 1,161 (+14%) | 10mo | $215,000 | $185 | 42 |
Match score weights: distance 35% · size 25% · config 20% · recency 20%. Top-matched comps best support the ARV.
Projected returns pro-forma
-3.0% appreciation · 5.45% rent growth · sell at horizon
- IRR
- 1.3%
- Equity multiple
- 1.05×
- Total profit
- $2,392
- Equity at exit
- $24,229
- IRR
- 13.3%
- Equity multiple
- 2.19×
- Total profit
- $53,954
- Equity at exit
- $14,050
Cash invested: $45,500 (down + closing). Projections, not guarantees.
Landlord ↔ Tenant lean methodology
- Overall (STATE)
- 90 Strongly Landlord-Friendly
- State Georgia
- 90 Strongly Landlord-Friendly · R+3
- County
- — inherits STATE
- City
- — inherits STATE
ZIP-level market 30354
- Home prices YoY
- -17.5%
- Rents YoY
- 5.5%
- Active inventory
- 179
- Price-to-rent
- 7.0×
Monthly cashflow live
- Estimated rent
- $1,930 high interval (Pro) →
- Mortgage (P&I)
- −$852
- Tax from tax record
- −$231 /mo · $2,775/yr
- Insurance
- −$68
- HOA
- −$0
- Vacancy / Maint / Mgmt
- −$405
- Net cashflow
- $374
Break-even live
Sensitivity live
| Price | -10% $466 | -5% $420 | +0% $374 | +5% $328 | +10% $282 |
|---|---|---|---|---|---|
| Rent | -10% $221 | -5% $297 | +0% $374 | +5% $450 | +10% $526 |
| Rate | -1.0pp $456 | -0.5pp $415 | base $374 | +0.5pp $332 | +1.0pp $289 |
UW: 25.0% down · 7.5% · 30yr · 1.5% tax · 5.0% vac · 8.0% maint · 8.0% mgmt
Financing live
Cash to close
- Down payment
- $40,625
- Closing costs
- $4,875
- Reserves months
- —
- Total cash needed
- —
Loan-product check · same deal, 3 products live
Conventional
25% down · 7.5% · 30yr
- Down + closing
- —
- Monthly P&I
- —
- Monthly cashflow
- —
- DSCR
- —
- Eligible?
- —
Personal DTI + credit; lowest rate.
DSCR
20% down · 8.5% · 30yr
- Down + closing
- —
- Monthly P&I
- —
- Monthly cashflow
- —
- DSCR
- —
- Eligible?
- —
No personal income docs; deal must DSCR.
Hard money
10% down · 12.0% · 12mo
- Down + closing
- —
- Monthly P&I
- —
- Monthly cashflow
- —
- DSCR
- —
- Eligible?
- —
Short-term bridge; refi at stabilization.
Rent comps 38 comps
| Address | Beds | Baths | Sqft | Rent | $/sqft | DOM | Units | Dist |
|---|---|---|---|---|---|---|---|---|
| 2694 Fairlane Dr SE Atlanta, GA | 4.0 | 2.0 | 1372 | $2,800 | $2.04 | 26d | 1 | 0.09mi |
| 445 Cleveland Ave SE Atlanta, GA | 2.0–3.0 | 1.0–2.0 | 1014 | $1,591 | $1.57 | 3d | 13 | 0.21mi |
| 305 Banberry Dr SE Atlanta, GA | 3.0 | 1.0 | 1000 | $1,550 | $1.55 | 0d | 1 | 0.50mi |
| 167 Alyson Ct SE Atlanta, GA | 4.0 | 2.0 | 1344 | $1,825 | $1.36 | 26d | 1 | 0.66mi |
| 136 Hillsdale Dr SE Atlanta, GA | 3.0 | 2.0 | 1075 | $1,995 | $1.86 | 26d | 1 | 0.67mi |
| 2786 Old Hapeville Rd SW Atlanta, GA | 2.0 | 1.5 | 1050 | $1,150 | $1.10 | 26d | 1 | 0.73mi |
| 500 Hutchens Rd SE Atlanta, GA | 4.0 | 2.0 | 1248 | $2,400 | $1.92 | 18d | 1 | 0.75mi |
| 2745 Old Hapeville Rd SW Atlanta, GA | 2.0–3.0 | 2.0 | 1007 | $1,375 | $1.36 | 17d | 1 | 0.78mi |
| 585 McWilliams Rd SE #104 Atlanta, GA | 2.0 | 3.0 | 1500 | $2,078 | $1.39 | 21d | 1 | 0.84mi |
| 210 Oak Dr SE Atlanta, GA | 3.0 | 2.0 | 1330 | $1,400 | $1.05 | 26d | 1 | 0.87mi |
| 2332 Baywood Dr SE Atlanta, GA | 3.0 | 2.0 | 1100 | $1,400 | $1.27 | 19d | 1 | 0.88mi |
| 3188 Ward Dr SW Atlanta, GA | 3.0 | 1.5 | 1025 | $1,800 | $1.76 | 13d | 1 | 0.91mi |
| 633 Sandys Ln SE Atlanta, GA | 3.0 | 2.0 | 1314 | $1,950 | $1.48 | 7d | 1 | 0.93mi |
| 45 Baker Dr SW Atlanta, GA | 3.0 | 2.0 | 1056 | $1,600 | $1.52 | 26d | 1 | 0.95mi |
| 324 Macedonia Rd SE Atlanta, GA | 3.0 | 1.0 | 1000 | $1,295 | $1.29 | 9d | 1 | 1.04mi |
| 386 Lindsey Dr SE Atlanta, GA | 3.0 | 1.0 | 1040 | $1,793 | $1.72 | 0d | 1 | 1.05mi |
| 76 Schell Rd SE Atlanta, GA | 3.0 | 1.0 | 1080 | $1,623 | $1.50 | 26d | 1 | 1.08mi |
| 3054 Waters Rd SW Atlanta, GA | 3.0 | 1.0 | 891 | $1,800 | $2.02 | 9d | 1 | 1.13mi |
| 3066 Waters Rd SW Atlanta, GA | 3.0 | 1.0 | 1144 | $1,395 | $1.22 | 21d | 1 | 1.15mi |
| 2800 Grand Ave SW Atlanta, GA | 3.0 | 1.0 | 1052 | $1,600 | $1.52 | 0d | 1 | 1.15mi |
| 2268 Polar Rock Pl SW Atlanta, GA | 3.0 | 1.0 | 925 | $1,575 | $1.70 | 26d | 1 | 1.17mi |
| 382 Cologne Dr SE Atlanta, GA | 3.0 | 1.0 | 1100 | $1,400 | $1.27 | 0d | 1 | 1.19mi |
| 871 Hargis St SE Atlanta, GA | 2.0 | 2.0 | 1040 | $1,800 | $1.73 | 26d | 1 | 1.20mi |
| 2959 Forrest Hills Dr SW Atlanta, GA | 1.0–2.0 | 1.0–1.5 | 925 | $1,250 | $1.35 | 15d | 1 | 1.21mi |
| 2959 Forrest Hills Dr SW Atlanta, GA | 1.0–2.0 | 1.0–1.5 | 925 | $1,250 | $1.35 | 18d | 2 | 1.21mi |
| 2145 Macon Dr SW Atlanta, GA | 3.0 | 1.0 | 1059 | $1,450 | $1.37 | 26d | 1 | 1.22mi |
| 331 Simca St SE Atlanta, GA | 3.0 | 1.0 | 1000 | $1,700 | $1.70 | 4d | 1 | 1.25mi |
| 172 Meador Way SE Atlanta, GA | 3.0 | 2.0 | 1100 | $1,950 | $1.77 | 26d | 1 | 1.26mi |
| 2197 Polar Rock Pl SW Atlanta, GA | 3.0 | 2.5 | 1000 | $2,700 | $2.70 | 22d | 1 | 1.27mi |
| 73 Polar Rock Rd SW Atlanta, GA | 3.0 | 1.0 | 1098 | $1,850 | $1.68 | 12d | 1 | 1.30mi |
| 2087 Lakewood Trl SE Atlanta, GA | 3.0 | 2.5 | 1056 | $2,256 | $2.14 | 26d | 1 | 1.33mi |
| 837 Forrest Cir SE Atlanta, GA | 3.0 | 2.0 | 1500 | $1,845 | $1.23 | 26d | 1 | 1.35mi |
| 231 Maple St Atlanta, GA | 3.0 | 2.0 | 1068 | $1,645 | $1.54 | 45d | 1 | 1.37mi |
| 1037 Rebel Forest Dr SE Atlanta, GA | 3.0 | 2.0 | 1075 | $1,750 | $1.63 | 26d | 1 | 1.38mi |
| 2875 3rd Ave SW Unit A Atlanta, GA | 2.0 | 1.0 | 900 | $1,245 | $1.38 | 3d | 1 | 1.41mi |
| 436 Grady Pl Atlanta, GA | 3.0 | 2.0 | 1425 | $2,100 | $1.47 | 17d | 1 | 1.45mi |
| 278 Moreland Way Atlanta, GA | 3.0 | 2.0 | 1000 | $1,945 | $1.95 | 26d | 1 | 1.45mi |
| 340 Adelle St SE Atlanta, GA | 3.0 | 1.0 | 1122 | $1,500 | $1.34 | 4d | 1 | 1.46mi |
Listing history 44 events
-
2026-06-21days on market $162,500 Active 93 DOM
-
2026-06-18days on market $162,500 Active 90 DOM
-
2026-06-17days on market $162,500 Active 89 DOM
-
2026-06-16days on market $162,500 Active 88 DOM
-
2026-06-15days on market $162,500 Active 87 DOM
-
2026-06-13days on market $162,500 Active 85 DOM
-
2026-06-13days on market $162,500 Active 84 DOM
-
2026-06-09days on market $162,500 Active 81 DOM
-
2026-06-08days on market $162,500 Active 80 DOM
-
2026-06-07days on market $162,500 Active 79 DOM
-
2026-06-04days on market $162,500 Active 76 DOM
-
2026-06-03days on market $162,500 Active 75 DOM
-
2026-06-02days on market $162,500 Active 74 DOM
-
2026-06-01days on market $162,500 Active 73 DOM
-
2026-05-31days on market $162,500 Active 72 DOM
-
2026-04-23historical $1,395
-
2026-04-21$1,395
-
2026-04-20historical $1,395
-
2026-04-10price $1,395
-
2026-03-20$165,000 New 469-char remark
Show marketing remark (481 chars)
Brand Bathroom and New LVP Through out the house Fully refreshed and move-in ready! This charming home features brand-new flooring, fresh interior paint, and a modern double vanity in the bathroom for a sleek, updated look. Enjoy a bright, open layout that’s perfect for everyday living and entertaining. Conveniently located near downtown Atlanta and major highways, this property offers both comfort and accessibility—whether you're a first-time buyer or investor.
-
2026-03-20$165,000 Active 481-char remark
Show marketing remark (481 chars)
Brand Bathroom and New LVP Through out the house Fully refreshed and move-in ready! This charming home features brand-new flooring, fresh interior paint, and a modern double vanity in the bathroom for a sleek, updated look. Enjoy a bright, open layout that’s perfect for everyday living and entertaining. Conveniently located near downtown Atlanta and major highways, this property offers both comfort and accessibility—whether you're a first-time buyer or investor.
-
2026-03-19historical
-
2026-02-20price $174,900
-
2026-01-13price $179,900
-
2025-12-24price $1,495
-
2025-11-30price $189,900
-
2025-11-26price $1,595
-
2025-11-05price $1,695
-
2025-10-31price $1,795
-
2025-10-17$1,895
-
2025-10-16price $194,900
-
2025-10-06price $199,900
-
2025-10-05status Back On Market
-
2025-09-05historical On Hold
-
2025-08-26price $204,900
-
2025-08-20price $209,500
-
2025-08-05price $214,900
-
2025-07-28$219,000 New
-
2021-07-14soldstatus $264,697
-
2016-11-14soldstatus $45,000
-
2009-12-07soldstatus $15,500
-
2009-10-28$15,500
-
2002-06-05soldstatus $71,100
-
1980-09-12soldstatus $33,000
ⓘ Source: listings_history table (triggers on properties + properties_extension) + one-shot
backfill from property_details.listing_events for pre-trigger history.
Tax reassessment forecast GA · Resets to sale price
- Current annual tax
- $2,775 · $231/mo
- Projected year-2 tax
- $2,775 · $231/mo
- Expected delta
- $0/yr ($0/mo · 0.0%)
ⓘ Screening estimate from a state-policy table — verify with the county assessor before closing.
Climate risk First Street
- Flood 1/10 Low FEMA zone X (unshaded) · 0% chance over 30 yrs
- Wildfire 3/10 Moderate
- Heat 6/10 Major 7 d/yr ≥104°F today · 18 d/yr by 30 yrs out
- Wind 5/10 Major 26% chance of damaging wind over 30 yrs
- Air quality 4/10 Moderate 4 unhealthy d/yr today · 6 by 30 yrs out
Nearby sold comps map
Loading sold comps map…
Walkable amenities ~0.75 mi
Loading nearby amenities…
Taxation est. · year 1
- Rental income
- $23,163
- − Mortgage interest
- −$9,103
- − Property taxes
- −$2,775
- − Insurance
- −$812
- − Repairs & maintenance
- −$1,853
- − Management
- −$1,853
- − Depreciation
- −$4,727
- Taxable income
- $2,039
- Est. tax owed @ 24.0%
- −$489
- After-tax cash flow
- $3,995/yr
For passive investors: Depreciation is non-cash, so a rental often shows a tax loss while cash-flowing — sheltering income. Rental losses are passive: they offset passive income freely, and up to $25,000/yr can offset ordinary (W-2) income if you actively participate and your MAGI is under $100k (phasing out to $0 by $150k); unused losses carry forward. On sale, claimed depreciation is recaptured at up to 25%, and gains may owe capital-gains tax (a 1031 exchange can defer both). Figures are a year-1 estimate at your 24.0% rate — not tax advice; consult a CPA.
Schools (NCES district)
- District
- Atlanta Public Schools
- NCES district ID
- 1300120
- Math proficiency
- 28% ▼ -6.00%
- Reading proficiency
- 35% ▼ -2.00%
- Median HH income
- $48,306
- Composite
- 27.27/100
- National rank
- #7006
- State rank
- #80 of 174 in GA
Livability — Atlanta
- Score
- 83/100
- State rank
- #6
- US rank
- #919
Category grades
Schools grade is shown separately in the Schools card above.
Census & demographics
- Census place
- Atlanta, GA
- County
- Fulton County · 1,094,430 people
- City population
- 629,525
- Metro
- Atlanta-Sandy Springs-Alpharetta, GA
- Population (ZIP)
- 16,182
- Household income
- $63,189
- Rent vs Own
- Severe rent burden
- 930.0
Population outlook (Fulton County) Hauer SSP2
- Today (2025)
- 1,203,707 people
- By 2030
- 1,299,706 · +8.0%
- By 2040
- 1,488,256 · +23.6%
- By 2050
- 1,664,580 · +38.3%
- By 2075
- 2,036,072 · +69.2%
- By 2100
- 2,222,402 · +84.6%
Race, ethnicity, and origin ACS 2023
- Neighborhood character
- Predominantly Black (68%)
- Race & ethnicity
- Black 68% Hispanic / Latino 16% White 10% Two or more races 9% Native American 2% Asian 1%
- Hispanic origin (detail)
- Mexican 13%
- Common ancestry
- Italian 2% Romanian 1% Swedish 1%
- Foreign-born
- 11% · Canada, Vietnam, Guatemala
- Languages at home
- 81% English-only · Spanish 15% German/W. Germanic 1% Vietnamese 1%
Political lean MEDSL · Fulton
- 2024 margin
- Solid D (+44.9) · D 71.9% · R 27.0% · Other 1.1%
- 2008→2024 swing
- +9.8pp toward D · 2008: 35.0pp · 2024: 44.9pp
- All cycles
- 2024: D+44.9 2020: D+46.4 2016: D+42.1 2012: D+29.6 2008: D+35.0
Not yet ingested
- Civics
- —
Market trends
- HPI YoY
- ▼ -67.78%
- Current HPI
- 320.1111
- Rent YoY
- ▲ 5.45%
- Metro
- Atlanta-Sandy Springs-Alpharetta, GA
- State GDP YoY
- ▲ 2.66%
- F500 in state
- 28
Industry mix (Fortune 500 HQ in GA)
| Industry | F500 HQs | Revenue |
|---|---|---|
| Paper / Packaging | 2 | $29B |
|
||
| Retail | 1 | $160B |
|
||
| Transportation / Logistics | 1 | $91B |
|
||
| Airlines | 1 | $62B |
|
||
| Consumer Goods | 1 | $47B |
|
||
| Utilities | 1 | $25B |
|
||
Price history
-95.8% since first listed29 events — show timeline
- 2026-04-23 Rental Removed $1,395 RENTSPREE
- 2026-04-21 Listed for Rent $1,395 RENTSPREE
- 2026-04-20 Rental Removed $1,395 FMLS
- 2026-04-10 Price Changed $1,395 FMLS
- 2026-03-20 Listed $165,000 FMLS
- 2026-03-20 Listed $165,000 GAMLS
- 2026-03-19 Listing Removed — GAMLS
- 2026-02-20 Price Changed $174,900 GAMLS
- 2026-01-13 Price Changed $179,900 GAMLS
- 2025-12-24 Price Changed $1,495 FMLS
- 2025-11-30 Price Changed $189,900 GAMLS
- 2025-11-26 Price Changed $1,595 FMLS
- 2025-11-05 Price Changed $1,695 FMLS
- 2025-10-31 Price Changed $1,795 FMLS
- 2025-10-17 Listed for Rent $1,895 FMLS
- 2025-10-16 Price Changed $194,900 GAMLS
- 2025-10-06 Price Changed $199,900 GAMLS
- 2025-10-05 Relisted — GAMLS
- 2025-09-05 Delisted — GAMLS
- 2025-08-26 Price Changed $204,900 GAMLS
- 2025-08-20 Price Changed $209,500 GAMLS
- 2025-08-05 Price Changed $214,900 GAMLS
- 2025-07-28 Listed $219,000 GAMLS
- 2021-07-14 Sold (Public Records) $264,697 Public Records
- 2016-11-14 Sold (Public Records) $45,000 Public Records
- 2009-12-07 Sold (MLS) $15,500 FMLS
- 2009-10-28 Listed $15,500 FMLS
- 2002-06-05 Sold (Public Records) $71,100 Public Records
- 1980-09-12 Sold (Public Records) $33,000 Public Records
Property tax history
+3.3%/yrLatest (2025): $2,775 · -0.1% YoY. Source: county tax records.
Cash-flow waterfall
monthlySold comps — $/sqft
last 12 mo · ≤1 miLoading sold comps…